Qaasid News
Download Our App
Latest News
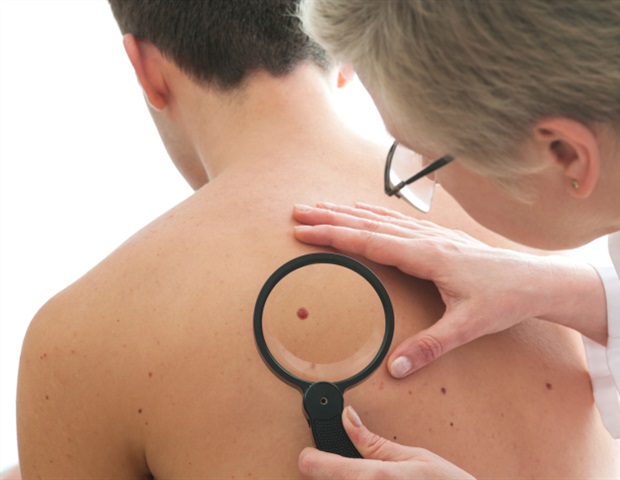
New dual drugs eliminate tumors when combined with immunotherapy
April 2, 2026
Flipboard Surf launches social websites combining Bluesky, Mastodon, RSS, and more
April 2, 2026
‘Slavery bounded his life’: Thomas Jefferson’s views on race – in his own words | Books
April 2, 2026
This is Chiara, turbomachinery test bench leader and photographer
April 2, 2026
Super Battle Golf Update Coming April 9th! FROZEN FAIRWAY Update – Snow courses, wind mechanics, and new items
April 2, 2026
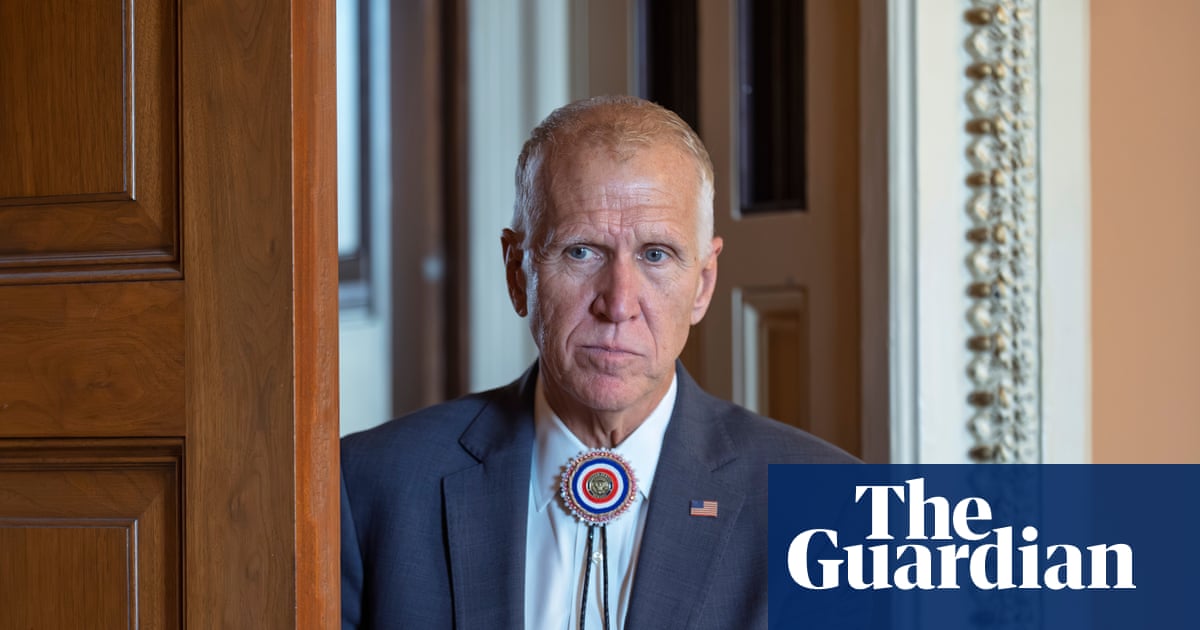
Republican senators break with Trump on Nato withdrawal as tensions rise | Trump administration
April 2, 2026
Meryl Streep Reignites the Cerulean Debate In Custom J.Crew
April 2, 2026
Amazon launches steeper discounts on new M5 MacBook Air models – AppleInsider
April 2, 2026
NBA Mailbag: What are final weeks like for teams in playoff chases?
April 2, 2026
Uzbekistan lauds Pakistan's role in promoting regional peace – RADIO PAKISTAN
April 2, 2026