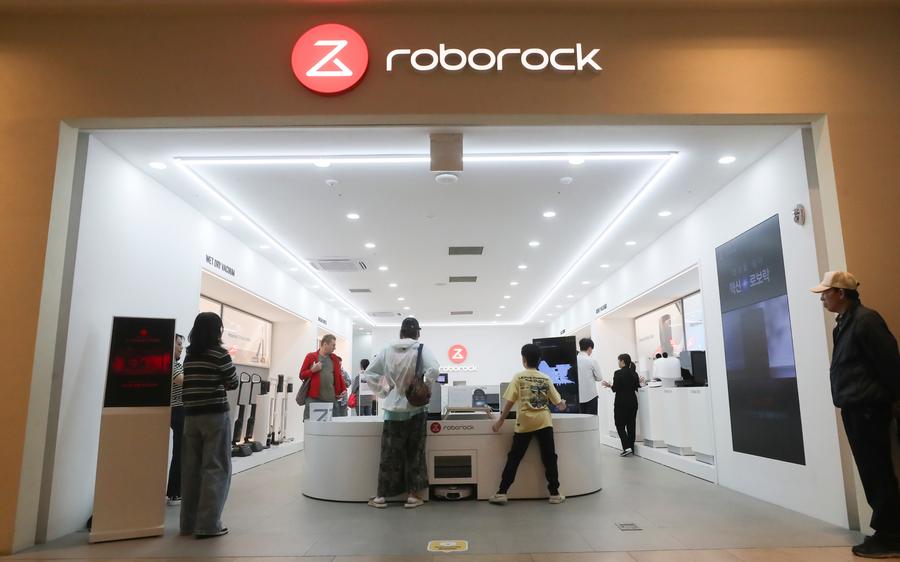
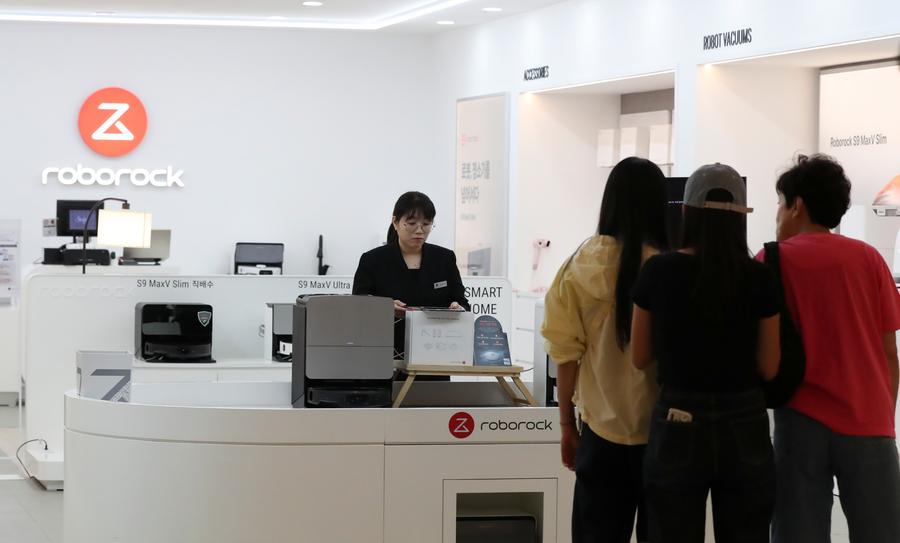
Customers visit a Roborock store at a shopping mall in Seoul, South Korea, Oct. 12, 2025. (Xinhua/Yao Qilin)
BEIJING, Oct. 25 (Xinhua) — At a large shopping mall in Seoul, South Korea, a Chinese brand’s robot vacuum cleaner attracted bustling crowds. A Roborock robot vacuum cleaner, equipped with a robotic arm, precisely picked up a sock, rotated, and threw it into a box, drawing cheers from the audience.
According to data from a U.S. research firm, Roborock holds over 50 percent market share in South Korea’s robot vacuum cleaner market, firmly securing the top position, with a dominance market share exceeding 70 percent in the high-end market.
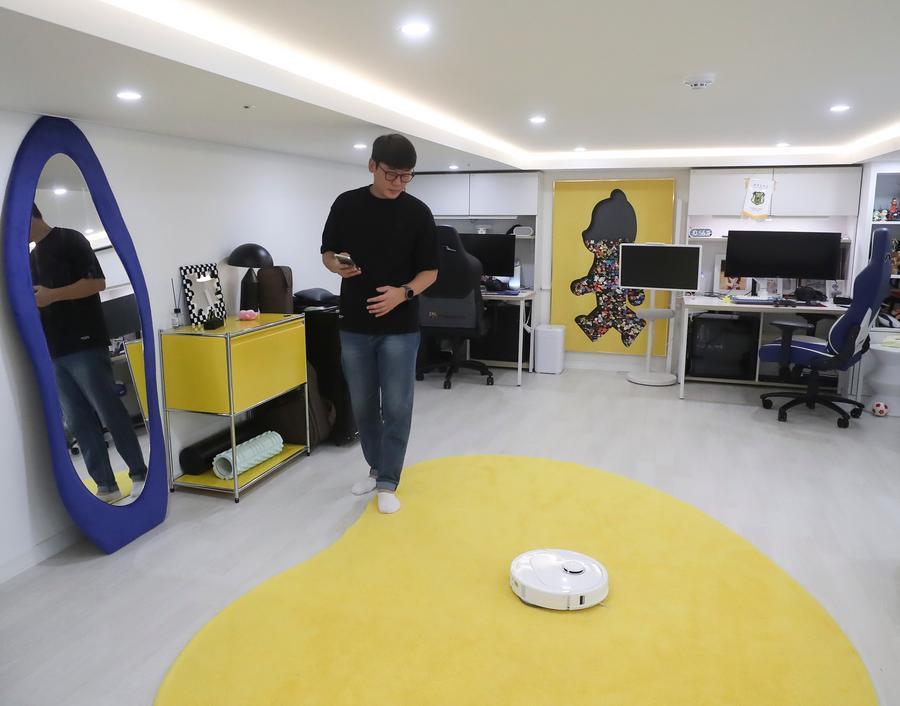
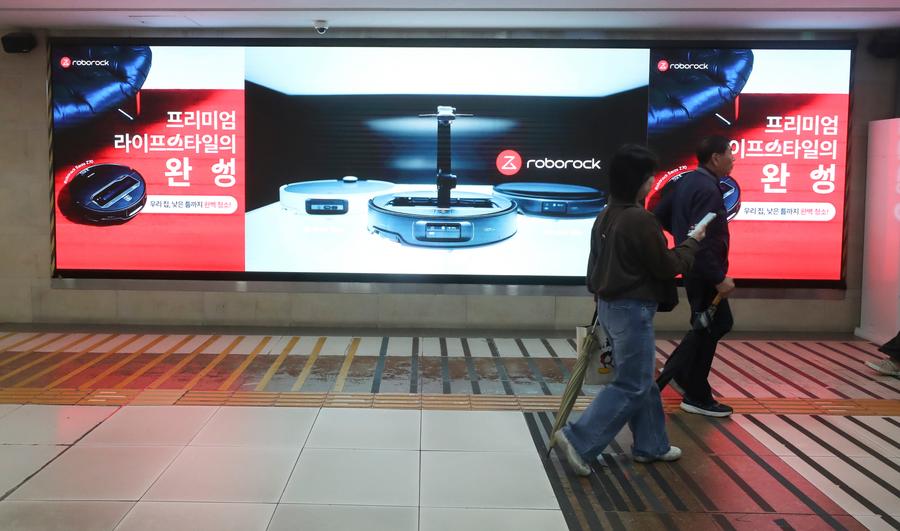
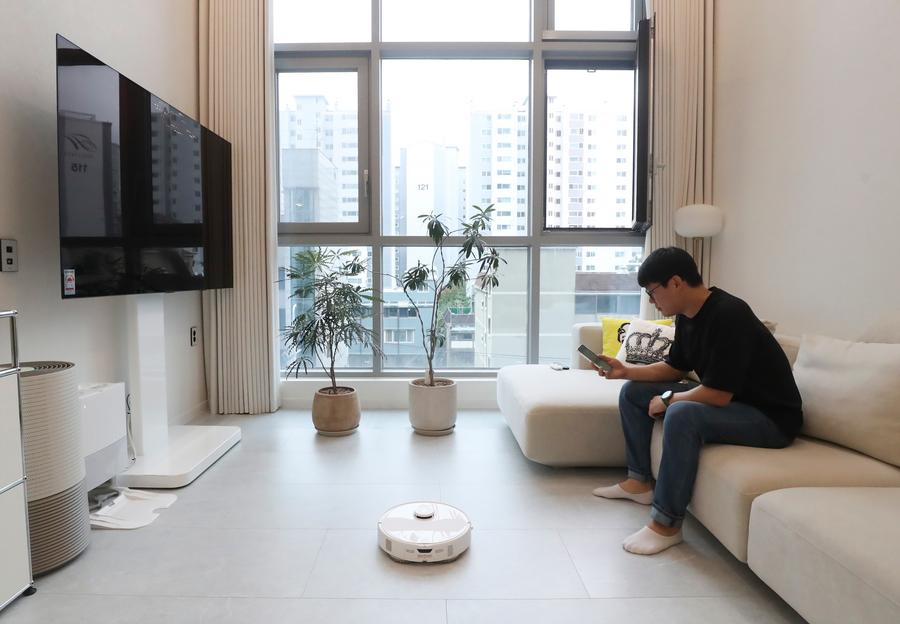
People watch the demonstration of a robot vacuum cleaner at a shopping mall in Seoul, South Korea, Oct. 12, 2025.(Xinhua/Yao Qilin)A costumer uses a robot vacuum cleaner at his home in Seoul, South Korea, Oct. 13, 2025. (Xinhua/Yao Qilin)People walk by a billboard of Roborock at a subway station in Seoul, South Korea, Oct. 13, 2025. (Xinhua/Yao Qilin)Customers visit a Roborock store at a shopping mall in Seoul, South Korea, Oct. 12, 2025. (Xinhua/Yao Qilin)A costumer uses a robot vacuum cleaner at his home in Seoul, South Korea, Oct. 13, 2025. (Xinhua/Yao Qilin)
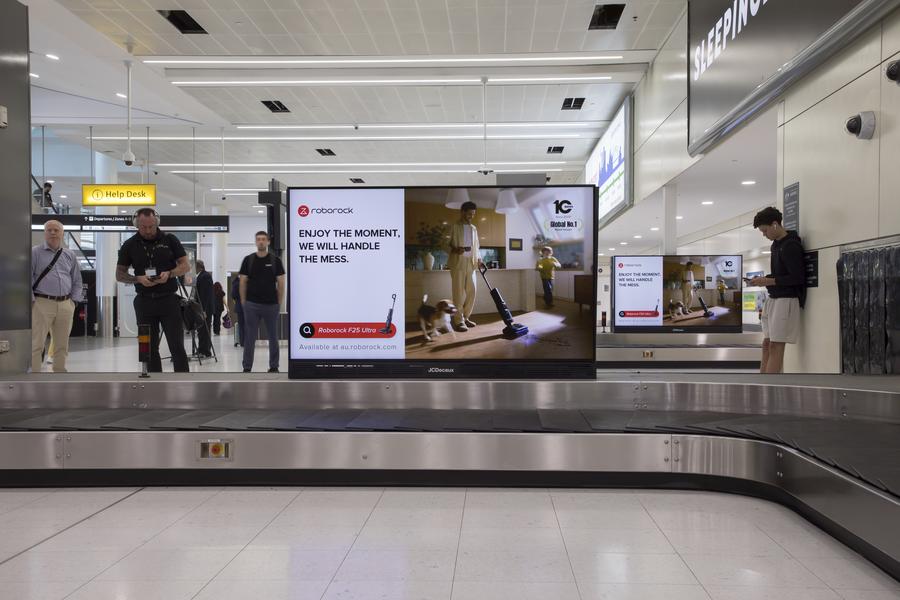
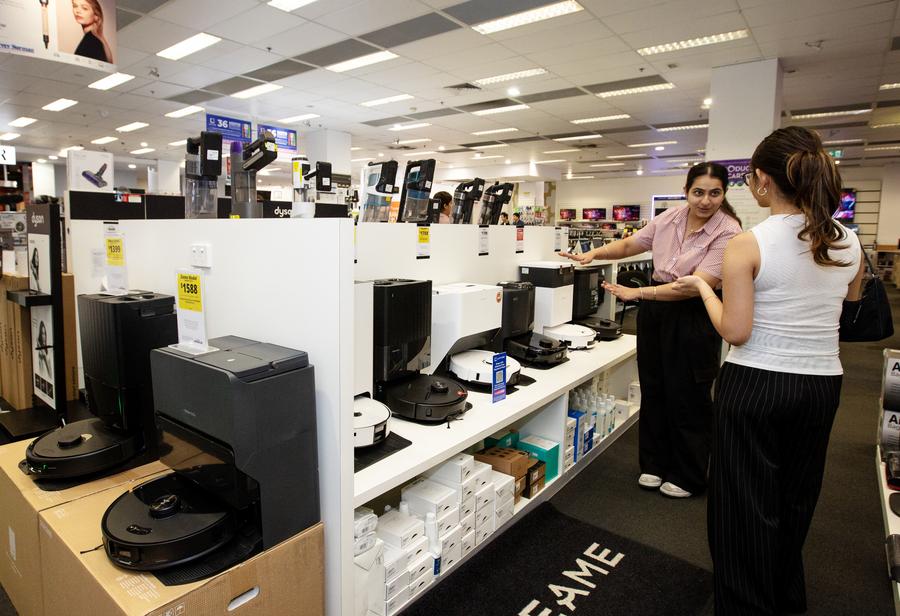
Beyond South Korea, Roborock is rapidly expanding across other Asia-Pacific markets. In Japan, during a promotion on Amazon Japan, several Roborock products ranked among the most popular robot vacuum cleaners. In Australia, its products also made it into the top ten best-selling robot vacuum cleaner list.
This photo taken on Oct. 16, 2025 shows an advertisement of Roborock at a home appliance store in Tokyo, Japan. (Xinhua/Jia Haocheng)This photo taken on Oct. 16, 2025 shows advertisements of Roborock at a home appliance store in Tokyo, Japan. (Xinhua/Jia Haocheng)This photo taken on Oct. 19, 2025 shows billboards of Roborock at Sydney Airport in Sydney, Australia.(Roborock/Handout via Xinhua)A shop assistant introduces Chinese brand robot vacuum cleaners to a customer at a home appliance store in downtown Sydney, Australia, Oct. 13, 2025. (Xinhua/Ma Ping)
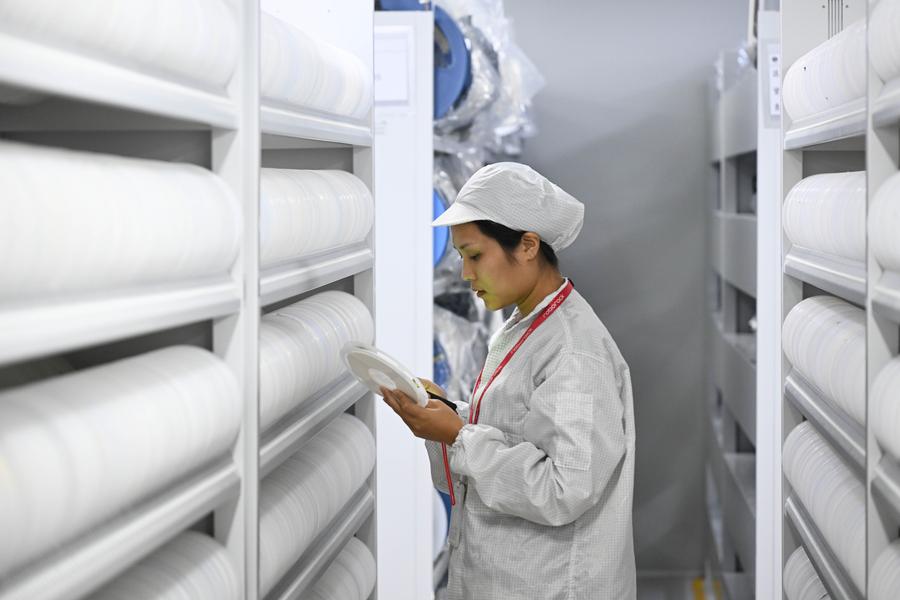
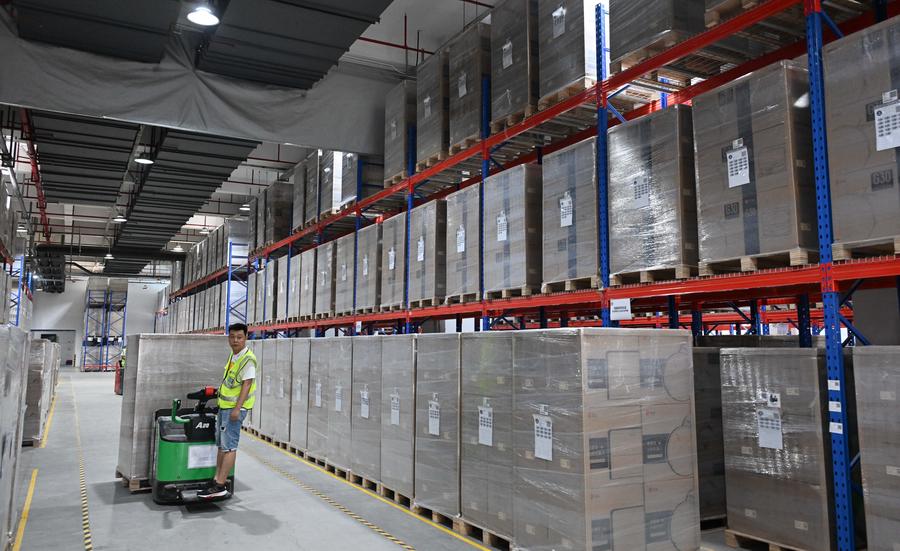
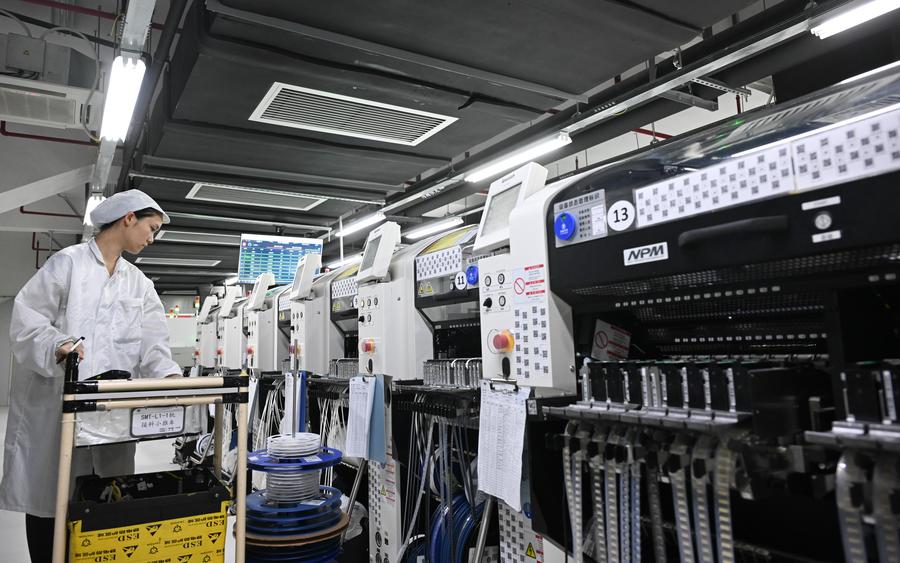
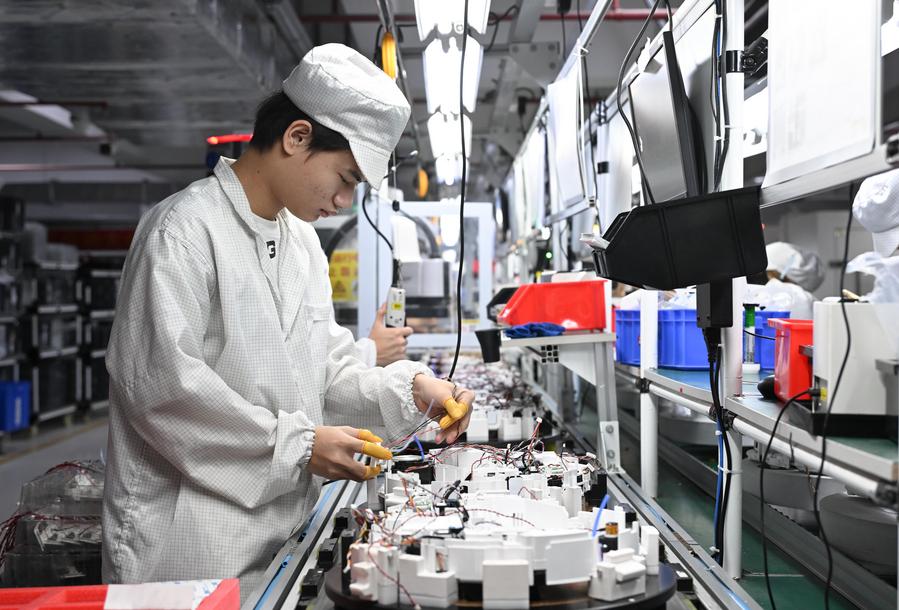
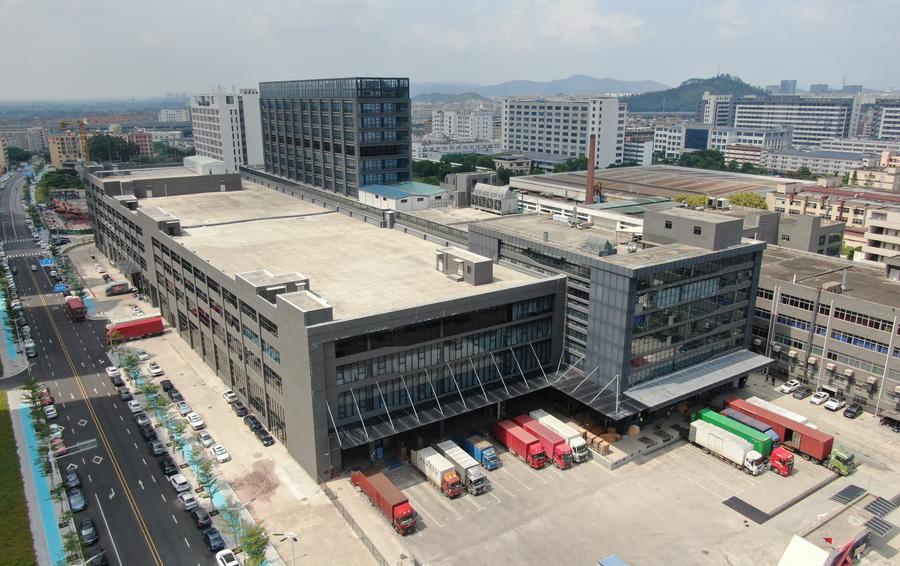
Over 2,000 kilometers away from South Korea, in Huizhou City of south China’s Guangdong Province, Roborock’s smart manufacturing facility operates at high efficiency, with robot vacuum cleaners continuously distributed worldwide.
From workshops in China to living rooms across Asia-Pacific, Chinese brands for robot vacuum cleaners have gained popularity among foreign customers.
A staff member searches for information at a warehouse of Roborock in Huizhou, south China’s Guangdong Province, Oct. 10, 2025. (Xinhua/Deng Hua)A staff member transports robot vacuum cleaner products in Huizhou, south China’s Guangdong Province, Oct. 10, 2025. (Xinhua/Deng Hua)A staff member works at a workshop of Roborock in Huizhou, south China’s Guangdong Province, Oct. 10, 2025.(Xinhua/Deng Hua)Staff members work on a robot vacuum cleaner assembly line at a workshop of Roborock in Huizhou, south China’s Guangdong Province, Oct. 10, 2025. (Xinhua/Deng Hua)An aerial drone photo taken on Oct. 10, 2025 shows logistics trucks waiting for loading and delivery at a Roborock facility in Huizhou, south China’s Guangdong Province.(Xinhua/Deng Hua)■
Say hello to ionocaloric cooling. It’s a new way to lower temperatures with the potential to replace existing methods of chilling things with a process that is safer and better for the planet.
Typical refrigeration systems transport heat away…
Intuitive Machines (LUNR) has drawn fresh attention as investors weigh the impact of new US export curbs on tech to China. At the same time, the company is advancing its IM-3 lunar mission and securing NASA contracts.
See our latest analysis for Intuitive Machines.
Intuitive Machines stock has whipped through a period of volatility, recently clawing back gains with a 28% share price return over the past month despite ongoing US-China export tensions and scrutiny following past missions. Although year-to-date share price return remains in negative territory, the strong one-year total shareholder return of 60% suggests that long-term momentum is still firmly alive for patient investors.
If space tech’s recent rally has sparked your curiosity, you can see what’s happening across the entire sector with our aerospace and defense discovery screener using the following link: See the full list for free.
Given its recent contract wins, strong analyst sentiment, and a price still about 20 percent below consensus targets, are investors overlooking an undervalued space innovator? Or is future growth already built into the current share price?
With Intuitive Machines closing at $12.81 and the most widely followed narrative placing fair value at $15.43, this perspective sets a higher bar than the current market price. This hints at room for re-rating if assumptions hold.
Strategic vertical integration of satellite and lander manufacturing, along with proprietary advancements from the KinetX acquisition, enhances cost efficiencies, IP control, and technological differentiation. These factors support higher net margins and competitive pricing power as the company scales recurrent service contracts across civil, defense, and commercial markets.
Read the complete narrative.
Want to see what assumptions drive this bullish view? The narrative’s fair value hinges on powerful expansion bets, bold profit transformation, and sky-high valuation multiples rarely seen outside tech’s heavyweights. Curious which projections could justify such optimism? Discover the numbers on the next page.
Result: Fair Value of $15.43 (UNDERVALUED)
Have a read of the narrative in full and understand what’s behind the forecasts.
However, persistent losses and heavy reliance on large government contracts could quickly dampen the bullish outlook if execution or funding falls short.
Find out about the key risks to this Intuitive Machines narrative.
While Intuitive Machines looks attractive when compared to its fair value estimate, a look at its price-to-sales ratio tells a different story. The company is trading at 6.7 times its sales, which is much higher than the US Aerospace & Defense industry average of 3.2 and the peer average of 2.7. The market’s fair ratio, based on regression analysis, stands at just 1.4 times sales. This large gap suggests considerable valuation risk if the company fails to maintain its growth edge. Which view should investors trust?
See what the numbers say about this price — find out in our valuation breakdown.
NasdaqGM:LUNR PS Ratio as at Oct 2025
If you think there’s another angle to the Intuitive Machines story or want to dig into the numbers yourself, you can shape your own take on the company in just a few minutes. Do it your way.
A great starting point for your Intuitive Machines research is our analysis highlighting 2 key rewards and 1 important warning sign that could impact your investment decision.
Seize your chance to get ahead by uncovering opportunities that others might miss. Simply Wall Street’s screeners give you unique insights to sharpen your investment strategy.
This article by Simply Wall St is general in nature. We provide commentary based on historical data and analyst forecasts only using an unbiased methodology and our articles are not intended to be financial advice. It does not constitute a recommendation to buy or sell any stock, and does not take account of your objectives, or your financial situation. We aim to bring you long-term focused analysis driven by fundamental data. Note that our analysis may not factor in the latest price-sensitive company announcements or qualitative material. Simply Wall St has no position in any stocks mentioned.
Companies discussed in this article include LUNR.
Have feedback on this article? Concerned about the content? Get in touch with us directly. Alternatively, email editorial-team@simplywallst.com
Eni (BIT:ENI) reported earnings growth of 4% per year and revenue growth of 3.8% per year, both trailing the broader Italian market’s expectations of 9.7% earnings and 5% revenue growth. The company’s net profit margin shrank to 2.6% from 4.1% a year earlier. With profitability improving over the last five years and high-quality earnings, investors are weighing the premium Price-To-Earnings Ratio of 21.1x (above industry and peer averages) against a market price that still sits below the discounted cash flow fair value.
See our full analysis for Eni.
Next, we will see how these headline figures stack up against the prevailing narratives that investors follow—and where the data might surprise.
See what the community is saying about Eni
BIT:ENI Earnings & Revenue History as at Oct 2025
Analysts forecast that Eni’s profit margin will rise from 2.6% today to 5.8% in three years, even as revenue is projected to decrease by 0.7% per year over the same period.
According to the analysts’ consensus view, margin expansion is supported by:
Growth in higher-margin businesses like biorefining and sustainable mobility, with new biorefinery projects and partnerships fueling expanded revenue streams and better return on equity.
Strategic LNG expansion and diversification, specifically new projects in Africa and Asia, add resilience to earnings and help offset declining revenue in legacy operations.
Strong margin outlook could underpin future shareholder returns. See how the consensus narrative interprets this shift in direction. 📊 Read the full Eni Consensus Narrative.
Persistent losses in Eni’s Versalis (chemicals and downstream) division, with management noting a “lack of meaningful economic recovery” in this European sector, continue to drag on group earnings and introduce ongoing margin pressure.
Analysts’ consensus view notes two main risk areas:
Legacy businesses like Versalis generate negative free cash flow, and expected only “slight improvement” in margin outlook, raising concerns about lasting drag on net profits.
Eni’s upstream expansion in regions such as Africa and Argentina boosts production potential but increases exposure to regulatory and expropriation risks, which could disrupt future revenue streams or lead to asset losses.
Eni trades at a Price-To-Earnings Ratio of 21.1x, far above the industry and peer averages (14.5x and 14.7x). Yet its share price of €15.84 remains below both consensus analyst target (€15.75) and DCF fair value (€19.76).
Analysts’ consensus view underlines:
The small 2.9% difference between the current share price and the €15.75 consensus target suggests limited immediate upside. This implies the stock is close to being fairly priced in the eyes of most analysts.
Holding a valuation premium may weigh on sentiment if Eni’s forecasted growth continues to lag the broader Italian market. However, the DCF fair value offers longer-term support for investors who see further profitability gains.
To see how these results tie into long-term growth, risks, and valuation, check out the full range of community narratives for Eni on Simply Wall St. Add the company to your watchlist or portfolio so you’ll be alerted when the story evolves.
Have a unique take on these results? Bring your perspective to life and shape your story in just a few minutes with us. Do it your way
A great starting point for your Eni research is our analysis highlighting 2 key rewards and 2 important warning signs that could impact your investment decision.
Eni faces challenges as its forecast revenue shrinks and growth lags the Italian market. Persistent losses in key divisions also strain future prospects.
If you want steady earnings and reliable growth, use our stable growth stocks screener (2099 results) to find companies that consistently expand revenue and profits through all market cycles.
This article by Simply Wall St is general in nature. We provide commentary based on historical data and analyst forecasts only using an unbiased methodology and our articles are not intended to be financial advice. It does not constitute a recommendation to buy or sell any stock, and does not take account of your objectives, or your financial situation. We aim to bring you long-term focused analysis driven by fundamental data. Note that our analysis may not factor in the latest price-sensitive company announcements or qualitative material. Simply Wall St has no position in any stocks mentioned.
Companies discussed in this article include ENI.MI.
Have feedback on this article? Concerned about the content? Get in touch with us directly. Alternatively, email editorial-team@simplywallst.com
Hexatronic Group (OM:HTRO) posted a forecasted earnings growth rate of 17.8% per year, outpacing the Swedish market, with expected revenue growth of 4.2% annually. Both figures signal momentum ahead of local peers. Over the past five years, the company has averaged an 18.3% annual earnings increase, though the latest net profit margin of 4.7% is down from last year’s 6.8%, showing some margin pressure has crept in. Even so, with Hexatronic trading at a 13.3x P/E ratio, well below its peer and industry averages and under the SEK33.3 estimated fair value, investors may see the setup as one of strength checked by caution on margins.
See our full analysis for Hexatronic Group.
Now it’s time to pit these headline numbers against the most widely held narratives. Some will match expectations, while others may surprise.
See what the community is saying about Hexatronic Group
OM:HTRO Earnings & Revenue History as at Oct 2025
Hexatronic’s decision to manufacture fiber optic cable in the US directly targets tariff increases and high freight costs, two line items that have notably squeezed margins and profitability in recent quarters.
Bears argue that these external pressures, especially rising freight expenses and persistent tariff impacts, create sustained risks for revenue margins.
The net profit margin sits at 4.7%, down sharply from the prior year’s 6.8%, highlighting that cost inflation has already eaten into profitability.
This contraction directly challenges the company’s ambition to improve regional margins through local production and operational tweaks.
Hexatronic’s Data Center business line reported record 41% sales growth and 37% EBITA growth, outpacing all other operating segments and positioning the business to capitalize on rising cloud demand.
Consensus narrative notes that these robust results, combined with efficiency gains in the Harsh Environment segment, are expected to drive profit margin improvement from 4.7% now to 5.6% in three years.
The uplift is anchored by analysts forecasting total earnings of SEK 459.8 million by 2028, compared to SEK 358.0 million today, signalling belief in the durability of cloud-driven growth.
What is surprising is that while most of Europe remains flat, success in Data Centers and targeted US investments have offset some of the headwinds from lagging regions.
Consensus sees growth in Data Center sales as the lever that could move earnings beyond expectations. 📊 Read the full Hexatronic Group Consensus Narrative.
With a current P/E of 13.3x compared to 36.2x for peers and 23.4x for the broader European electrical industry, Hexatronic trades at a clear discount, while its SEK 22.67 share price sits below both the analyst target (SEK 25.17) and DCF fair value (SEK 33.30).
Consensus narrative contends that this valuation gap could close if profit margins rebound and forecasts play out, but the market remains cautious amid margin compression and cash flow volatility.
Analysts’ consensus assumes minimal change in share count, projecting that future upside is driven by improved profitability, not financial engineering.
The 12.4% gap between current share price and analyst target provides a visible benchmark for upside, yet only if the company delivers on growth and cash flow improvement.
To see how these results tie into long-term growth, risks, and valuation, check out the full range of community narratives for Hexatronic Group on Simply Wall St. Add the company to your watchlist or portfolio so you’ll be alerted when the story evolves.
Got a different take on these results? Share your perspective and shape your own narrative in just a few minutes by using Do it your way.
A great starting point for your Hexatronic Group research is our analysis highlighting 3 key rewards and 2 important warning signs that could impact your investment decision.
Hexatronic’s compressed profit margins and uneven cash flow reveal the challenge of sustaining growth when operational costs and external headwinds increase.
Prefer more consistent financial performance? Use stable growth stocks screener (2099 results) to discover companies with reliable revenue and earnings growth, proven to hold steady when markets take a turn.
This article by Simply Wall St is general in nature. We provide commentary based on historical data and analyst forecasts only using an unbiased methodology and our articles are not intended to be financial advice. It does not constitute a recommendation to buy or sell any stock, and does not take account of your objectives, or your financial situation. We aim to bring you long-term focused analysis driven by fundamental data. Note that our analysis may not factor in the latest price-sensitive company announcements or qualitative material. Simply Wall St has no position in any stocks mentioned.
Companies discussed in this article include HTRO.ST.
Have feedback on this article? Concerned about the content? Get in touch with us directly. Alternatively, email editorial-team@simplywallst.com
Microsoft has confirmed that it is internally testing an ad-supported, free version of Xbox Cloud Gaming, which will allow users to stream select titles without requiring a paid Game Pass subscription. The company has officially confirmed this…
Humanity’s understanding of the solar system has evolved dramatically following the advent of spaceflight. Over the past seven decades, thousands of sophisticated spacecraft have been launched on ambitious missions to look down on our planet,…