Paris, France
—
After a years-long renovation project, the Fondation Cartier art museum will open its doors on Saturday to its new home, opposite the Louvre in Paris.
…

Paris, France
—
After a years-long renovation project, the Fondation Cartier art museum will open its doors on Saturday to its new home, opposite the Louvre in Paris.
…

Sharper rules, stronger compliance: MAS updates AML/CFT Guidelines for insurers
The Monetary Authority of Singapore recently revised its notices and guidelines on anti-money laundering and countering the financing of terrorism (“AML/CFT”), applicable to financial institutions (“FIs”), including direct life insurers,1 direct general insurance business, and foreign insurers operating in Singapore.2 The revisions took effect from 1 July 2025.
The main revisions relevant to insurance businesses (including direct life insurers, direct general insurance business, and foreign insurers) involve mandating proliferation financing (“PF”) assessments as well as clarifying and updating the requirements for filing of suspicious transaction reports (“STRs”).
Additionally, specifically for direct life insurers, the Guidelines to Notice 314 also include amendments to clarify MAS’ supervisory expectations on AML/CFT measures, including on screening and Source of Wealth and Source of Funds establishment.
The purpose of the revisions is to enhance the financial sector’s AML/CFT regime, with reference to global standards set by the Financial Action Task Force (“FATF”).
Notice 314 and both sets of guidelines now expressly refer to PF, when they previously did not. Insurers are now expressly required to carry out PF risk assessments, as part of their AML risk assessments.
In practice, insurers should have already been covering PF risks as part of their existing AML/CFT or sanctions compliance controls.
Offences under MAS’ sanctions regulations for financial institutions against the proliferation of weapons of mass destruction have been designated as predicate offences for money laundering, under the Corruption, Drug Trafficking and Other Serious Crimes (Confiscation of Benefits) Act 1992.
All persons, including insurers, must file a suspicious transaction report (“STR”) with the Suspicious Transaction Reporting Office (“STRO”), when it knows or has reasonable grounds to suspect that any property represents the proceeds of, was used in connection with or is intended to be used in connection with criminal conduct.3
Under the previous AML/CFT notices and guidelines, insurers were expected to file STRs with STRO promptly. MAS’ previous expectation was that companies take not more than 15 business days to evaluate internally whether an STR should be filed, from the time the case was first flagged by an employee/officer.
MAS has now clarified its expectations that:
MAS has not prescribed timelines for the conclusion of internal investigations, to determine whether there is a suspicion that property represents or is used in connection with criminal conduct. In refraining from setting out such precise timelines, MAS acknowledged the wide-ranging nature and complexity of cases, as well as the range of financial institutions’ profiles, scale and complexity of operation.6
As MAS can already access the STRs filed with STRO directly, MAS has removed the requirement for direct life insurers to extend copies of all STRs filed to MAS for information. However, MAS has clarified that direct life insurers will need to do so upon request by MAS.7
MAS emphasised its supervisory expectations that financial institutions, including insurers, should implement robust controls and processes to ensure the:
These supervisory expectations are outlined in MAS’ Consultation Paper8, and they are of general application to all financial institutions and variable capital companies.
In addition, specifically for direct life insurers, the Guidelines to MAS Notice 314 has been amended to require direct life insurers to ensure that there are processes in place to:9
We highlight some of the key amendments.
MAS clarified that where necessary, ML/TF information sources used for screening should include pertinent search engines used in countries or jurisdictions closely associated with the person screened, and screening should be conducted in the native language(s) of the person screened.11
Source of wealth generally refers to the origin of the customer’s and beneficial owner’s entire body of wealth (i.e. total assets). MAS has clarified in the Guidelines to Notice 314 that a customer’s source of wealth includes seed money and gifts.
The source of wealth information obtained by the direct life insurer should give an indication about:
This is to enable the direct life insurer to make an assessment as to whether a customer or beneficial owner present a higher risk for ML/TF.12
Direct life insurers are expected to corroborate the information regarding source of wealth and source of funds. In this regard, direct life insurers should take a risk-based approach and focus on the more material and riskier sources, and exercise prudence in the use of non-independent sources of information such as customer representations, assumptions and benchmarks.13
For direct life insurers, MAS expects that, where there are indications that the risks associated with existing business relations have increased (e.g. anomalies in the control or conduct of an account or discrepancies relating to a customer’s source of wealth), the direct life insurer should promptly implement commensurate risk mitigation measures, including enhanced ongoing monitoring such as:14
The direct life insurer should also request additional information and conduct a review of the customer’s risk profile in order to determine if further measures are necessary.
In relation to processes regarding fraudulent or tampered data, documents or information, MAS expects a direct life insurer to ensure that:15
Examples of indicators of fraudulent or tampered data, documents, or information set out by MAS include:16
The recent amendments to MAS’ AML/CFT Guidelines demonstrate MAS’ continued effort to strengthen Singapore’s AML/CFT regime, to ensure it remains clear and aligned with international standards. Financial institutions should keep an eye on future updates and check that their present policies, processes and controls are in line with MAS’ expectations.
1For direct life insurers, the relevant documents are: (a) MAS’ Notice 314 on the Prevention of Money Laundering and Countering the Financing of Terrorism – Direct Life Insurers, dated 30 June 2025 (“Notice 314”); and (b) MAS’ Guidelines to MAS Notice 314 on Prevention of Money Laundering and Countering the Financing of Terrorism, dated 1 July 2025 (“Guidelines to Notice 314”).
2For other MAS licensed insurers (under s 11 of the Insurance Act 1966), foreign insurers operating in Singapore under a foreign insurer scheme, and direct life insurers writing accident and health policies, the relevant document is the MAS’ Guidelines on Prevention of Money Laundering and Countering the Financing of Terrorism – Direct General Insurance Business, Reinsurance Business and Direct Life Insurance Business (Accident & Health Policies), dated 1 July 2025 (“Guidelines for non-life insurers”).
3S 45(1) of the Corruption, Drug Trafficking and Other Serious Crimes (Confiscation of Benefits) Act 1992.
4For Non-Life Insurers, see Guidelines for non-life insurers at paragraph 7.6. For Life Insurers, see Guidelines on Notice 314, paragraph 12-1.
5For Non-Life Insurers, see Guidelines for non-life insurers at paragraph 7.6. For Life Insurers, see Guidelines on Notice 314, paragraph 6-15-2.
6MAS Consultation Paper on Proposed Amendments to AML/CFT Notices and Guidelines, paragraph 2.13.
7Notice 314, paragraph 12.2.
8MAS Consultation Paper on Proposed Amendments to AML/CFT Notices and Guidelines at paragraph 2.13.
9Guidelines to Notice 314, paragraph 12-A.
10MAS has also amended the Guidelines to Notice 314 to include characteristics of higher-risk shell companies that require enhanced customer due diligence, see Guidelines to Notice 314, paragraph 8-2.
11Guidelines to Notice 314, paragraph 6-15-3.
12Guidelines to Notice 314, paragraph 8-5-6.
13Guidelines to Notice 314, paragraph 8-5-8.
14Guidelines to Notice 314, paragraph 6-10-3.
15Guidelines to Notice 314, paragraph 6-5-5A.
16Guidelines to Notice 314, paragraph 6-5-5A.

The Formula 1 paddock travels to the Autodromo Hermanos Rodriguez this weekend for Round 20 on the 2025 calendar, the Mexico City Grand Prix.
Free Practice 1 and Free Practice 2 will take place on Friday, October 24, followed by Free Practice 3…

To mark F1’s 75th anniversary celebrations, F1.com is counting down the sport’s 25 greatest races with a new feature every week. While you may not agree with the order, we hope you enjoy the stories of these epic races that have helped make this…

Read more news stories here
The semi-final of the 2025 Premio Paganini International Violin Competition was held on 22 October at Teatro Carlo Felice in Genoa. Six contestants presented a programme of chamber music repertoire, plus a solo…

The star cluster Pismis 24 lies within the much larger emission nebula called NGC 6357, located about 8,000 light-years from Earth. The cluster is seen here above a small portion of the nebula. The gas below the stars glows through ionization…

Jupiter is responsible for saving Earth from a fiery death early in the Solar System’s history, and may also explain a longstanding mystery about the formation of meteorites.
A team of scientists have looked at models of Jupiter’s growth in the…
Terms
While we only use edited and approved content for Azthena
answers, it may on occasions provide incorrect responses.
Please confirm any data provided with the related suppliers or
…
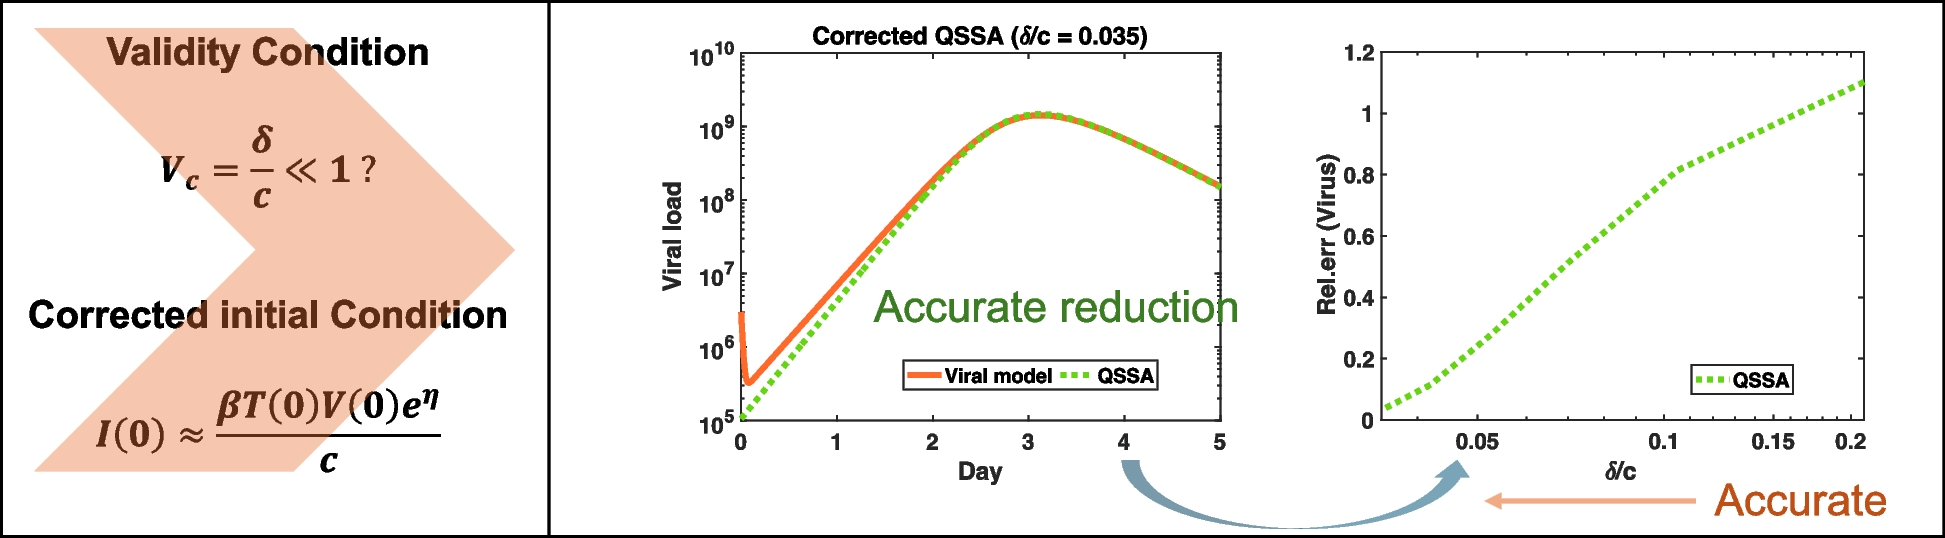
The basic viral model consists of three variables, as defined in Eq. 1. This model is typically simplified into a two-variable system of ordinary differential equations (ODEs) using QSSA. Two QSSA models were considered: ({text{QSSA}}_{text{il}}) (Eq. 2) and our revised QSSA model (Eq. 3, see the “Methods” section). Although the basic viral model includes three state variables and four parameters, applying QSSA reduces the system to two differential equations with three parameters. However, this reduction assumes that the initial conditions of infected cells are not explicitly considered, which can lead to inaccurate results. To address this, a rigorous derivation of the initial conditions of infected cell estimation in the QSSA model and its parameterization are detailed in the Methods section.
For numerical simulations, we adopted initial conditions and parameter values from the study [24]. The initial target cell concentration was set to ({T}_{0}=text{100,000}) (text{cells}/text{ml}). The initial viral concentration was ({V}_{0}=text{10,000 RNA copies/ml}). The initial infected cell concentration was assumed to be (I_{0}=0) (text{cells}/text{ml}). The parameter values were (beta =3.15e-7) ml/((text{RNA copies}cdot text{day})), (delta =2.1/text{day}), (p=text{11,000 RNA copies/(cell}cdot text{day})), and (c=10/text{day}). These parameters were selected because they were derived from a macaque study that provided well-characterized viral dynamic data on Zika infection. This study offers a comprehensive set of parameter estimates, including the viral clearance rate, infected cell death rate, and other key parameters essential for evaluating the validity condition ({C}_{v}) and initial conditions of (I) in the QSSA model. This setup enables a direct comparative analysis between the basic viral model, ({text{QSSA}}_{text{il}}), and our revised QSSA model, demonstrating the significance of correctly estimating the initial condition of infected cell count and ensuring the validity of the QSSA assumption.
To evaluate the validity of QSSA in modeling viral dynamics, we compared the basic viral model with two reduced models: QSSAil and QSSA under the condition of viral clearance rate (c=100), representing strong timescale separation (Fig. 2). Our objective was to assess how well each reduced model approximates the time-course behavior of (T, I), and (V), even under an exaggerated clearance rate (c). While this value may exceed typical biological ranges, it serves as a conceptual example to illustrate how increased timescale separation (cgg delta) improves QSSA model approximation.
Comparison of viral, QSSAil, and QSSA models. a Viral model vs. QSSAil. Time-course comparison of the basic viral model (solid blue) and QSSAil (dashed red) for (c=100). QSSAil exhibits large deviations from the viral model, with relative errors for target cells ((text{Rel}.text{Err}=0.284)), infected cells ((text{Rel}.text{Err}= 0.996)), and viral load ((text{Rel}.text{Err}=1.090)). These discrepancies indicate that the QSSAil fails to accurately approximate the basic viral model. b Viral model vs. properly initialized QSSA model. Comparison of the basic viral model (solid blue) with QSSA model (dashed blue, red and orange) initialized using analytically derived values of ({I}_{0}approx beta {T}_{0}{V}_{0}{e}^{eta }/c). Three values were tested: ({I}_{text{0,1}}=1.16) ((text{Rel}.text{Err}=0.242)), ({I}_{text{0,5}}=1.80) ((text{Rel}.text{Err}=0.087)), and ({I}_{text{0,10}}=3.08) ((text{Rel}.text{Err}=0.118)), corresponding to different choice of (eta). Among them, the QSSA model with ({I}_{text{0,5}}) (dashed red) yields the best approximation
QSSAil exhibited substantial discrepancies from the basic viral model, as shown in Fig. 2a. While the relative error for target cells was moderate (Rel.Err = 0.284), the errors for infected cells (Rel.Err = 0.996) and viral load (Rel.Err = 1.090) were markedly high, highlighting the poor approximation accuracy. These discrepancies stem from the inaccurate representation of infected cell dynamics in QSSAil, leading to the loss of essential viral replication dynamics. As a result, QSSAil fails to serve as a reliable reduced representation of the basic viral model.
In contrast, the QSSA model provided a much more accurate approximation of the basic viral model (Fig. 2b). One critical factor in the performance of the QSSA model is the choice of the initial condition for the infected cell population ((I({t}_{c}))). In our derivation, (Ileft({t}_{c}right)) was approximated under timescale separation assumptions, yielding three possible values used for simulation: (I({t}_{c})=1.16), (I({t}_{c})=1.80), and (I({t}_{c})=3.08). These values were derived from
$$Ileft({t}_{c}right)approx frac{beta {T}_{0}{V}_{0}{e}^{eta }}{c},$$
where (eta) is bounded between (left(beta {V}_{0}{e}^{-1}-cright)/c) and (left(-beta {V}_{0}+beta {V}_{0}{e}^{-1}-delta right)/c) (Methods section). To systematically investigate how (eta) affects the approximation quality on (I({t}_{c})), we discretized (eta) into 10 evenly spaced values and selected three representative points: the first value (left(beta {V}_{0}{e}^{-1}-cright)/c), last value (left(-beta {V}_{0}+beta {V}_{0}{e}^{-1}-delta right)/c), and midpoint ((Ileft({t}_{c}right)=1.80)) between these two extremes. These selections ensured that the selected initial conditions remained consistent with the underlying system dynamics while capturing the range of possible QSSA approximations.
Among these three values, (Ileft({t}_{c}right)=1.80) yields the lowest relative errors across all variables ((text{Rel}.text{Err }= 0.087)), indicating the best alignment with the basic viral model. The other two cases, (Ileft({t}_{c}right)=1.16) and (I({t}_{c})=3.08), resulted in slightly larger relative errors ((text{Rel}.text{Err }= 0.242) and (text{Rel}.text{Err }= 0.118), respectively) but still provided significantly better approximations than QSSAil. This demonstrates that the QSSA model can closely approximate the full model, but its accuracy depends critically on the initial condition of (Ileft({t}_{c}right).)
These findings suggest that with proper initialization, the QSSA model serves a robust and accurate reduction of the basic viral model. Unlike QSSAil, which fails to maintain consistency in infected cell and virus dynamics, the QSSA model preserves the essential features of the viral replication process. These results support using the QSSA model as a reliable reduced-order representation of the viral system, especially when the initial conditions for infected cells are carefully determined.
To generalize these findings, we extended the comparison to a wider range of clearance rates. As shown in Fig. 3, the accuracies of the QSSA and QSSAil models vary significantly with the clearance rate ((c)). In this case, (eta) was fixed as (left(-beta {V}_{0}+beta {V}_{0}{e}^{-1}-delta right)/c). The QSSA model consistently approximated the basic viral model closely, with relative error decreasing as (c) increased. This pattern suggests that the QSSA model captures viral dynamics more accurately under strong timescale separation achieved by a sufficiently high clearance rate.
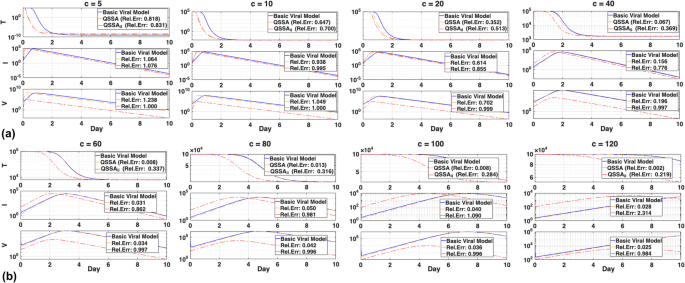
Accuracy of the QSSA and QSSAil models across different values of (c). a Time-course comparison of the basic viral model (solid blue), the corrected initialized QSSA model (dashed orange), and QSSAil (dashed red) for varying values of (c) (5 to 40). As (c) increases, reflecting stronger timescale separation, the relative error (Rel.Err) of the QSSA model systematically decreases, indicating improved accuracy in approximating the basic viral model. Notably, when (c=40), the QSSA model achieves a relative error below 0.2. In contrast, the QSSAil model consistently exhibits larger deviations, regardless of (c). b Comparison for higher value of (c) (60 to 120). This QSSA model maintains its accuracy, achieving substantially lower errors than the QSSAil model, confirming the validity and robustness of the QSSA model under conditions of sufficient timescale separation
The viral clearance rate ((c)) for influenza has been reported within a wide range for estimation, with lower and upper bounds of 1/day (({t}_{1/2})=16.7 h) and 103/day (({t}_{1/2})=1 min), respectively [25]. Similarly, the reported clearance rates for Zika virus range from 2 to 25/day [26]. To assess the effect of timescale separation, we explored a broader range of (c) values beyond those reported in previous studies. This was primarily because when (c) is relatively small, the validity condition is not well satisfied given a fixed (delta)=2.1. In such cases, the ratio ({C}_{v}=delta /c) is not sufficiently small, resulting in a poor approximation of the basic viral dynamics by the QSSA model. For moderate clearance rates (e.g., (c=10)), QSSAil yielded results similar to the QSSA model; however, its predictions became increasingly inaccurate as (c) increased, especially for target cells, infected cells, and viral load. These discrepancies become especially pronounced for (cge 20), where improper linearization in the derivation of QSSAil leads to systematic inaccuracies. Relative error analysis (Fig. 3b) supports this, showing that the QSSA model remains accurate across a wider range of (c) values and consistently outperforms QSSAil as timescale separation increases.
Building on the accuracy comparison, we next assessed whether the QSSA model exhibits comparable robustness to the basic viral model under parameter perturbations. Figure 4 presents a local sensitivity analysis comparing how the basic viral and QSSA models respond to parameter perturbations. Although both models exhibited similar qualitative patterns, notable differences appeared in the magnitudes of their sensitivity responses. As shown in Fig. 4a, the target cells ((T)) varied more in the QSSA model than in the basic viral model. By contrast, Fig. 4b shows that both models shared similar sensitivity patterns across parameters. However, Fig. 4c shows that the infected cells and viral load had lower mean sensitivity in the QSSA model. To test if the observed sensitivity patterns depended on the perturbation level, we repeated the analysis with 10% and 30% changes (Additional file 1: Fig. S1 a–b). Both models maintained similar sensitivity profiles across all perturbation levels, confirming the robustness of conclusions from Fig. 4a–c.
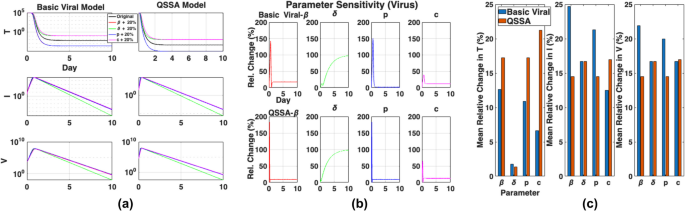
Local sensitivity analysis of the basic viral and QSSA models. a Time-course analysis of target cells ((T)), infected cells ((I)), and viral load ((V)) under parameter perturbations in the basic viral model (left) and QSSA model (right). Each subplot shows the dynamics (solid black) alongside those resulting from a 20% increase in parameters: (p) (blue), (beta) (red), (delta) (green), or (c) (purple). The QSSA model maintains similar pattern of the basic viral model, though a slight deviation is observed in (T). b Relative changes in (V) over time after following perturbations to (p), (beta), (delta), and (c). Both the basic viral model (top) and QSSA model (bottom) show comparable responses, indicating similar dynamic sensitivity to parameter values. c Mean relative changes in (T, I,) and (V) for each parameter perturbations. The QSSA model captures the similar sensitivity patterns of the basic viral model
These results indicate that the QSSA model does not always show reduced sensitivity across all state variables. However, its low sensitivity to viral load suggests it offers a stable representation of viral replication, especially when only viral load is observed. This highlights the importance of evaluating sensitivity when applying QSSA reductions, especially when models are used for parameter estimation.
To evaluate the validity of the QSSA model across different levels of timescale separation, we analyzed the relative error between the QSSA and viral models for varying combinations of the infected cell death rate ((delta)) and viral clearance rate ((c)), focusing on the role of the validity condition ({C}_{v}=delta /c) (Fig. 5).
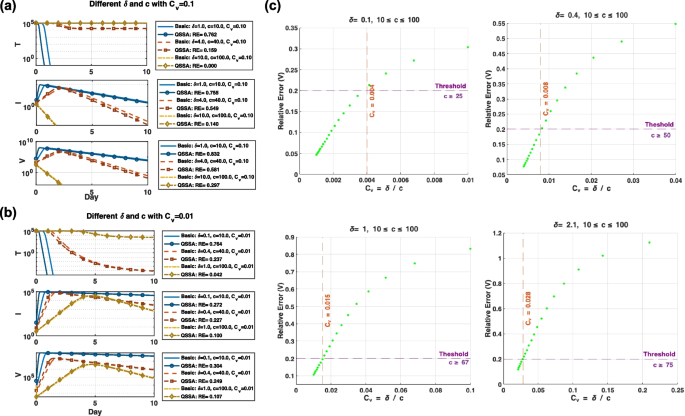
Evaluation of QSSA approximation accuracy based on the validity condition ({C}_{v}=delta /c). a Simulation results comparing the basic viral and QSSA models for two ((delta , c)) pairs that yield the same ({C}_{v}=0.1). While both cases maintain the same validity ratio, the QSSA model shows non-negligible deviations from the full model, indicating insufficient timescale separation. b Same comparison as in a, but with a stronger validity condition ({C}_{v}=0.01). The QSSA model closely approximates the full model across all compartments, with smaller relative errors. Notably, Fig. 5a reveals that identical ({C}_{v}) values do not guarantee identical approximation accuracy, suggesting that the absolute values of (delta) and (c) also play a role. However, as ({C}_{v}) becomes sufficiently small (b), the QSSA model consistently achieves low relative errors, supporting its use under stronger timescale separation. c Relationship between ({C}_{v}) and the relative error in viral load for four fixed (delta) (0.1, 0.4, 1, 2.1), with (c) varied from 10 to 100. A threshold of acceptable error (RE = 0.2, dashed purple line) is used to determine the minimum (c) value (red) needed for accurate QSSA performance. The analysis shows that smaller (delta) requires a less stringent (c) to achieve sufficient separation
In Fig. 5a, we examined three (δ, c) pairs with the same validity condition ({C}_{v}=0.1): ((delta), (c)=(1, 10), (4, 40), (10, 100)). Although the validity condition remains fixed, the QSSA model yields different levels of approximation accuracy depending on the absolute values of (delta) and (c). For example, (delta =10) and (c=100) produces the lowest relative error across all compartments, indicating that accuracy may still vary even when ({C}_{v}) is fixed.
To assess the impact of stronger timescale separation, we repeated the analysis using a smaller validity condition ({C}_{v}=0.01) (Fig. 5b). As expected, the QSSA model’s accuracy improves substantially under this condition, with relative errors consistently reduced across all compartments. These results confirm that smaller ({C}_{v}), indicating more pronounced timescale separation between infected cell dynamics and viral clearance, enhances the validity of the QSSA approximation.
To further quantify the relationship between ({C}_{v}) and model accuracy, we systematically varied (c) from 10 to 100 while fixing (delta) at four values (0.1, 0.4, 1, and 2.1), and plotted the relative error of viral load (V) against the corresponding ({C}_{v}) (Fig. 5c). For each (delta), we defined a QSSA-valid regime as the region where the relative error of (V) falls below a threshold of 0.2 (horizontal dashed line). The vertical dashed lines mark the corresponding threshold ({C}_{v}) values and indicate the minimum required (c) values to satisfy the condition. As (delta) increases, the threshold ({C}_{v}) values also increase, suggesting that greater viral clearance is needed to maintain sufficient timescale separation. This analysis reveals a correlation between ({C}_{v}) and relative error, providing practical guidance on when the QSSA model can be reliably applied.
To assess model performance under different timescale separations, we performed in silico simulations using the basic viral model to generate viral load data with 5% noise. The infection rate (beta) was fixed, and the remaining parameters ((delta , p)) were estimated using both the basic and QSSA models. The validity condition ({C}_{v}=delta /c) was used to modulate the degree of timescale separation.
As shown in Fig. 6a, b, when ({C}_{v}) was large, the QSSA model failed to fit the data, whereas the viral model performed well. When ({C}_{v}) was small, both models achieved accurate data fits, even under partial observability (six time points, viral load only) shown in Additional file 1: Fig. S2. This highlights that QSSA-based reductions require strong timescale separation for validity. However, parameter estimation results reveal deeper differences. Despite good data fits, the viral model failed to recover the true parameter values when ({C}_{v}) was small (Fig. 6c), leading to high relative errors. In contrast, the QSSA model produced more accurate estimates across all ({C}_{v}), particularly when timescale separation was strong.
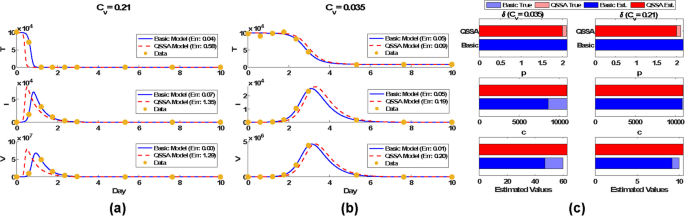
Parameter estimation and model fitting under different validity conditions. a Dynamics comparison for large ({C}_{v}=0.21). The QSSA model exhibits significant deviations from the basic viral model, particularly for infected cells ((text{Err}=1.35)) and viral load ((text{Err}=1.29)), indicating poor approximation accuracy under weak timescale separation. b Dynamics comparison for small ({C}_{v}=0.035). Both models closely align with the data, with small relative errors in target cells ((text{Err}=0.09)), infected cells ((text{Err}=0.19)), and viral load ((text{Err}=0.20)). c Parameter identifiability. Although the basic viral model provides a better data fit, it tends to underestimate parameters, particularly in (p) and (c), when ({C}_{v}) is small (0.035). In contrast, the QSSA model maintains consistent parameter estimates across different validity conditions, suggesting improved robustness in inference
These observations were further supported by detailed analysis in Additional file 1: Fig. S2. In this scenario, we estimated three parameters (beta , delta) and (p). For two representative clearance rates ((c=10) and (c=60)), we randomly sampled six time points to simulate partial data availability. In the weak time separation (({C}_{v}=0.21)), the QSSA model produced a poor fit (Rel.Err ≈ 0.67), while the viral model fit the data well (Rel.Err ≈ 0.01). Under stronger time separation (({C}_{v}=0.035)), both models accurately fit the data, but QSSA yielded more accurate parameter estimates. Trace plots (Additional file 1: Fig. S2 e) revealed accurate convergence of QSSA estimates for (delta). In addition, 2D profile-likelihood contours (Additional file 1: Fig. S2 f) demonstrated better parameter identifiability in the QSSA model. Notably, the viral model failed to identify the (beta -p) pair, whereas QSSA produced compact confidence regions for all parameter pairs.
Taken together, these findings suggest that the viral model is more robust for data fitting, but its parameter estimates may be biased when timescale separation is weak. In contrast, the QSSA model offers superior identifiability and reliability when the separation is strong, making it the preferable approach in such regimes.