Blog

  • New Holland Showcases Smart Farming Innovations at FIRA USA 2025

    New Holland Showcases Smart Farming Innovations at FIRA USA 2025

    • New Holland is returning to FIRA USA with a focus on automation specifically for vineyards and specialty crops
    • The New Holland booth will be at #53
    • FIRA is the leading event for ag robotics and farming automation, with two editions per year: World FIRA in France, and FIRA USA in the United States.

    New Holland, Pa., October 2025

    From October 21–23, 2025, New Holland, a global leader in agricultural machinery and solutions, returns to FIRA USA, the leading event for agricultural robotics and automation. Its attendance reaffirms the brand’s commitment to sustainable farming through cutting-edge technologies and real-world solutions.

    With a focus on automation, precision agriculture and regenerative practices, New Holland’s emphasis is on providing farmers with equipment and technology that boost productivity, efficiency and environmental responsibility. Taking place in Woodland, California, FIRA is the ideal event at which to showcase this, bringing together farmers, industrial leaders, startups, scientists and investors to shape the future of agriculture.

    Technology Highlights

    A highlight of the New Holland display at FIRA USA 2025 will be a T4.120F specialty tractor paired with a precision fan sprayer, outfitted with a Raven Air Blast Sprayer Kit. Designed specifically for vineyards and specialty crop fields, this is available to customers today and brings precision spraying to a segment traditionally underserved in this area.

    This advanced system is designed to eliminate application overlaps and skips through coverage sharing, increasing daily coverage by up to 20% and reducing crop protection input use by up to 10%. The result is more sustainable and environmentally conscious applications, delivering cost savings for growers and reducing waste.

    XPower XPR Concept: Electric Weeding for Row Crops

    At FIRA USA, New Holland is also displaying the XPower XPR concept, developed in collaboration with Zasso. This innovative system offers a chemical-free approach to weed control by using high-voltage electricity to eliminate weeds right down to the root. This sustainable alternative to traditional herbicides not only prevents regrowth but also helps reduce erosion and preserve soil health, a key illustration of how New Holland is supporting regenerative agriculture with practical, forward-thinking solutions.

    Interactive Demonstrations: Technology That Works for Farmers

    Visitors can explore New Holland’s full suite of precision technologies through hands-on experiences at the demo trailer, featuring a tabletop rate control display for intuitive understanding of precision spraying and one-on-one expert demos showcasing real-world applications.

    New Holland invites all FIRA attendees to visit booth #53 to talk with its team of experts and learn more about the brand’s innovative solutions to farmers’ challenges. For more information about New Holland’s participation, see https://fira-usa.com/.

    Continue Reading

  • Generalizability of neuromuscular coordination in the human upper extremity after stroke and its implications in neurorehabilitation | Journal of NeuroEngineering and Rehabilitation

    Generalizability of neuromuscular coordination in the human upper extremity after stroke and its implications in neurorehabilitation | Journal of NeuroEngineering and Rehabilitation

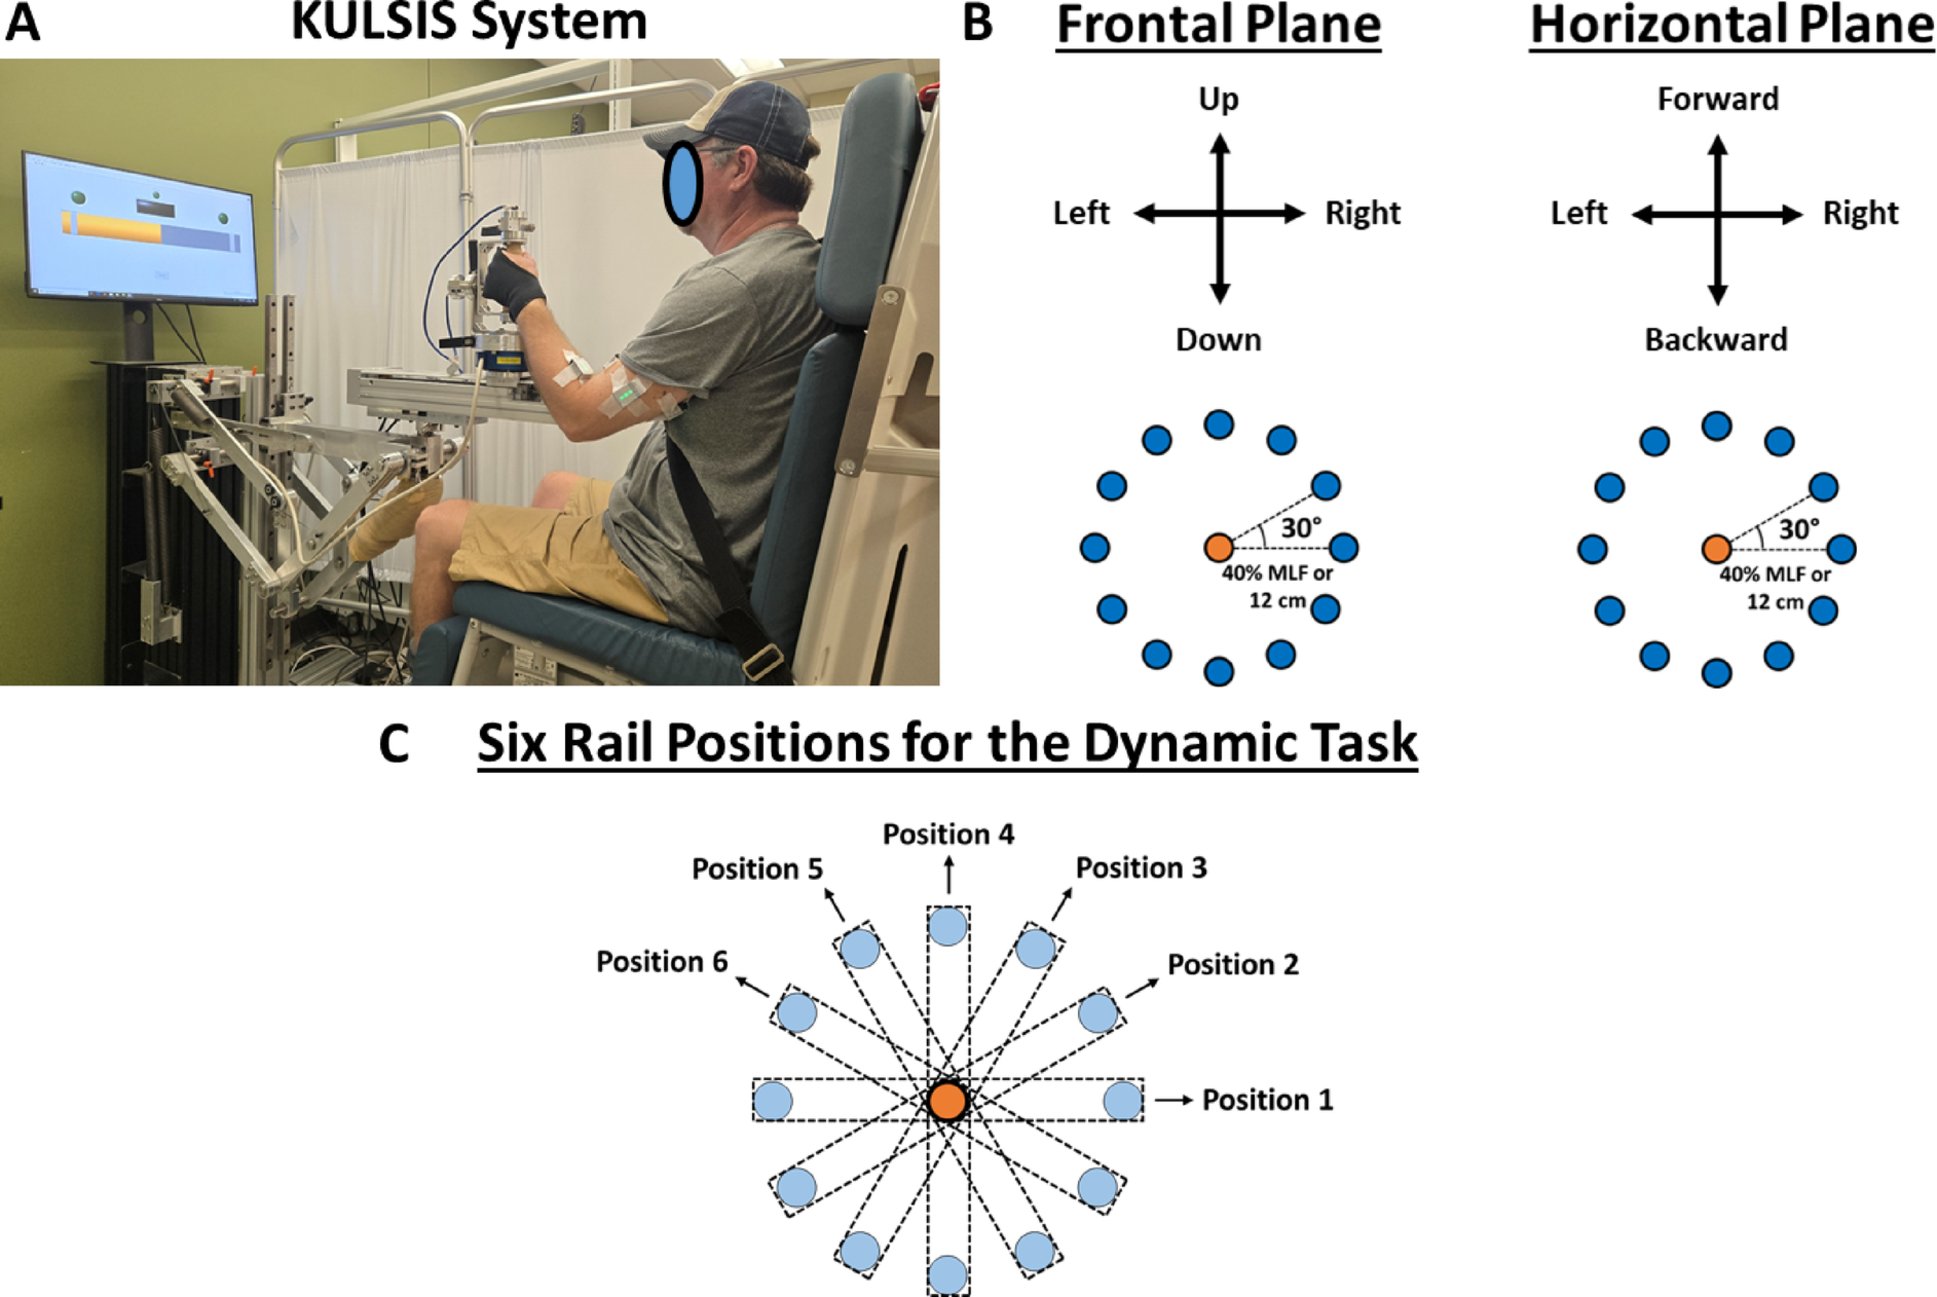
    The primary aim of this study was to investigate the generalizability of muscle synergy characteristics between isometric force generation and dynamic reaching tasks after stroke. In the isometric task, the force load for the target-matching task was set at 40% of each participant’s MLF. MLF was significantly higher in healthy participants [40.13 ± 14.14 N (mean ± SD)] compared with stroke survivors (24.07 ± 12.03 N; p < 0.01). The mean isometric target-matching time for each participant, including the ramp and the one-second holding phases, was longer for stroke survivors (6.14 ± 1.91 s) than for healthy individuals (4.63 ± 0.93 s), although this difference was not statistically significant (p = 0.052). In the dynamic reaching task, the average of each participant’s time from the target-onset to the initial timing of a target match was significantly lower for healthy individuals (1.71 ± 0.16 s) compared with stroke survivors (2.02 ± 0.09 s; p < 0.01). For both tasks, healthy participants matched all the targets, while stroke survivors matched, on average, 85.81% and 96.6% of the targets for the isometric and dynamic reaching, respectively, mainly because of the difficulty in holding the target match for one second in the isometric task. The average experiment duration was 2.5 h and 3.5 h for healthy volunteers and stroke survivors, respectively.

    EMG patterns of two-dimensional isometric force generation and dynamic reaching

    The EMG signals recorded in neurologically intact volunteers and stroke survivors showed distinct muscle activity underlying isometric force generation and dynamic reaching. For instance, Fig. 2 shows the EMG patterns from two participants (a healthy, representative volunteer and a moderately impaired stroke survivor) performed during static and dynamic tasks in a medial direction target in the horizontal plane. The healthy volunteer mainly recruited AD, MD, and PEC during the isometric force generation trial (Fig. 2A), while BRD, BB, AD, and PEC were activated during the dynamic reaching (Fig. 2B). In contrast, the moderately impaired stroke participant mainly recruited BB and PEC during the static trial, while mainly PEC, with some activation of AD and BB, was recruited for the dynamic trial. Over time, the EMG signal magnitudes varied between the two tasks for both participants. Moreover, alterations in the EMG patterns were typically observed in stroke survivors, varying by individuals and depending on the level of motor impairment.

    Fig. 2

    EMG, force, and speed data were collected from one representative healthy participant (left) and one post-stroke volunteer (right) for both isometric force production and dynamic reaching tasks. EMG signals were collected during center-out, point-to-point reaching under static or dynamic conditions to the nine-o’clock direction. The signals were normalized for each muscle against the maximum contraction observed across all trials within each motor task to highlight muscle activation patterns throughout the trial. This normalization by maximum contraction was performed for visualization purposes only for this Figure, and it was not used for muscle synergy identification. A, three-dimensional endpoint forces (Fx, lateral-medial; Fy, forward-backward; Fz, upward-downward) and EMG signals were recorded during the isometric force target-matching task. The one-second holding period data, demarcated by the two blue lines, were used for synergy analysis. B, Hand speed and EMG activity during a center-out reaching movement. EMG data from the movement onset to offset based on the 10% of max speed (indicated by the blue lines) were included for synergy identification. The muscles recorded were brachioradialis (BRD), biceps brachii (BB), triceps brachii (long and lateral heads) (TrLo and TrLa, respectively), deltoids (anterior, middle, and posterior fibers; AD, MD, and PD, respectively), and pectoralis major clavicular head (PEC)

    Optimal number of muscle synergies in isometric force generation and dynamic reaching tasks

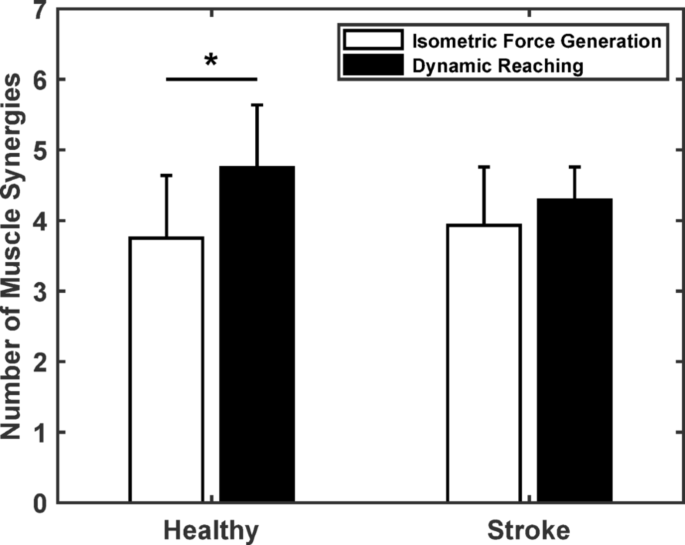
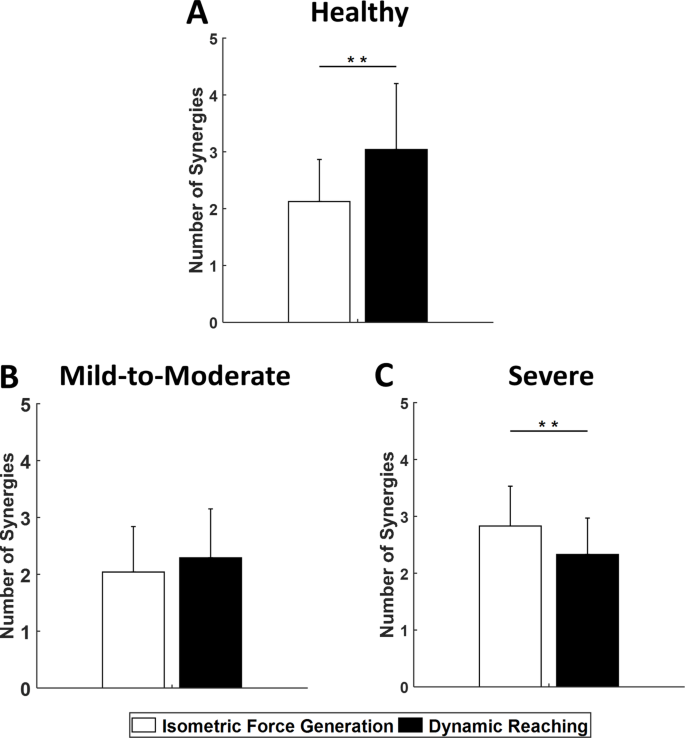
    The number of muscle synergies required to explain EMG variance differed between tasks in healthy individuals but remained consistent in stroke survivors. Figure 3 shows the average number of muscle synergies for both groups across the two tasks. Based on the criteria described in the previous section (see Method section, Muscle Synergy Identification), on average, four synergies (3.75 ± 0.89; mean ± SD) were required to account for the variance of the EMG underling the isometric force generation in the healthy individuals (n = 8), while five synergies (4.75 ± 0.83) were required for the dynamic reaching task in the same group. Similarly, for the stroke survivors (n = 14), four synergies were typically required for both tasks, isometric force generation (3.93 ± 0.83) and dynamic reaching (4.29 ± 0.47). A significant difference was found in the optimal number of muscle synergies in the healthy group between tasks (paired t-test, p < 0.05), but not in the stroke population. Finally, no significant relationship or trend was observed between the number of synergies and the level of motor impairment after stroke in either task.

    Fig. 3
    figure 3

    The optimal number of muscle synergies (mean ± SD) during isometric force generation (white) and dynamic reaching (black) tasks for the healthy individuals (n = 8) and stroke survivors (n = 14). The criteria for the optimal number of muscle synergies per participant included 90% of the global variance accounted for (gVAF) and a 5% difference of gVAF by adding one more synergy (diffVAF; see Method section, Muscle Synergy Identification). There was a significant difference between the isometric force generation and dynamic reaching tasks in the healthy group exclusively (paired t-test; *, p < 0.05)

    Muscle synergy patterns

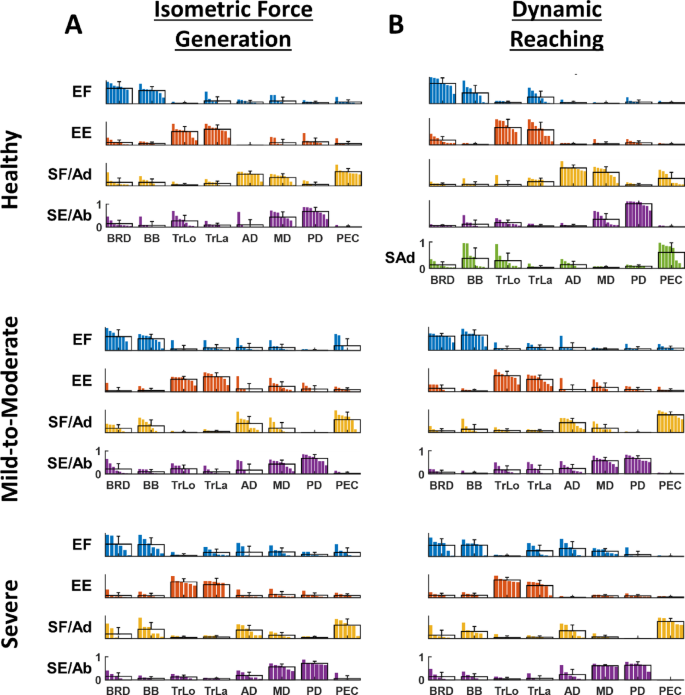
    Muscle synergy patterns were consistent across both isometric force generation (Fig. 4A) and dynamic reaching (Fig. 4B) tasks within each subgroup, including healthy individuals, and the stroke subgroups with mild-to-moderate, and severe motor impairment. As a validation, a post hoc analysis was applied to a subset of the data collected (eight stroke survivors and four healthy individuals) to compare muscle synergy composition identified from the holding period only and from the ramp phase plus holding period. Consistent with our previous study in stroke [28], synergy patterns were similar between different phases during the isometric force generation task. The synergy patterns were named following the appropriate mechanical action of the muscles mainly activated within each synergy. The muscle synergies of the healthy participants activated during both isometric force generation and dynamic reaching tasks were as follows: elbow flexor (EF), elbow extensor (EE), shoulder flexor/adductor (SF/Ad), and shoulder extensor/abductor (SE/Ab). The fifth synergy of dynamic reaching was named shoulder adductor (SAd) because of its functional activation during the task performance. The EF synergy included the activation of the elbow flexor muscles (BRD and BB). The EE synergy consisted of the activation of the elbow extensor muscles (TrLo and TrLa). The SF/Ad consisted of the activation of AD, MD, and PEC. The SE/Ab synergy contained the activation of MD and PD. The SAd synergy contained the activation of PEC with some activation of BB.

    Similarly, the muscle synergies from the two stroke subgroups (mild-to-moderate and severe) included: EF, EE, SF/Ad, and SE/Ab. However, systematic alterations were observed in stroke participants, especially in severely impaired subgroups. The EF synergies mainly consisted of BRD and BB, with some co-activation of TrLa, AD, and MD for the two tasks. In addition, SF/Ad synergies mainly consisted of PEC with an abnormal reduction of AD and MD, and an atypical co-activation with BB for the severely impaired subgroup.

    Fig. 4
    figure 4

    Muscle synergy patterns (EF, elbow flexor; EE, elbow extensor; SF/Ad, shoulder flexor/adductor; SE/Ab, shoulder extensor/abductor; and SAd, shoulder adductor) per subgroup (n = 8, healthy; n = 8, mild-to-moderate; n = 6, severe) during isometric force generation (A) and dynamic reaching (B). SAd synergy was identified exclusively in the healthy group during the dynamic condition. The muscle synergy composition was consistent with some small variations within each of the three subgroups. Nevertheless, group differences were observed, especially in EF and SF/Ad for the severely impaired stroke subgroups compared with healthy individuals

    Within-subject similarity of muscle synergy composition between isometric force generation and dynamic reaching tasks

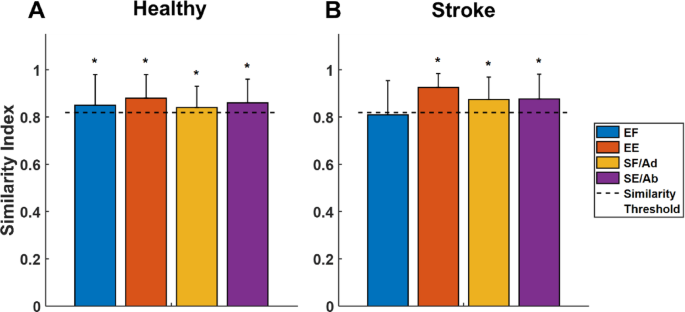
    The majority of the synergies were statistically similar (threshold [r] = 0.819; p < 0.05) between isometric force generation and dynamic reaching within each individual of each subgroup (Fig. 5). In healthy individuals, all four muscle synergies were significantly similar between the two tasks. For instance, in the EF and EE synergies, the similarity indices [mean ± SD] were 0.85 ± 0.13 and 0.88 ± 0.10, respectively. Also, the similarity indices of the SF/Ad and SE/Ab synergies were 0.84 ± 0.09 and 0.86 ± 0.10, respectively. In addition, in the stroke group, three out of the four identified synergies were similar, including EE, SF/Ad, and SE/Ab synergies. The elbow flexor synergy was not statistically similar between the two tasks, mainly because of the greater variability in the muscle weights of the elbow flexor muscles (BRD and BB) with an elbow extensor (TrLa) and a shoulder adductor (AD) within the same participant across both tasks, particularly observed in severely impaired stroke survivors.

    Fig. 5
    figure 5

    Muscle synergy composition similarity between isometric force generation and dynamic reaching. A, four pairs of synergies (EF, elbow flexor; EE, elbow extensor; SF/Ad, shoulder flexor/adductor; SE/Ab, shoulder extensor/abductor) underlying the two tasks were similar (*, p < 0.05) within each participant in the healthy group. B, three out of the four pairs of synergies (EE, SF/Ad, and SE/Ab) were similar between the static and dynamic tasks for the stroke group. The dotted line indicates the statistical similarity threshold

    Altered, stroke-induced synergies explained as merging of synergies of healthy individuals

    Altered, stroke-induced muscle synergies observed during both isometric force generation and dynamic reaching were explained as a linear combination of muscle synergies underlying dynamic reaches of healthy participants. The mean of muscle synergies underlying dynamic reaching in the healthy group formed the norm (model) synergies. The scalar products of the best-matched synergy pairs between the norm synergies and each stroke participant’s synergies underlying each motor task were calculated. Regarding the static task, 41 out of the 56 synergies (14 stroke survivors × 4 synergies per participant) of all the stroke participants were identified as preserved (i.e., the scalar product greater than the threshold (0.819); see Methods section, Calculating Muscle Synergy Similarities). Similarly, 42 out of the 56 synergies of the 14 stroke survivors were also identified as preserved during dynamic reaching. Moreover, by merging two norm (model) synergies observed from healthy individuals during the dynamic task, nine out of 13 altered, stroke-induced synergies in the isometric task, and 12 out of 14 altered synergies in the dynamic task were successfully reconstructed (i.e., the scalar products between the altered synergies and merged synergies were greater than the threshold). This finding indicates that merging or co-activation of synergies recruited during dynamic reaching in healthy conditions can largely account for abnormal synergy patterns observed after stroke across both static and dynamic motor tasks. In contrast, merging the model synergies underlying the isometric conditions could not reconstruct the same altered, stroke-induced synergies as much as merging the model synergies underlying the dynamic conditions (i.e., only less than half of the altered synergies were explained). This observation highlights that merging synergies underlying dynamic reaches of healthy individuals provides a better explanation of altered, stroke-induced muscle synergies than merging synergies underlying static tasks.

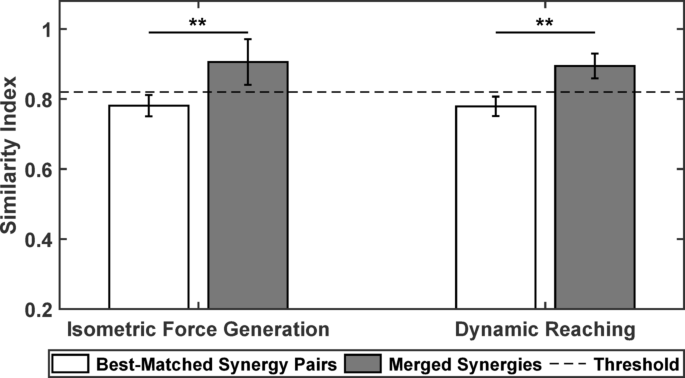
    Finally, we assessed the impact of the merging on the similarity index and found that it consistently increased beyond the synergy similarity threshold (0.819), with values typically approaching 0.9. This increase in similarity was significant within each task, showing that merging dynamic synergies of healthy individuals closely resembled the altered muscle synergy patterns during both tasks (Fig. 6). Altered, stroke-induced synergies that could not be explained by merging as a linear combination of model synergies were not included in this analysis.

    Fig. 6
    figure 6

    The altered, stroke-induced synergies were explained by merging the model muscle synergies underlying the dynamic reaching from the healthy individuals. The two white bars represent the similarity index (mean ± SD) of the scalar product of the best-matched synergy pairs between each altered, stroke-induced synergy and the norm synergies (i.e., the averaged synergies within the healthy group) underlying dynamic reaching. The two gray bars show the similarity between altered, stroke-induced synergies and the merging of two norm synergies during the dynamic task, which are higher than the first two, respectively (**, p < 0.01). The dashed line shows the statistical threshold of the similarity index. Altered synergies that were explained by merging model synergies of healthy individuals were included exclusively (n = 9, isometric force generation; and n = 12, dynamic reaching)

    Differences in muscle synergy recruitment during isometric force generation and dynamic reaching

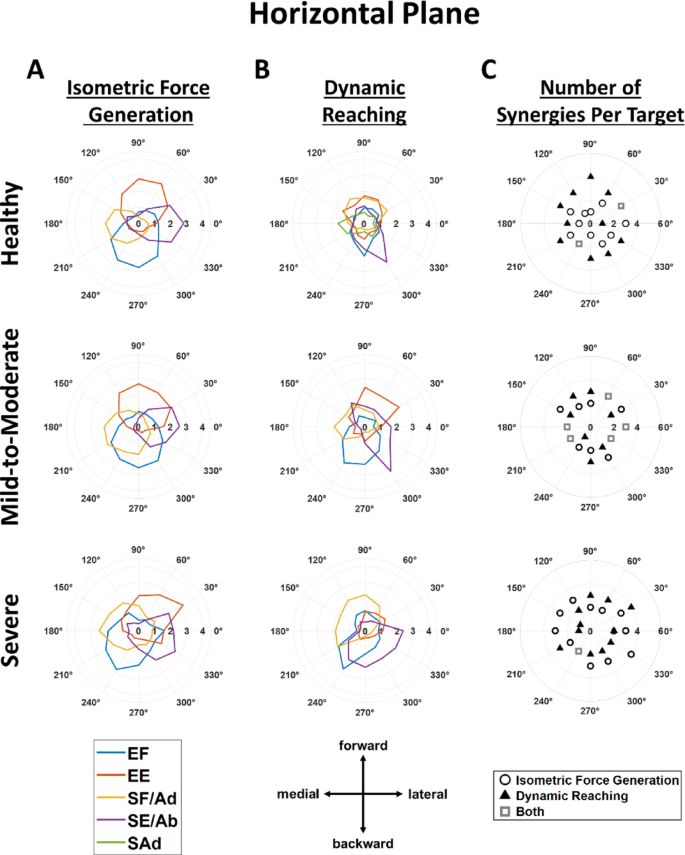
    The static and dynamic tasks tended to adopt different muscle synergy recruitment strategies. These patterns were based on the averaged activation profiles within each subgroup, including healthy individuals, and mild-to-moderate and severe stroke subgroups. For visualization purposes, the 24 target directions were divided into two sets: one representing the 12 target directions from the horizontal plane (Fig. 7) and the other representing the 12 target directions from the frontal plane (Fig. 8). In the horizontal plane, synergy activation profiles appeared more directionally tuned during isometric force generation than during dynamic reaching across all subgroups, except for the severely impaired stroke subgroup (Fig. 7A vs. 7B). Furthermore, task-specific variations in synergy recruitment between isometric and dynamic motor control were reflected in terms of the number of synergies used per target direction. Healthy participants generally recruited one more muscle synergy per target direction in dynamic reaching than in isometric force generation in the horizontal plane; however, severely impaired stroke survivors generally recruited one more muscle synergy per target direction in isometric force generation than in dynamic reaching (Fig. 7C). No difference between the two tasks was observed in the stroke subgroup with mild-to-moderate motor impairment in the number of recruited synergies per target in the horizontal plane. For healthy individuals, the activation thresholds of isometric force generation (t_iso) and dynamic reaching (t_dyn) thresholds were t_iso_healthy = 1 and t_dyn_healthy = 0.88 in the healthy group, whereas for the stroke groups, they were t_iso_stroke = 0.88 and t_dyn_stroke = 0.85.

    Fig. 7
    figure 7

    The averaged tuning curves of muscle synergy activation and the number of significantly activated synergies per target direction during isometric force generation (A) and dynamic reaching (B) in the horizontal plane per subgroup. The muscle synergy activation tuning curves were more tuned during isometric force generation than during dynamic reaching for all subgroups, except the severely impaired stroke subgroup. Each of the five colors is mapped to each of the five synergy-activation profiles. C, the number of muscle synergies significantly activated across the 12 target directions in the isometric force generation (circle) and dynamic reaching (triangle) based on the mean muscle synergy activation per subgroup. The squares refer to the case in which the number of significantly activated synergies is the same for both tasks in a specific target direction. The magnitude of the mean synergy activation greater than the threshold (see Method section, Number of synergies required per target direction) was considered significant. For the healthy group, the number of synergies significantly activated per target direction was typically lower in the isometric force generation than in the dynamic reaching. In contrast, for the severely impaired stroke subgroup, the number of synergies was typically higher in the isometric task than in the dynamic task. For the stroke subgroup with mild-to-moderate impairment, no clear difference between conditions was observed. EF, elbow flexor; EE, elbow extensor; SF/Ad, shoulder flexor/adductor; SE/Ab, shoulder extensor/abductor; and SAd, shoulder adductor

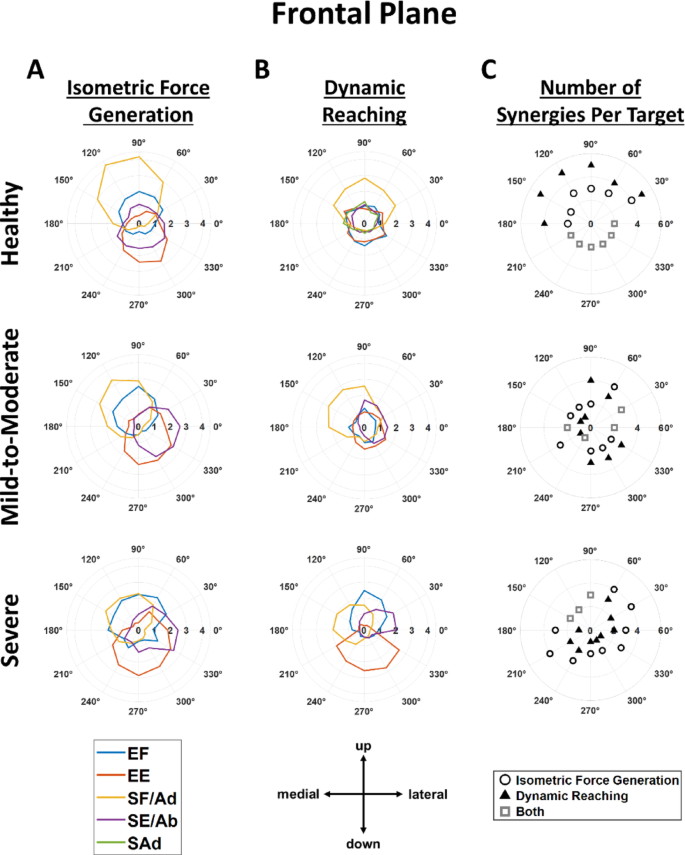
    Similarly, Fig. 8 shows that the averaged activation profile of each muscle synergy was more tuned in the isometric force generation task (Fig. 8A) than in the dynamic reaching (Fig. 8B) in the frontal plane for healthy individuals, and stroke participants with mild-to-moderate impairment, but not for severely impaired stroke survivors. Meanwhile, during the dynamic reaching, several muscle synergies were activated per target direction for all subgroups, except for the severely impaired subgroup, suggesting that multiple synergies need to be activated to perform the desired point-to-point dynamic reaching in the healthy group as well as in the stroke subgroup with mild-to-moderate motor impairment. In addition, differences were observed in the number of muscle synergies significantly activated across the 12 target directions in the frontal plane. Healthy participants tended to recruit one more muscle synergy per target direction during the dynamic reaching than during the static task. Interestingly, severely impaired stroke survivors generally recruited one more muscle synergy per target direction during isometric force generation than during dynamic reaching (Fig. 8C). Consistent with the horizontal plane, no difference in the number of recruited synergies per target in the frontal plane was observed between the two tasks in the mild-to-moderate stroke subgroup.

    Fig. 8
    figure 8

    The averaged tuning curves of muscle synergy activation profiles and the number of significantly activated synergies per target direction during static (A) and dynamic (B) tasks in the frontal plane, across subgroups. In general, synergy activation tuning curves were more tuned during static than during dynamic reaching for healthy individuals, and the stroke subgroup with mild-to-moderate impairment, but not for the severely impaired stroke subgroup. Each of the five colors from the activation tuning curve is mapped to each of the five muscle synergy activation profiles. C, the number of significantly activated muscle synergies across the 12 target directions for both tasks (circles indicate isometric force generation, triangles indicate dynamic reaching, and squares represent target directions where participants activated the same number of synergies in both tasks). Synergy activation was considered significant if its average magnitude exceeded a defined threshold (see Method section, Number of synergies required per target direction). For healthy individuals, fewer synergies per target direction were typically activated during isometric force generation than during dynamic reaching. Conversely, for stroke survivors with severe motor impairment, the number of synergies was typically higher in the isometric task than in the point-to-point reaching task. No consistent difference in the number of activated synergies was observed between the two tasks in the mild-to-moderate stroke subgroup. EF, elbow flexor; EE, elbow extensor; SF/Ad, shoulder flexor/adductor; SE/Ab, shoulder extensor/abductor; and SAd, shoulder adductor

    Even though variability was observed across subgroups, the averaged synergy activation profiles as a function of the target force direction across both planes were generally aligned with the expected mechanical action of the muscles predominantly activated within each respective muscle synergy pattern. For instance, in the horizontal plane (Fig. 7A) during the isometric task across subgroups, the EF and EE synergies were mostly activated in the backward-medial and forward-lateral directions, respectively, whereas the SF/Ad and SE/Ab synergies were more active in the medial and lateral directions, respectively. Similarly, in the dynamic reaching, the activation of EF, EE, and SF/Ad in the healthy subgroup retained similar directional preferences, whereas the preferred activation of SE/Ab shifted toward a backward-lateral direction in the horizontal plane (Fig. 7B).

    The number of average muscle synergies significantly activated per target direction, with both planes combined, varied between isometric force generation and dynamic tasks in healthy individuals and severely impaired stroke survivors. Figure 9 shows the number of synergies activated and averaged across the 24 targets (12 horizontal and 12 frontal) for the three subgroups. The Wilcoxon signed-rank test between corresponding subgroups across the two tasks showed a significant difference in the number of synergies activated across the 24 target directions in the healthy individuals, suggesting that the reaching task was more complex. Interestingly, for the severe stroke subgroup, a significant difference was also found, with the isometric task typically requiring one more synergy significantly activated per target direction than the dynamic task, suggesting abnormal muscle synergy recruitment strategies in the neuromuscular coordination of motor tasks in severely impaired stroke survivors. Finally, a post-hoc power analysis was conducted to assess the reliability of these within-subgroup comparisons between the two tasks, indicating a statistical power exceeding the standard 80% threshold.

    Fig. 9
    figure 9

    The average number of muscle synergies significantly activated across the 24 targets in both planes in the healthy group (A) and stroke subgroups with mild-to-moderate (B) and severe (C) impairment. Wilcoxon signed-rank test showed that healthy participants activated a significantly greater number of synergies across the 24 target directions during the dynamic task than during the isometric task (**, p < 0.01). In contrast, stroke survivors with severe motor impairment activated a greater number of synergies during the isometric task than during the dynamic task (**, p < 0.01). No significant difference was found between the two tasks in the stroke subgroup with mild-to-moderate impairment

    Correlation of a pair of synergy activation profiles

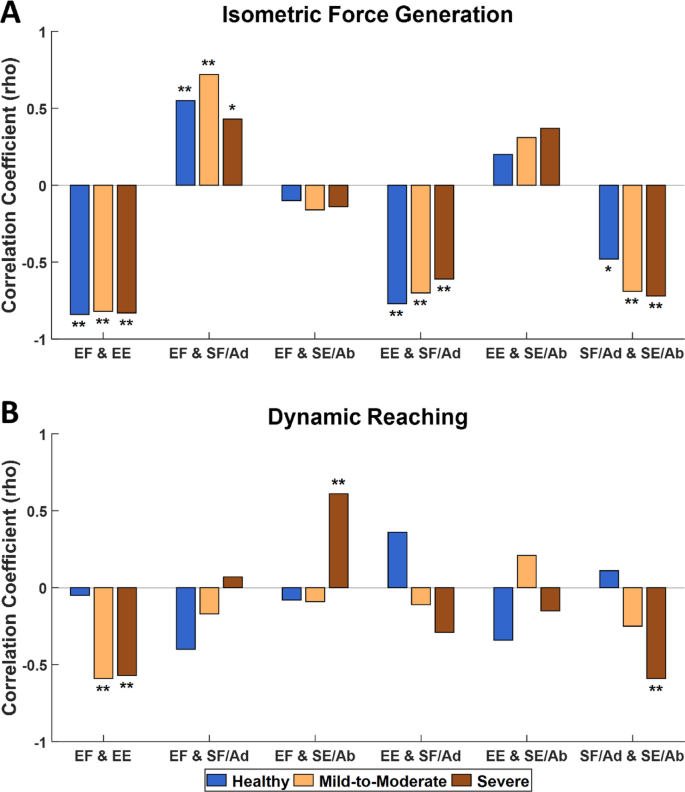
    The trend in the correlation of any possible pairs of averaged synergy activation profiles was different between isometric force generation (Fig. 10A) and dynamic reaching (Fig. 10B) (Spearman’s rank correlation, p < 0.05). During the isometric task, the elbow flexor and extensor synergy activations were negatively correlated in healthy individuals (rho = − 0.84, p < 0.01) as well as in all two-stroke subgroups (rho = − 0.82, p < 0.01, mild-to-moderate; and rho = − 0.83, p < 0.01, severe). Additionally, the preservation of a negative correlation even after stroke was observed between the shoulder antagonistic synergies (SF/Ad and SE/Ab) for the healthy individuals (rho = − 0.48, p < 0.05) and the two-stroke subgroups (rho = − 0.69, p < 0.01, mild-to-moderate; and rho = − 0.72, p < 0.01, severe). Additionally, positive correlations between agonistic synergies across both arm joints (EF and SF/Ad) were consistently maintained for healthy individuals (rho = 0.55, p < 0.01) and the two stroke subgroups (rho = 0.72, p < 0.01, mild-to-moderate; and rho = 0.43, p < 0.05, severe). Finally, the negative correlations between antagonistic synergies across both arm joints (EE and SF/Ad) were found to be kept in the healthy group (rho = − 0.77, p < 0.01), and the two stroke subgroups (rho = − 0.70, p < 0.01, mild-to-moderate; and rho = − 0.61, p < 0.01, severe). These results suggest that the correlation between any possible pairs of the averaged synergy activation profiles within each subgroup remains preserved mainly in the isometric condition, even after stroke.

    In contrast, in the dynamic condition, a significant negative correlation between elbow flexor and extensor synergy activations was not observed in the healthy individuals (rho = − 0.05, p = 0.82), but in the mild-to-moderate (rho = − 0.59, p < 0.01) and severe impaired (rho = − 0.57, p < 0.01) stroke subgroups. Similarly, the shoulder antagonistic synergies (SF/Ad and SE/Ab) did not exhibit a significant correlation for healthy (rho = 0.11, p = 0.59) and stroke survivors with mild-to-moderate impairment (rho = − 0.25, p = 0.25), but they did for severely impaired subgroups (rho = − 0.59, p < 0.01). Interestingly, in participants with severe motor impairment, positive coupling was identified between the elbow flexor and shoulder extensor/abductor synergies (rho = 0.61, p < 0.01).

    Fig. 10
    figure 10

    The correlation coefficients of any possible pairs of synergy activation profiles averaged across participants in any subgroup (Spearman correlation, *, p < 0.05; **, p < 0.01) during the isometric force generation task (A) and the point-to-point reaching task (B). EF, elbow flexor; EE, elbow extensor; SF/Ad, shoulder flexor/adductor; and SE/Ab, shoulder extensor/abductor

    Continue Reading

  • Modernizing mobile networks: Orange begins the transition away from 2G and 3G

    Modernizing mobile networks: Orange begins the transition away from 2G and 3G

    Published on 14 October 2025

    Orange is modernizing its mobile networks to keep pace with fast-changing digital habits. Starting in 2026, 2G will gradually be phased out in mainland France as part of the Lead the Future strategic plan.

    This transition has a clear goal: provide network connectivity that’s simpler, safer, and more sustainable – built for today and ready for tomorrow.

    Orange is part of a global movement: more than 200 operators have already started or completed 2G / 3G migration. Staying true to our role, we’re taking a gradual, step-by-step approach to ensure reliable service and meet the needs of all our customers.

    A responsible technological shift in line with global standards

    Phasing out 2G is an important step toward the future. Orange is preparing a network that is faster, more efficient, and safer. It will meet growing mobile needs, support connected devices, and handle critical services, while strengthening security.

    Phasing out older technologies like 2G and 3G is essential to keep Orange among Europe’s leading network operators and give our customers the best connectivity,” explains Michaël Trabbia, EVP, CEO of Orange Wholesale

    The upgrade follows a global trend. Today, more than 200 operators in nearly 100 countries have already moved on from 2G or 3G. Orange is moving in the same direction while keeping in mind regional differences and the needs of our customers..

    Why is Orange phasing out 2G and 3G?

    2G and 3G are now less used, less secure, and more energy consuming, so they no longer meet the requirements of today’s digital technology. Phasing them out is a logical and responsible step.

    • 4G and 5G networks offer stronger security, including advanced encryption, reliable authentication, and better protection against threats.

    • 2G and 3G carry only a very small part of network traffic today.

    • The frequencies used by 2G and 3G will be repurposed to improve the performance of the latest-generation networks.


    Modernizing our fixed and mobile networks is central to our strategy. With the planned phase-out of 2G in 2026 and 3G by the end of 2028, Orange will guide all customers to 4G and 5G. Our goal is to move all copper network users to fiber and ultra-fast broadband by 2030. This will give faster, safer, and more energy-efficient networks.” Bénédicte Javelot, EVP Strategic Projects & Development at Orange

    This is not just a technological choice but also an environmental one, to better support tomorrow’s digital needs.

    Gradual timeline and support in France

    The change will happen gradually, giving everyone time to adapt. Between March and June 2026, 2G will be phased out in nine departments in the Southwest. It will then expand to the rest of mainland France in the fall. 3G will follow, with full phase-out planned for the end of 2028.

    Key dates reseaux.orange-business (in French)

    Network modernization

    Orange is upgrading its mobile infrastructure in France and Europe

    +200

    Operators worldwide that have started or completed 2G or 3G phase-out

    98.8%

    4G coverage in Romania, the first Orange country to start phasing out 3G

    2026

    Gradual start and end of 2G in mainland France

    End of 2028

    Full 3G shutdown in France

    2030

    Full shutdown of 2G and 3G in all European countries where Orange operates

    This approach ensures clear communication, field testing, and tailored support, keeping services running smoothly while helping individuals and businesses make the transition. .

    Who will be impacted in France?

    As stated in our press release from 21 February 2022, most customers won’t notice the transition. Most phones in use today already support 4G or 5G. Customers with older devices will receive additional support.

    For businesses, some IoT and mobile devices still rely on 2G or 3G. Orange offers full support to help companies move to newer technologies like 4G, LTE-M, VoLTE, or 5G. This includes personalized fleet assessments and step-by-step migration plans to ensure continuous service.

    What is LTE-M?

    LTE-M is a 4G-based cellular technology designed for IoT devices. It uses less energy, works well indoors and underground, and supports mobility and long device lifespan.

    What is VoLTE?

    VoLTE (Voice over LTE) is a cellular technology that allows calls over 4G, providing better audio quality and faster connections compared with 2G or 3G. It also lets voice and data run at the same time on the same network.


    Looking ahead

    This change is part of a clear strategy toward useful, inclusive, and energy-conscious digital services. By focusing on the most effective technologies, Orange strengthens the networks of tomorrow.

    Phasing out 2G and 3G is also central to our Lead the Future strategic plan. Orange is also investing in fiber, 5G, the circular economy, and aims to reach carbon neutrality by 2040.

    It’s a necessary step that’s being carefully managed to operate networks that are easier to use, safer, and more sustainable.

    Key takeaways

    • Networks will be upgraded gradually: 2G ends in 2026 and 3G from late 2028 in France, with a clear timeline.

    • Multiple benefits: safer, more energy-efficient networks ready for today and tomorrow.

    • Tailored support: personalized solutions for individuals and businesses, with special attention to specific and critical uses.

    Continue Reading

  • Meta tightens teen safeguards on Instagram with PG-13-style content filters

    Meta tightens teen safeguards on Instagram with PG-13-style content filters

    (Reuters) -Instagram will limit what users under 18 can see on the platform using filters inspired by the PG-13 movie rating system, in the latest step by its parent Meta to address criticism that it has not done enough to protect teenagers…

    Continue Reading

  • Adherence to the test, treat and track malaria policy among selected health facilities in Ghana: the clients’ perspective | Malaria Journal

    Adherence to the test, treat and track malaria policy among selected health facilities in Ghana: the clients’ perspective | Malaria Journal

    Ghana National Malaria Elimination Programme (NMEP) in line with the WHO aims to minimize malaria morbidity. It aims to approve access to vector control, diagnosis, and treatment, as well as strengthen surveillance and reporting [13]. This study…

    Continue Reading

  • What issues are still to be resolved in the Gaza ceasefire deal? | Gaza

    What issues are still to be resolved in the Gaza ceasefire deal? | Gaza

    The release of Israeli hostages held by Hamas and Palestinian prisoners and detainees held by Israel, and the extraordinary images of catharsis and relief that followed, were the best possible argument for the virtues of Donald Trump’s plan for…

    Continue Reading

  • Anoush’s story: how football is helping refugees to build new lives

    Anoush’s story: how football is helping refugees to build new lives

    My father fought against the Soviet Union after they invaded Afghanistan. After the withdrawal of Soviet forces in 1989, a civil conflict broke out. It was no longer safe, and my family fled to Pakistan, where we lived in a refugee…

    Continue Reading

  • Back to the Future Commemorates 40th Anniversary with All-New Merchandise Inspired by the Iconic Film, Theatrical Re-release and More

    Back to the Future Commemorates 40th Anniversary with All-New Merchandise Inspired by the Iconic Film, Theatrical Re-release and More

    Those looking for a virtual Back to the Future experience can time-travel in Funko Fusion, the crossover action-adventure video game, which features a level and quests inspired by the film.

    Universal Pictures Home Entertainment debuts a…

    Continue Reading

  • SteelSeries’ refreshed Nova 7 gaming headset gets a big battery life boost

    SteelSeries’ refreshed Nova 7 gaming headset gets a big battery life boost

    SteelSeries is launching the second generation of its popular Nova 7 wireless gaming headset today, with support for real-time audio control and a massive 40 percent battery life improvement. If you’re not interested in the $599.99 Nova Elite…

    Continue Reading

  • Zight Enhances Support Workflows with Request Video Logs, Zendesk Upgrades, and a New Integration Marketplace

    Zight Enhances Support Workflows with Request Video Logs, Zendesk Upgrades, and a New Integration Marketplace

    Zight’s latest updates simplify customer support by combining video context, automation, and integrations to eliminate guesswork and speed up resolutions.

    SAN FRANCISCO, Oct….

    Continue Reading