Pink granite boulders scattered across the dark volcanic peaks of the Hudson Mountains in West Antarctica, have revealed the presence of a vast buried granite body – almost 100 km across and 7 km thick, about half the size of Wales in…
Blog
-

Boston Scientific announces results for third quarter 2025
MARLBOROUGH, Mass., Oct. 22, 2025 /PRNewswire/ — Boston Scientific Corporation (NYSE: BSX) generated net sales of $5.065 billion during the third quarter of 2025, growing 20.3 percent on a reported basis, 19.4 percent on an operational1 basis and 15.3 percent on an organic2 basis, all compared to the prior year period. The company reported GAAP net income attributable to Boston Scientific common stockholders of $755 million or $0.51 per share (EPS), compared to $469 million or $0.32 per share a year ago, and achieved adjusted3 EPS of $0.75 for the period, compared to $0.63 a year ago.
“We delivered another exceptional quarter of strong performance across businesses and regions thanks to the winning spirit of our global team,” said Mike Mahoney, chairman and chief executive officer, Boston Scientific. “As we shared at our recent Investor Day meeting, we are well-positioned for differentiated growth that is fueled by our category leadership strategy, relentless focus on innovation and commitment to scaling capabilities.”
Third quarter financial results and recent developments:
- Reported net sales of $5.065 billion, representing an increase of 20.3 percent on a reported basis, compared to the company’s guidance range of 17 to 19 percent; 19.4 percent on an operational basis; and 15.3 percent on an organic basis, compared to the company’s guidance range of 12 to 14 percent, all compared to the prior year period.
- Reported GAAP net income attributable to Boston Scientific common stockholders of $0.51 per share, compared to the company’s guidance range of $0.44 to $0.46 per share, and achieved adjusted EPS of $0.75 per share, compared to the guidance range of $0.70 to $0.72 per share.
- Achieved the following net sales growth in each reportable segment, compared to the prior year period:
- MedSurg: 16.4 percent reported, 15.6 percent operational and 7.6 percent organic
- Cardiovascular: 22.4 percent reported, 21.5 percent operational and 19.4 percent organic
- Achieved the following net sales growth/(declines) in each region, compared to the prior year period:
- United States (U.S.): 27.0 percent reported and operational
- Europe, Middle East and Africa (EMEA): 2.6 percent reported and (2.0) percent operational
- In the second quarter of 2025, management made the decision to discontinue worldwide sales of the ACURATE neo2™ and ACURATE Prime™ Aortic Valve Systems, which had prior year global sales of approximately $50 million per quarter
- Asia-Pacific (APAC): 17.1 percent reported and 16.9 percent operational
- Latin America and Canada (LACA): 10.4 percent reported and 9.6 percent operational
- Emerging Markets4: 11.8 percent reported and 11.5 percent operational
- Announced Pharmaceuticals and Medical Device Agency (PMDA) approval in Japan for expanded labeling of the FARAPULSE™ Pulsed Field Ablation (PFA) System to include treatment of drug refractory, symptomatic persistent atrial fibrillation (AF).
- Commenced enrollment in the AGENT DCB STANCE trial to assess the safety and effectiveness of the AGENT™ Drug-Coated Balloon (DCB) in patients with previously untreated coronary lesions, compared to standard of care percutaneous coronary intervention (PCI) treatment with drug-eluting stents and/or balloon angioplasty.
- Published in JAMA Neurology outcomes from the five-year INTREPID study demonstrating sustained benefits of deep brain stimulation in people with moderate to advanced Parkinson’s disease, including improved motor function and quality of life.
- Completed asset acquisition with Elutia, Inc. to acquire the antibiotic-eluting EluPro™ BioEnvelope and the CanGaroo® Envelope, designed to prevent certain post-operative complications for devices such as pacemakers and defibrillators.
- Announced agreement to acquire Nalu Medical, Inc., developer of the Nalu Neuromodulation System, which is designed to use peripheral nerve stimulation to deliver targeted relief for adults living with severe, intractable chronic pain of peripheral nerve origin — subject to customary closing conditions.
1.
Operational net sales growth excludes the impact of foreign currency fluctuations.
2.
Organic net sales growth excludes the impact of foreign currency fluctuations and net sales attributable to certain acquisitions and divestitures for which there are less than a full period of comparable net sales.
3.
Adjusted EPS excludes the impacts of certain charges (credits) which may include amortization expense, goodwill and other intangible asset impairment charges, acquisition/divestiture-related net charges (credits), investment portfolio net losses (gains) and impairments, restructuring and restructuring-related net charges (credits), certain litigation-related net charges (credits), European Union (EU) Medical Device Regulation (MDR) implementation costs, debt extinguishment net charges, deferred tax expenses (benefits) and certain discrete tax items.
4.
Our Emerging Markets countries include all countries except the United States, Western and Central Europe, Japan, Australia, New Zealand and Canada.
Net sales for the third quarter by business and region:
Increase/(Decrease)
Three Months Ended
September 30,Reported
BasisImpact of
Foreign
Currency
FluctuationsOperational
Basis
Impact of
Certain
Acquisitions
/DivestituresOrganic
Basis(in millions)
2025
2024
Endoscopy
$ 747
$ 678
10.1 %
(1.1) %
9.0 %
— %
9.0 %
Urology
682
532
28.1 %
(0.6) %
27.5 %
(22.1) %
5.4 %
Neuromodulation
293
268
9.1 %
(0.5) %
8.6 %
— %
8.6 %
MedSurg
1,722
1,479
16.4 %
(0.8) %
15.6 %
(8.0) %
7.6 %
Cardiology
2,641
2,129
24.0 %
(1.0) %
23.1 %
— %
23.1 %
Peripheral Interventions
702
602
16.7 %
(0.9) %
15.8 %
(9.5) %
6.3 %
Cardiovascular
3,343
2,731
22.4 %
(1.0) %
21.5 %
(2.1) %
19.4 %
Net Sales
$ 5,065
$ 4,209
20.3 %
(0.9) %
19.4 %
(4.2) %
15.3 %
Increase/(Decrease)
Three Months Ended
September 30,
Reported
BasisImpact of
Foreign
Currency
FluctuationsOperational
Basis
(in millions)
2025
2024
U.S.
$ 3,294
$ 2,593
27.0 %
— %
27.0 %
EMEA
793
773
2.6 %
(4.6) %
(2.0) %
APAC
802
684
17.1 %
(0.2) %
16.9 %
LACA
175
159
10.4 %
(0.8) %
9.6 %
Net Sales
$ 5,065
$ 4,209
20.3 %
(0.9) %
19.4 %
Emerging Markets4
$ 765
$ 684
11.8 %
(0.2) %
11.5 %
Amounts may not add due to rounding. Growth rates are based on actual, non-rounded amounts and may not recalculate precisely.
Net sales growth rates that exclude the impact of foreign currency fluctuations and/or the impact of certain acquisitions/divestitures are not prepared in accordance with U.S. GAAP.
Guidance for Full Year and Fourth Quarter 2025
The company estimates net sales growth for the full year 2025, versus the prior year period, to be approximately 20 percent on a reported basis and approximately 15.5 percent on an organic basis. Full year organic net sales guidance excludes the impact of foreign currency fluctuations and net sales attributable to certain acquisitions and divestitures for which there are less than a full period of comparable net sales. The company estimates EPS on a GAAP basis in a range of $1.97 to $2.01 and estimates adjusted EPS, excluding certain charges (credits), of $3.02 to $3.04.The company estimates net sales growth for the fourth quarter of 2025, versus the prior year period, to be in a range of approximately 14.5 to 16.5 percent on a reported basis, and 11 to 13 percent on an organic basis. Fourth quarter organic net sales guidance excludes the impact of foreign currency fluctuations and net sales attributable to certain acquisitions and divestitures for which there are less than a full period of comparable net sales. The company estimates EPS on a GAAP basis in a range of $0.48 to $0.52 and estimates adjusted EPS, excluding certain charges (credits), of $0.77 to $0.79.
Conference Call Information
Boston Scientific management will be discussing these results with analysts on a conference call today at 8:00 a.m. ET. The company will webcast the call to interested parties through its website: investors.bostonscientific.com. Please see the website for details on how to access the webcast. The webcast will be available for approximately one year on the Boston Scientific website.About Boston Scientific
Boston Scientific transforms lives through innovative medical technologies that improve the health of patients around the world. As a global medical technology leader for more than 45 years, we advance science for life by providing a broad range of high-performance solutions that address unmet patient needs and reduce the cost of healthcare. Our portfolio of devices and therapies helps physicians diagnose and treat complex cardiovascular, respiratory, digestive, oncological, neurological and urological diseases and conditions. Learn more at www.bostonscientific.com and follow us on LinkedIn.Cautionary Statement Regarding Forward-Looking Statements
This press release contains forward-looking statements within the meaning of Section 27A of the Securities Act of 1933 and Section 21E of the Securities Exchange Act of 1934. Forward-looking statements may be identified by words like “anticipate,” “expect,” “project,” “believe,” “plan,” “estimate,” “may,” “intend” and similar words. These forward-looking statements are based on our beliefs, assumptions and estimates using information available to us at the time and are not intended to be guarantees of future events or performance. These forward-looking statements include, among other things, statements regarding our expected net sales; reported, operational and organic revenue growth rates; reported and adjusted EPS for the fourth quarter and full year 2025; our financial performance; acquisitions; clinical trials; our business plans and product performance; and new and anticipated product approvals and launches. If our underlying assumptions turn out to be incorrect, or if certain risks or uncertainties materialize, actual results could vary materially from the expectations and projections expressed or implied by our forward-looking statements. These factors, in some cases, have affected and in the future (together with other factors) could affect our ability to implement our business strategy and may cause actual results to differ materially from those contemplated by the statements expressed in this press release. As a result, readers are cautioned not to place undue reliance on any of our forward-looking statements.Risks and uncertainties that may cause such differences include, among other things: economic conditions, including the impact of foreign currency fluctuations; future U.S. and global political, competitive, reimbursement and regulatory conditions, including changing trade and tariff policies; geopolitical events; manufacturing, distribution and supply chain disruptions and cost increases; disruptions caused by cybersecurity events; disruptions caused by public health emergencies or extreme weather or other climate change-related events; labor shortages and increases in labor costs; variations in outcomes of ongoing and future clinical trials and market studies; new product introductions; expected procedural volumes; the closing and integration of acquisitions; demographic trends; intellectual property; litigation; financial market conditions; the execution and effect of our business strategy, including our cost-savings and growth initiatives; and future business decisions made by us and our competitors. New risks and uncertainties may arise from time to time and are difficult to predict accurately and many of them are beyond our control. For a further list and description of these and other important risks and uncertainties that may affect our future operations, see Part I, Item 1A – Risk Factors in our most recent Annual Report on Form 10-K filed with the Securities and Exchange Commission, which we may update in Part II, Item 1A – Risk Factors in Quarterly Reports on Form 10-Q we have filed or will file hereafter. We disclaim any intention or obligation to publicly update or revise any forward-looking statements to reflect any change in our expectations or in events, conditions, or circumstances on which those expectations may be based, or that may affect the likelihood that actual results will differ from those contained in the forward-looking statements, except as required by law. This cautionary statement is applicable to all forward-looking statements contained in this press release.
Note: Amounts reported in millions within this press release are computed based on the amounts in thousands. As a result, the sum of the components reported in millions may not equal the total amount reported in millions due to rounding. Certain columns and rows within tables may not add due to the use of rounded numbers. Percentages presented are calculated from the underlying unrounded amounts.
Use of Non-GAAP Financial Information
A reconciliation of the company’s non-GAAP financial measures to the corresponding GAAP measures, and an explanation of the company’s use of these non-GAAP financial measures, is included in the exhibits attached to this press release.BOSTON SCIENTIFIC CORPORATION
CONSOLIDATED STATEMENTS OF OPERATIONS
(Unaudited)
Three Months Ended
September 30,
Nine Months Ended
September 30,
(in millions, except per share data)
2025
2024
2025
2024
Net sales
$ 5,065
$ 4,209
$ 14,788
$ 12,186
Cost of products sold (excluding amortization of intangibles)
1,523
1,312
4,613
3,791
Gross profit
3,542
2,897
10,175
8,395
Operating expenses:
Selling, general and administrative expenses
1,741
1,562
5,053
4,372
Research and development expenses
514
407
1,483
1,156
Royalty expense
12
5
40
24
Amortization expense
225
205
669
631
Intangible asset impairment charges
0
—
46
276
Contingent consideration net expense (benefit)
11
(23)
11
(4)
Restructuring net charges (credits)
(8)
8
85
12
2,494
2,164
7,387
6,467
Operating income (loss)
1,048
733
2,788
1,928
Other income (expense):
Interest expense
(87)
(79)
(259)
(225)
Other, net
(23)
14
156
(7)
Income (loss) before income taxes
939
669
2,685
1,697
Income tax expense (benefit)
183
200
463
413
Net income (loss)
755
468
2,222
1,284
Net income (loss) attributable to noncontrolling interests
(0)
(0)
(4)
(4)
Net income (loss) attributable to Boston Scientific common
stockholders$ 755
$ 469
$ 2,226
$ 1,288
Net income (loss) per common share – basic
$ 0.51
$ 0.32
$ 1.50
$ 0.88
Net income (loss) per common share – diluted
$ 0.51
$ 0.32
$ 1.49
$ 0.87
Weighted-average shares outstanding
Basic
1,481.7
1,472.7
1,479.6
1,470.6
Diluted
1,495.5
1,487.4
1,494.0
1,484.5
Amounts may not add due to rounding.
BOSTON SCIENTIFIC CORPORATION
NON-GAAP NET INCOME AND NET INCOME PER SHARE RECONCILIATIONS
(Unaudited)
Three Months Ended September 30, 2025
(in millions, except per share data)
Gross
ProfitOperating
ExpensesOperating
Income
(Loss)Other
Income
(Expense)Income
(Loss)
Before
Income
TaxesNet
Income
(Loss)Net Income
(Loss)
Attributable to
Noncontrolling
InterestsNet Income
(Loss)
Attributable to
Boston
Scientific
Common
StockholdersImpact
per
ShareReported
$ 3,542
$ 2,494
$ 1,048
$ (110)
$ 939
$ 755
$ (0)
$ 755
$ 0.51
Non-GAAP adjustments:
Amortization expense
—
(225)
225
—
225
194
2
191
0.13
Goodwill and other intangible asset impairment
charges—
(0)
0
—
0
0
—
0
0.00
Acquisition/divestiture-related net charges
(credits)23
(76)
99
0
99
95
—
95
0.06
Restructuring and restructuring-related net
charges (credits)23
(14)
36
—
36
30
—
30
0.02
Investment portfolio net losses (gains) and
impairments—
—
—
(6)
(6)
(5)
—
(5)
(0.00)
EU MDR implementation costs
7
(4)
11
—
11
9
—
9
0.01
Deferred tax expenses (benefits)
—
—
—
—
—
47
—
47
0.03
Discrete tax items
—
—
—
—
—
1
—
1
0.00
Adjusted
$ 3,595
$ 2,175
$ 1,419
$ (116)
$ 1,303
$ 1,126
$ 2
$ 1,124
$ 0.75
Three Months Ended September 30, 2024
(in millions, except per share data)
Gross
ProfitOperating
ExpensesOperating
Income
(Loss)Other
Income
(Expense)Income
(Loss)
Before
Income
TaxesNet
Income
(Loss)Net Income
(Loss)
Attributable to
Noncontrolling
InterestsNet Income
(Loss)
Attributable to
Boston
Scientific
Common
StockholdersImpact
per
ShareReported
$ 2,897
$ 2,164
$ 733
$ (65)
$ 669
$ 468
$ (0)
$ 469
$ 0.32
Non-GAAP adjustments:
Amortization expense
—
(205)
205
—
205
177
2
175
0.12
Acquisition/divestiture-related net charges
(credits)27
(116)
143
0
144
200
—
200
0.13
Restructuring and restructuring-related net
charges (credits)28
(24)
52
—
52
45
—
45
0.03
Investment portfolio net losses (gains) and
impairments—
—
—
(1)
(1)
(1)
—
(1)
(0.00)
EU MDR implementation costs
9
(4)
13
—
13
12
—
12
0.01
Deferred tax expenses (benefits)
—
—
—
—
—
38
—
38
0.03
Adjusted
$ 2,962
$ 1,815
$ 1,147
$ (65)
$ 1,082
$ 939
$ 2
$ 937
$ 0.63
An explanation of the company’s use of these non-GAAP financial measures is provided at the end of this document.
Amounts may not add due to rounding.
BOSTON SCIENTIFIC CORPORATION
NON-GAAP NET INCOME AND NET INCOME PER SHARE RECONCILIATIONS
(Unaudited)
Nine Months Ended September 30, 2025
(in millions, except per share data)
Gross
ProfitOperating
ExpensesOperating
Income
(Loss)Other
Income
(Expense)
Income
(Loss)
BeforeIncome
TaxesNet
Income(Loss)
Net Income
(Loss)
Attributable to
Noncontrolling
InterestsNet Income
(Loss)
Attributable to
Boston
Scientific
Common
StockholdersImpact
per
ShareReported
$ 10,175
$ 7,387
$ 2,788
$ (103)
$ 2,685
$ 2,222
$ (4)
$ 2,226
$ 1.49
Non-GAAP adjustments:
Amortization expense
—
(669)
669
—
669
576
7
570
0.38
Goodwill and other intangible asset impairment
charges—
(46)
46
—
46
37
—
37
0.02
Acquisition/divestiture-related net charges
(credits)159
(226)
385
(229)
156
157
—
157
0.10
Restructuring and restructuring-related net
charges (credits)84
(162)
247
—
247
215
—
215
0.14
Investment portfolio net losses (gains) and
impairments—
—
—
(0)
(0)
(0)
—
(0)
(0.00)
EU MDR implementation costs
22
(11)
34
—
34
29
—
29
0.02
Deferred tax expenses (benefits)
—
—
—
—
—
139
—
139
0.09
Discrete tax items
—
—
—
—
—
1
—
1
0.00
Adjusted
$ 10,440
$ 6,272
$ 4,168
$ (332)
$ 3,836
$ 3,375
$ 3
$ 3,372
$ 2.26
Nine Months Ended September 30, 2024
(in millions, except per share data)
Gross
ProfitOperating
Expenses
Operating
Income
(Loss)
Other
Income
(Expense)
Income
(Loss)
BeforeIncome
Taxes
Net
Income(Loss)
Net Income
(Loss)
Attributable toNoncontrolling
Interests
Net Income
(Loss)
Attributable to
Boston
Scientific
CommonStockholders
Impact
perShare
Reported
$ 8,395
$ 6,467
$ 1,928
$ (231)
$ 1,697
$ 1,284
$ (4)
$ 1,288
$ 0.87
Non-GAAP adjustments:
Amortization expense
—
(631)
631
—
631
545
7
539
0.36
Goodwill and other intangible asset impairment
charges—
(276)
276
—
276
243
—
243
0.16
Acquisition/divestiture-related net charges
(credits)49
(207)
255
1
256
315
—
315
0.21
Restructuring and restructuring-related net
charges (credits)83
(65)
149
—
149
129
—
129
0.09
Investment portfolio net losses (gains) and
impairments—
—
—
17
17
17
—
17
0.01
EU MDR implementation costs
27
(12)
39
—
39
34
—
34
0.02
Deferred tax expenses (benefits)
—
—
—
—
—
120
—
120
0.08
Adjusted
$ 8,553
$ 5,275
$ 3,278
$ (213)
$ 3,065
$ 2,685
$ 2
$ 2,683
$ 1.81
An explanation of the company’s use of these non-GAAP financial measures is provided at the end of this document.
Amounts may not add due to rounding.
BOSTON SCIENTIFIC CORPORATION
Q4 and FY 2025 GUIDANCE RECONCILIATIONS
(Unaudited)
Net Sales
Q4 2025 Estimate
(Low)
(High)
Full Year 2025 Estimate
Reported growth
14.5 %
16.5 %
~20.0%
Impact of foreign currency fluctuations
(2.0) %
(2.0) %
~(1.0)%
Operational growth
12.5 %
14.5 %
~19.0%
Impact of certain acquisitions/divestitures
(1.5) %
(1.5) %
~(3.5)%
Organic growth
11.0 %
13.0 %
~15.5%
Earnings per Share
Q4 2025 Estimate
Full Year 2025 Estimate
(Low)
(High)
(Low)
(High)
GAAP results
$ 0.48
$ 0.52
$ 1.97
$ 2.01
Amortization expense
0.13
0.13
0.51
0.51
Acquisition/divestiture-related net charges (credits)
0.04
0.04
0.15
0.15
Restructuring and restructuring-related net charges
(credits)0.07
0.05
0.22
0.20
Other adjustments
0.04
0.04
0.18
0.18
Adjusted results
$ 0.77
$ 0.79
$ 3.02
$ 3.04
Amounts may not add due to rounding.
Use of Non-GAAP Financial Measures
To supplement our unaudited consolidated financial statements presented on a GAAP basis, we disclose certain non-GAAP financial measures, including adjusted net income (loss), adjusted net income (loss) attributable to Boston Scientific common stockholders and adjusted net income (loss) per share (EPS) that exclude certain charges (credits); operational net sales, which exclude the impact of foreign currency fluctuations; and organic net sales, which exclude the impact of foreign currency fluctuations as well as the impact of certain acquisitions and divestitures with less than a full period of comparable net sales. These non-GAAP financial measures are not in accordance with generally accepted accounting principles in the United States and should not be considered in isolation from or as a replacement for the most directly comparable GAAP financial measures. Further, other companies may calculate these non-GAAP financial measures differently than we do, which may limit the usefulness of those measures for comparative purposes.
To calculate adjusted net income (loss), adjusted net income (loss) attributable to Boston Scientific common stockholders and adjusted net income (loss) per share, we exclude certain charges (credits) from GAAP net income and GAAP net income attributable to Boston Scientific common stockholders, which include amortization expense, goodwill and other intangible asset impairment charges, acquisition/divestiture-related net charges (credits), investment portfolio net losses (gains) and impairments, restructuring and restructuring-related net charges (credits), certain litigation-related net charges (credits), EU MDR implementation costs, debt extinguishment net charges, deferred tax expenses (benefits) and certain discrete tax items. Amounts are presented after-tax using the company’s effective tax rate, unless the amount is a significant unusual or infrequently occurring item in accordance with Financial Accounting Standards Board Accounting Standards Codification Topic 740-270-30, “General Methodology and Use of Estimated Annual Effective Tax Rate.” In addition to the explanation below, please refer to Part II, Item 7. Management’s Discussion and Analysis of Financial Condition and Results of Operations in our most recent Annual Report on Form 10-K filed with the Securities and Exchange Commission or Part I, Item 2. Management’s Discussion and Analysis of Financial Condition and Results of Operations in any Quarterly Report on Form 10-Q that we have filed or will file thereafter for an explanation of each of these adjustments and the reasons for excluding each item. The following is an explanation of each incremental or revised adjustment type, since our most recent Annual Report on Form 10-K, that management excluded as part of these non-GAAP financial measures as well as the reason for excluding each item:
- Restructuring and restructuring-related net charges (credits) – These adjustments primarily represent severance and other compensation-related charges, fixed asset write-offs, contract cancellations, project management fees, facility shut down costs, costs to transfer manufacturing lines between geographically dispersed facilities and other direct costs associated with our restructuring plans. These restructuring plans each consist of distinct initiatives that are fundamentally different from our ongoing, core cost reduction initiatives in terms of, among other things, the frequency with which each action is performed and the required planning, resourcing, cost and timing. Examples of such initiatives include the movement of business activities, facility consolidations and closures and the transfer of product lines between manufacturing facilities, which, due to the highly regulated nature of our industry, requires a significant investment in time and cost to create duplicate manufacturing lines, run product validations and seek regulatory approvals. Restructuring plans take place over a defined timeframe and have a distinct project timeline that requires, and begins subsequent to, approval by our Board of Directors. In contrast to our ongoing cost reduction initiatives, restructuring plans typically result in duplicative cost and exit costs over the defined timeframe and are not considered part of our core, ongoing operations. In addition, during the second and third quarter of 2025, we incurred restructuring and restructuring-related net charges (credits) associated with management’s decision to discontinue worldwide sales of the ACURATE neo2TM and ACURATE PrimeTM Aortic Valve Systems. These restructuring plans and activities are incremental to the core activities that arise in the ordinary course of our business. Restructuring and restructuring-related net charges (credits) are excluded from management’s assessment of operating performance and from our operating segments’ measures of profit and loss used for making operating decisions and assessing performance.
The GAAP financial measures most directly comparable to adjusted net income (loss), adjusted net income (loss) attributable to Boston Scientific common stockholders and adjusted net income (loss) per share are GAAP net income (loss), GAAP net income (loss) attributable to Boston Scientific common stockholders and GAAP net income (loss) per common share – diluted, respectively.
To calculate operational net sales growth rates, which exclude the impact of foreign currency fluctuations, we convert actual net sales from local currency to U.S. dollars using constant foreign currency exchange rates in the current and prior periods. To calculate organic net sales growth rates, we also remove the impact of certain acquisitions and divestitures with less than a full period of comparable net sales. The GAAP financial measure most directly comparable to operational net sales and organic net sales is net sales reported on a GAAP basis.
Reconciliations of each of these non-GAAP financial measures to the corresponding GAAP financial measure are included in the accompanying schedules.
Management uses these supplemental non-GAAP financial measures to evaluate performance period over period, to analyze the underlying trends in our business, to assess our performance relative to our competitors and to establish operational goals and forecasts that are used in allocating resources. In addition, management uses these non-GAAP financial measures to further its understanding of the performance of our operating segments. The adjustments excluded from our non-GAAP financial measures are consistent with those excluded from our operating segments’ measures of net sales and profit or loss. These adjustments are excluded from the segment measures reported to our chief operating decision maker that are used to make operating decisions and assess performance.
We believe that presenting adjusted net income (loss), adjusted net income (loss) attributable to Boston Scientific common stockholders, adjusted net income (loss) per share, operational net sales growth rates and organic net sales growth rates, in addition to the corresponding GAAP financial measures, provides investors greater transparency to the information used by management for its operational decision-making and allows investors to see our results “through the eyes” of management. We further believe that providing this information assists our investors in understanding our operating performance and the methodology used by management to evaluate and measure such performance.
SOURCE Boston Scientific Corporation
Continue Reading
-

‘At night, his guitar comes into my mind’: Amadou and Mariam’s surviving singer on life after losing her husband and musical partner | Amadou and Mariam
On 4 April, Amadou Bagayoko died suddenly, aged 70, in Bamako, Mali. The country’s ministry of culture announced the news. Thousands attended the funeral, including former collaborators Manu Chao, Youssou N’Dour, Malian–French rapper…
Continue Reading
-

Assessment of Food Cravings, Food Intake, and Weight Status Among Saud
Introduction
Eating behavior is driven not only by the basic need to alleviate hunger but also by cravings and the pursuit of pleasure from food.1 Individuals commonly experience cravings for foods rich in calories but poor in nutrients.2 The…
Continue Reading
-

Asian Youth Games 2025 medal tally
A total of 222 Indian athletes – 119 women and 103 men – are competing for medals across 21 sports at the ongoing Asian Youth Games 2025 in Manama, Bahrain.
The continental event – returning after a 12-year gap since the 2013 edition held in…
Continue Reading
-

Employers urged to prepare as UK government ramps up clean energy jobs plan
The new Clean Energy Jobs Plan published by the government at the weekend, with expectations that the number of clean energy sector jobs may double to 860,000 roles by 2030, looks to revamp the process to get more people into the workforce.
This includes funding to get 16- to 19-year-olds skilled in clean energy sector work, investing in engineering higher education provision and the launch of five clean energy technical excellence colleges. Existing investment plans to boost the UK’s skilled construction workforce will supplement this with 10 construction technical excellence colleges. Skills England will also ensure apprenticeships and technical qualifications deliver skills needed across the clean energy sector.
Up to £20 million will also be made available from the UK and Scottish governments to help upskill oil and gas industry workers to allow them to transition to roles in the renewables sector. Following on from a successful skills pilot in Aberdeen. The ‘energy skills passport’, which identifies routes for oil and gas workers to transition into roles in offshore wind, will also be updated to include nuclear and electricity grid roles.
The government has already published plans for a ‘fair work charter’ to cover the wind industry, with new social value requirements also having come into effect this month as part of the national procurement plan which applies equally to the clean energy sector. Both initiatives are a drive to improve standards and training within the sector. The plan also signals that the government considers the fair work charter for the wind industry as a pilot and will explore extending the concept to other clean energy sectors.
Gillian Harrington, an employment law expert with Pinsent Masons, said the moves send a clear message to clean energy employers about the need to demonstrate commitment to improving employment standards.
“The message to employers who want to engage in government backed clean energy projects is clear – your employment standards will be an important aspect of any evaluation of a funding request or procurement opportunity,” she said.
“Employers in the clean energy sector may want to plan how any additional fair work standards can be factored into wider changes needed as the Employment Rights Bill is also gradually implemented.”
The report draws together previously highlighted themes, including the government’s clean energy industries sector plan (90 pages / 9.5 MB), 10-year industrial strategy (160 pages / 15.6 MB) and the recent consultation over proposals to link financial incentives for offshore wind companies to fair work standards and skills training for staff as part of clean industry bonuses (CIB) allocation.
The plan also looks to boost trade union involvement in the sector, with unions invited to negotiate the CIB fair work charter with the government and stakeholder employers, along with increasing union recognition and collective bargaining – with the plan noting: “For too long, parts of the clean energy sector have been a union-free zone”. The plan also announces that the government will, “work with industry and trade unions to explore a range of other initiatives, including the potential for Framework Agreements and sector specific arrangements to guide job quality standards for major infrastructure projects”.
Anthony Convery, an expert in employment law with Pinsent Masons, said: “The Employment Rights Bill will make trade union recognition easier and will give even non-recognised unions rights to request physical and digital access to workplaces. The new plan puts clean energy sector employers clearly in the line of sight of unions who are eager to get a foothold in workplaces operating in this sector”.
He added: “The plan for framework agreements also sounds somewhat like a form of sectoral collective bargaining for parts of the clean energy sector. The Employment Rights Bill only makes provision for sectoral collective bargaining in relation to adult social care and school support staff, but Labour’s Plan to Make Work Pay did say that it would assess how and to what extent sectoral collective bargaining could benefit other sectors and tackle labour market challenges”.
The plan also covers extending employment rights to certain offshore workers, with the intention of reducing discrepancies that it notes can arise between offshore oil and gas workers and offshore renewable and low carbon energy workers. Further clarification of this proposed extension of the law will be needed to understand the potential impact, the experts said.
Continue Reading
-
Concurrent Validity of the Operationalization of High-Impact Pain Cons
Introduction
Historically, surveillance of chronic pain has faced several limitations, such as a lack of standardized methods and definitions, hindering the accurate monitoring of its prevalence and impact. To that end, in 2016, the US National…
Continue Reading
-

Star Trek’s Chris Pine to make London theatre debut in Ivanov next summer | Theatre
Star Trek’s Chris Pine will boldly go to the Bridge next summer but the actor, best known for playing James T Kirk in the sci-fi reboot, is swapping the starship for the stage.
For his London theatre debut, Pine has been cast in the title role…
Continue Reading
-

Inside a Cloud-Based Gift Card Fraud Campaign
Executive Summary
We investigated a campaign waged by financially motivated threat actors operating out of Morocco. We refer to this campaign as Jingle Thief, due to the attackers’ modus operandi of conducting gift card fraud during festive seasons. Jingle Thief attackers use phishing and smishing to steal credentials, to compromise organizations that issue gift cards. Their operations primarily target global enterprises in the retail and consumer services sectors. Once they gain access to an organization, they pursue the type and level of access needed to issue unauthorized gift cards.
The activity related to this campaign is tracked by Unit 42 as cluster CL‑CRI‑1032. The threat actors behind the activity target organizations that primarily rely on cloud-based services and infrastructure. They then exploit Microsoft 365 capabilities to conduct reconnaissance, maintain long-term persistence and execute large-scale gift card fraud. We assess with moderate confidence that the activity cluster we track as CL-CRI-1032 overlaps with the activity of threat actors publicly tracked as Atlas Lion and STORM-0539 [PDF].
What makes the threat actor behind this activity particularly dangerous is the ability to maintain a foothold inside organizations for extended periods — sometimes over a year. During this time, they gain deep familiarity with the environment, including how to access critical infrastructure — making detection and remediation especially challenging. In April and May 2025, the threat actor behind the Jingle Thief campaign launched a wave of coordinated attacks across multiple global enterprises.
This article presents an end-to-end analysis of the Jingle Thief campaign lifecycle, based on real-world incident telemetry and detections. We provide a clear view of the methods involved in this activity, and practical guidance for mitigating identity-based threats — attacks that target user accounts and credentials — in cloud environments. As identity increasingly replaces the traditional perimeter, understanding campaigns like Jingle Thief is essential to securing modern enterprise infrastructure.
This activity was identified through behavioral anomalies detected by Cortex User Entity Behavior Analytics (UEBA) and Identity Threat Detection and Response (ITDR). Customers are better protected from this activity with the new Cortex Advanced Email Security module.
If you think you might have been compromised or have an urgent matter, contact the Unit 42 Incident Response team.
Who Is Behind the Jingle Thief Campaign?
We assess with moderate confidence that the Jingle Thief campaign was created by financially motivated Morocco-based attackers who have been active since 2021. Their operations primarily target global enterprises in the retail and consumer services sectors. Although not affiliated with a nation-state, the activity we track as CL‑CRI‑1032 includes advanced tactics, persistence and operational focus.
Unlike threat actors who rely on commodity malware or endpoint exploitation, the attackers behind CL‑CRI‑1032 operate almost exclusively in cloud environments once they obtain credentials through phishing. They exploit cloud-based infrastructure to impersonate legitimate users, gain unauthorized access to sensitive data and carry out gift card fraud at scale.
Anatomy of the Jingle Thief Campaign
In a campaign that we observed, threat actors maintained access for approximately 10 months and compromised over 60 user accounts within a single global enterprise. The activity involved the use of Microsoft 365 services, including SharePoint, OneDrive, Exchange and Entra ID. This demonstrated a high degree of adaptability and operational patience. Detecting this approach requires close observation of adversaries’ actions over an extended period. The threat actors behind the Jingle Thief campaign often align their activity with holiday periods, increasing operations during times of reduced staffing and heightened gift card spending.
Having gained initial access, the threat actors conducted reconnaissance to map the environment, moved laterally to access more sensitive areas, and identified opportunities to execute large-scale financial fraud. Figure 1 illustrates the end-to-end attack lifecycle across Microsoft 365, highlighting how the threat actors progressed from phishing-based entry to persistent access through device registration.
Figure 1. Jingle Thief phishing attack chain across Microsoft 365. The final attack step of device registration creates a foothold that the threat actors exploit to issue gift cards, which they then leverage for monetary gain.
Why Gift Cards? The Prey of Choice
Gift cards are highly attractive to financially motivated actors due to their ease of redemption and rapid monetization. Threat actors resell gift cards on gray-market forums at discounted rates, enabling near-instant cash flow.
Additional factors that make gift cards attractive include:
- Minimal personal information required for redemption
- Difficult to trace, making fraud harder to investigate or recover
- Accepted widely, often indistinguishable from legitimate use
- Useful for low-risk money laundering, especially across jurisdictions
- Frequently issued through systems with weak access controls, broad internal permissions, and limited monitoring or logging
Retail environments are particularly vulnerable to this type of attack, as gift card systems are often accessible to a wide range of internal users, such as store employees. These systems may support multiple vendors or programs, making access pathways broader and more difficult to control.
Gift card fraud combines stealth, speed and scalability, especially when paired with access to cloud environments where issuance workflows reside. To exploit these systems, the threat actors need access to internal documentation and communications. They can secure this by stealing credentials and maintaining a quiet, persistent presence within Microsoft 365 environments of targeted organizations that provide gift card services.
In the campaign we observed, the attackers made repeated access attempts against multiple gift‑card issuance applications. They tried to issue high‑value cards across different programs in order to monetize them, and possibly to use the cards as collateral in money-laundering schemes — effectively turning digital theft into untraceable cash or short-term loans. These operations were staged in a way that minimizes logging and forensic traces, reducing the chance of rapid detection.
Highly Targeted and Tailored Attacks
The threat actors behind the Jingle Thief campaign invest heavily in reconnaissance before launching attacks. They gather intelligence on each target, including branding, login portals, email templates and domain naming conventions. This allows them to craft highly convincing phishing content that appears authentic to both users and security tools.
Phishing URLs often include the organization’s name, a trusted third-party tool or software, and landing pages that closely mimic legitimate login screens. This highly customized social engineering approach increases the likelihood of compromise and highlights the actors’ use of sophisticated techniques.
Figure 2 shows a credential phishing page crafted by the threat actors to impersonate a legitimate Microsoft 365 login portal, tailored to the victim organization’s branding.

Figure 2. Fake Microsoft 365 login page tailored to the target organization. Initial Access: Phishing and Smishing for Cloud Credentials
The threat actors behind the Jingle Thief campaign typically begin their operations with tailored phishing or SMS-based smishing attacks. These messages lure victims to counterfeit Microsoft 365 login portals that mimic legitimate sign-in pages. Some lures impersonate nonprofits or non-governmental organizations (NGOs), likely to give the appearance of credibility and increase victim engagement.
Notably, many messages are delivered using self-hosted PHP mailer scripts, often sent from compromised or hijacked WordPress servers, which obscure the attackers’ origin and improve delivery.
The threat actors also employ deceptive URL formatting, such as: https://organization[.]com@malicious.cl[/]workspace
While the URL above appears to point to the legitimate organization’s domain (organization[.]com), browsers interpret everything before the @ as user credentials, and actually navigate to the domain after it (malicious.cl). This tactic helps disguise the true destination of the link and increases the likelihood of victims clicking.
After harvesting credentials in the campaign that we observed, the attackers authenticated to Microsoft 365 directly and began navigating the environment, with no malware required. Figure 3 shows a smishing attempt used to harvest credentials, captured from a malicious PHP email send log from the attackers’ infrastructure. The message originated from a Moroccan IP address, and was sent to a Verizon SMS gateway (vtext.com).
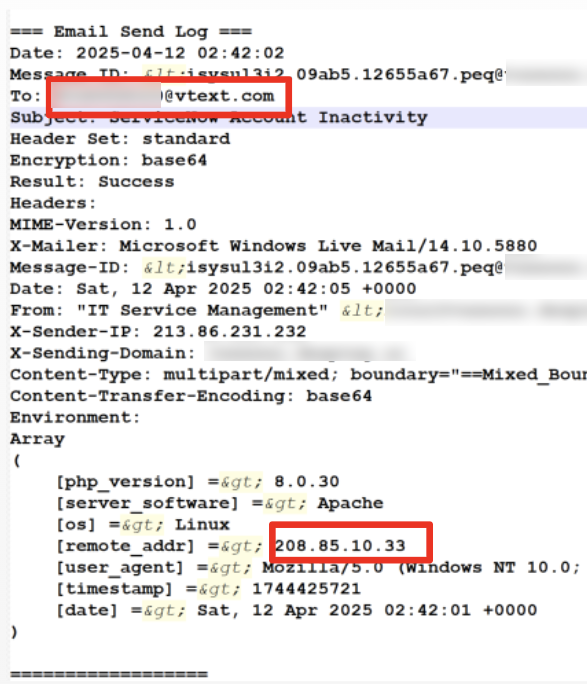
Figure 3. Credential phishing via smishing, logged from attackers’ infrastructure. Cloud Reconnaissance: Mining SharePoint and OneDrive for Gift Card Intel
After initial access, the attackers behind Jingle Thief perform extensive reconnaissance within the Microsoft 365 environment, particularly focusing on SharePoint and OneDrive. These services frequently contain internal documentation related to business operations, financial processes and IT workflows.
The threat actors search for:
- Gift card issuance workflows
- Ticketing system exports or instructions
- VPN configuration and access guides
- Spreadsheets or internal tools used to issue or track gift cards
- Organizational virtual machines, Citrix environments
Figure 4 shows SharePoint files accessed by the threat actors after account compromise, revealing their focus on internal documentation tied to gift card workflows and remote access infrastructure.

Figure 4. Internal SharePoint files accessed by Jingle Thief post-compromise. Rather than escalating privileges, the threat actors build situational awareness by accessing readily available data on compromised users. This discreet approach helps evade detection while laying the groundwork for future fraud.
Internal Phishing for Lateral Moves
Instead of deploying malware or post-exploitation frameworks, Jingle Thief relies on internal phishing to expand their foothold within target environments. In an attempted attack against one of our customers, after compromising a user’s Microsoft 365 account, the attackers sent phishing emails from the legitimate account to personnel inside the same organization. These messages mimicked IT service notifications or ticketing updates, often leveraging information gathered from internal documentation or previous communications to appear legitimate.
Common lures:
- Fake ServiceNow alerts: “INCIDENT REQ07672026 Has been completed”
- IT access notifications: “ServiceNow Account Inactivity Notice”
- Generic approval prompts: “Incident pending your review”
These emails link to fake login portals branded with the organization’s identity, leveraging internal trust to evade suspicion and spread laterally.
Figure 5 shows an internal phishing email sent from a compromised account, spoofing a ServiceNow inactivity notice to trick users into entering credentials.
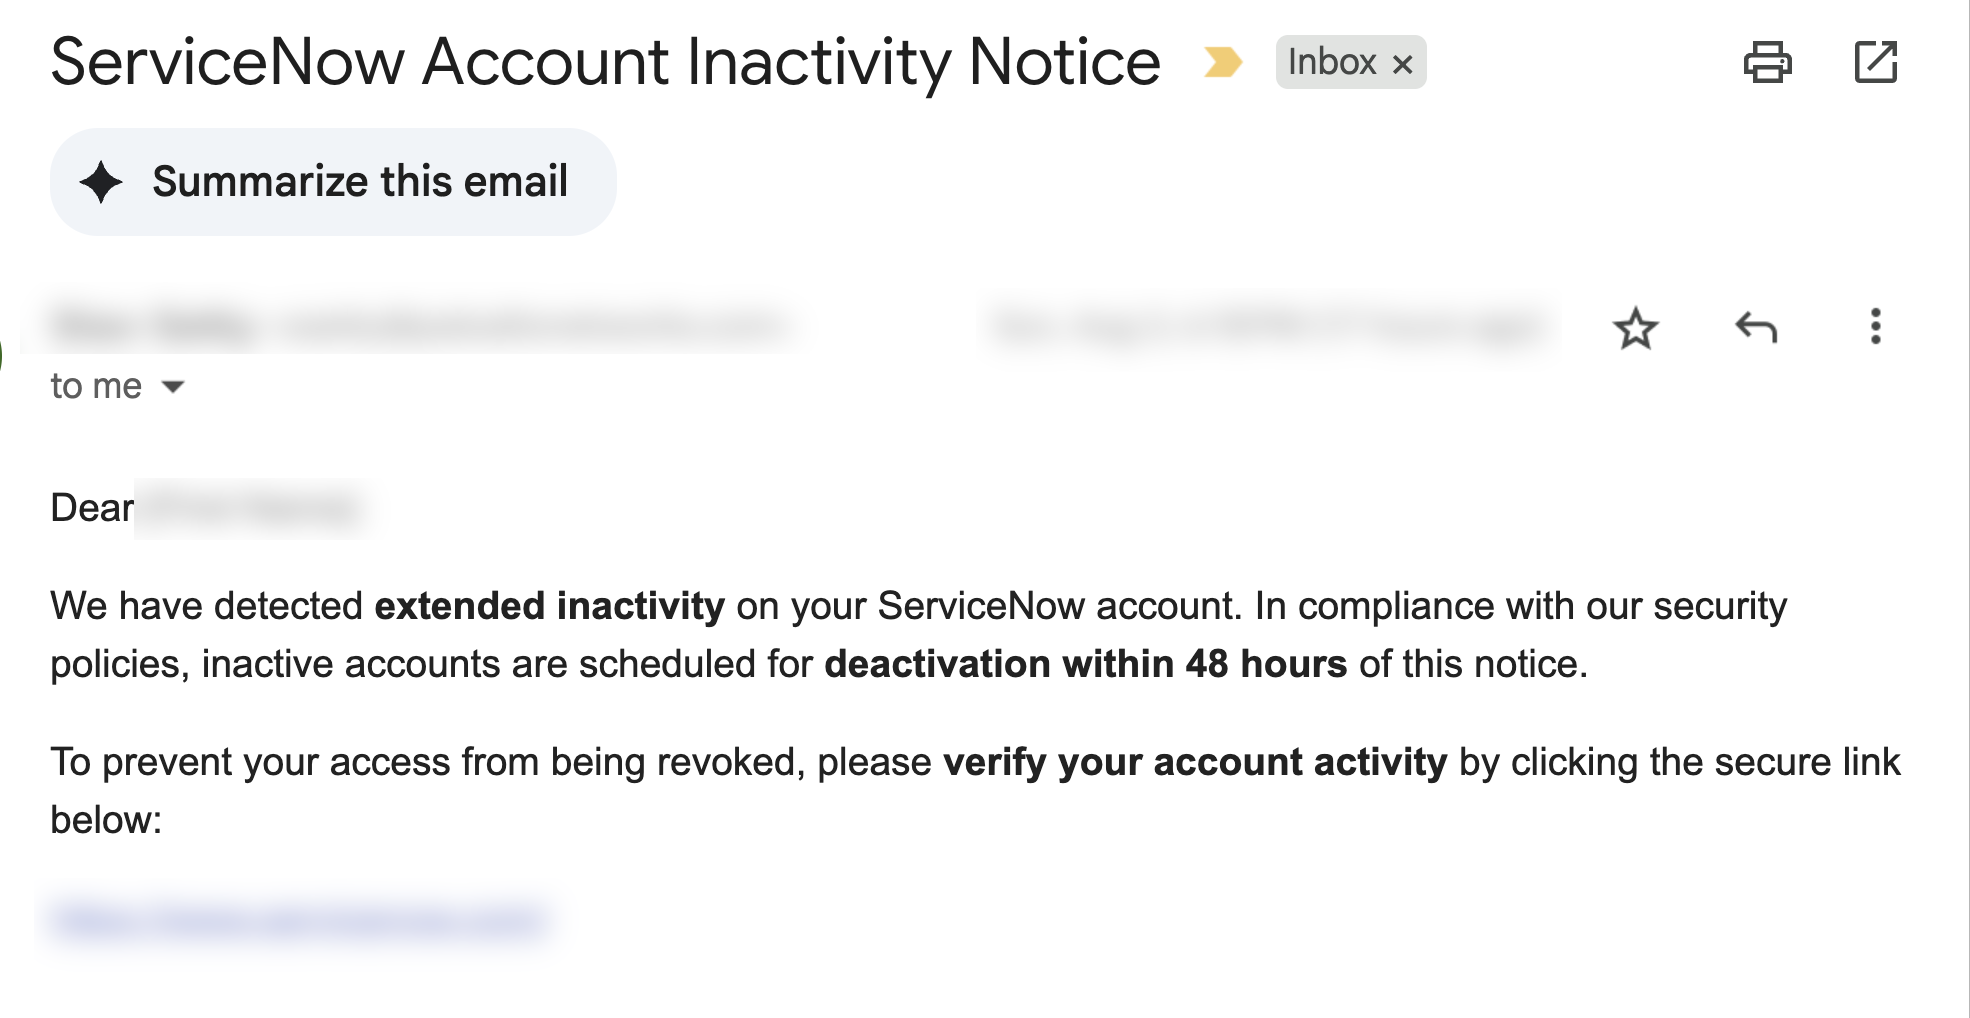
Figure 5. Internal phishing email mimicking a ServiceNow notification. Ruling the Inbox for Silent Email Exfiltration
To passively monitor internal communications, the attackers responsible for the Jingle Thief campaign often create inbox rules to automatically forward emails to attacker-controlled addresses.
They monitor:
- Gift card approvals
- Financial workflows
- IT ticketing or account changes
This approach reduces the need for active attacker interaction and helps maintain stealth. Figure 6 shows an alert flagging the creation of a malicious inbox forwarding rule, which is one of the stealth tactics employed by these threat actors to monitor internal communications.
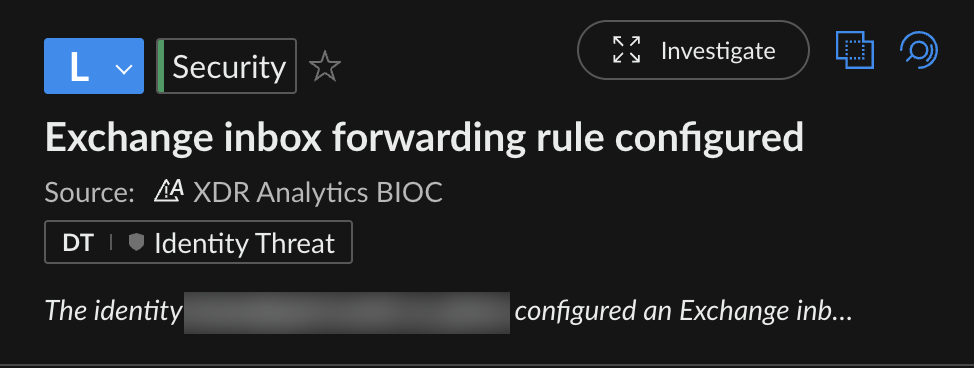
Figure 6. Cortex XDR alert showing automatic email forwarding rule set by threat actors. Stealthy Email Activity: Hiding in Plain Sight
To cover their tracks, the attackers actively manage mailbox folders:
- Moving sent phishing emails immediately from Sent Items to Deleted Items
- Moving replies from users from Inbox to Deleted Items
This ensures that victims won’t see the phishing messages or responses, delaying discovery by both victims and defenders.
The Exchange audit logs in Figure 7 show the attackers moving phishing email replies from the Inbox folder to the Deleted Items folder.
![Screenshot of an email inbox displaying multiple messages with the subject 'Automatic reply: INCIDENT [Set of numbers] has been completed', all from the sender 'MoveToDeclassifiedItems' and located in the 'Inbox' folder.](https://afnnews.qaasid.com/wp-content/uploads/2025/10/word-image-280966-161503-7.png)
Figure 7. Items moved from Inbox to Deleted Items. Dominating Rogue Devices for Persistence
Most of the intrusions we observed in the Jingle Thief campaign relied on stolen credentials or session tokens for temporary access. However, the actors also demonstrated techniques for establishing longer-term persistence within compromised environments.
In some intrusions, the threat actors took control of identity infrastructure by misusing legitimate user self-service and device enrollment mechanisms in Microsoft Entra ID. These tactics allowed them to maintain access even after passwords were reset or sessions were revoked.
Tactics include:
- Registering rogue authenticator apps to bypass MFA
- Resetting passwords via self-service flows
- Enrolling attacker-controlled devices in Entra ID
Figure 8 shows the user interface for registering a device in Microsoft Entra ID using the Authenticator app. The attackers misused this legitimate process to silently enroll rogue devices and maintain MFA-resistant access.

Figure 8. Device registration flow in Microsoft Entra ID. The ultimate goal of these varied tactics – phishing, inbox control, mail exfiltration and rogue device registration – is to obtain and monetize gift cards at scale.
Tracing Jingle Thief’s Moroccan Roots
The campaign activities that we observed almost exclusively originated from IP addresses geolocated in Morocco. Across incidents, Microsoft 365 logs showed recurring device fingerprints and login behaviors associated with these IP addresses. Unlike many actors who hide behind VPNs, these threat actors often made no attempt to obscure their origin, and only sometimes used Mysterium VPN when accessing compromised accounts.
Autonomous System Number (ASN) metadata from the connections also consistently matched Moroccan telecommunications providers, including:
- MT-MPLS
- ASMedi
- MAROCCONNECT
In addition to IP and ASN infrastructure, Jingle Thief reuses distinctive domain and URL structures across campaigns. These recurring patterns in domain naming and infrastructure further support attribution to a Morocco-based threat group.
Conclusion
The Jingle Thief campaign demonstrates a clear focus on major retailers’ gift-card issuance systems. The attackers targeted multiple issuance applications to generate high‑value cards, likely for resale on gray markets, or as fungible assets in money‑laundering chains. Gift-card systems are often under‑monitored and widely accessible internally, making them an attractive extension to identity‑based attacks: By compromising the right accounts, threat actors can issue and steal gift cards, while leaving almost no trace of their malicious operations.
The cluster of activity behind the Jingle Thief campaign overlaps with the activity of threat actors publicly tracked as Atlas Lion. This cluster — tracked by Unit 42 as CL-CRI-1032 — favors identity misuse over malware, and leverages trusted cloud services rather than endpoint compromise. Their campaigns highlight how attackers can operate entirely within cloud environments, abusing legitimate features for phishing, persistence and fraud.
By understanding the tactics used in the Jingle Thief campaign, defenders can better prioritize identity-based monitoring and adapt to the industry’s shift toward treating identity as the new security perimeter. Understanding user behavior, login patterns and identity misuse are increasingly essential for early detection and response.
Palo Alto Networks customers are better protected from this activity with the new Cortex Advanced Email Security module, as well as Cortex UEBA and ITDR.
If you think you may have been compromised or have an urgent matter, get in touch with the Unit 42 Incident Response team or call:
- North America: Toll Free: +1 (866) 486-4842 (866.4.UNIT42)
- UK: +44.20.3743.3660
- Europe and Middle East: +31.20.299.3130
- Asia: +65.6983.8730
- Japan: +81.50.1790.0200
- Australia: +61.2.4062.7950
- India: 00080005045107
Palo Alto Networks has shared these findings with our fellow Cyber Threat Alliance (CTA) members. CTA members use this intelligence to rapidly deploy protections to their customers and to systematically disrupt malicious cyber actors. Learn more about the Cyber Threat Alliance.
Indicators of Compromise
Moroccan Infrastructure (Attribution Signal)
- 105.156.109[.]227
- 105.156.234[.]139
- 105.157.86[.]136
- 105.158.226[.]49
- 105.158.237[.]165
- 160.176.128[.]242
- 160.178.201[.]89
- 160.179.102[.]157
- 196.64.165[.]160
- 196.65.139[.]51
- 196.65.146[.]114
- 196.65.172[.]48
- 196.65.237[.]97
- 196.74.125[.]243
- 196.74.183[.]81
- 196.77.47[.]232
- 196.89.141[.]80
- 41.141.201[.]19
- 41.250.180[.]114
- 41.250.190[.]104
Associated ASN Organizations (Geolocated to Morocco)
- MT-MPLS
- ASMedi
- MAROCCONNECT
U.S. Infrastructure (Potential Proxy or Compromised Hosts)
- 70.187.192[.]236
- 72.49.91[.]23
Phishing URL Patterns
- hxxps://*.com.ng/*[brand-name].com/home/
- hxxps://*.[brand-name].servicenow.*/*access
- hxxps://[brand-name].com@*.*/portal/
- hxxps://[brand-name].com@*.*/workspace
- hxxps://*/home
- hxxps://*/workspace/home
Additional Resources
Cortex XDR/XSIAM Alerts on Jingle Thief Activity
Table 1 shows Cortex alerts for this activity, using Identity Analytics including behavioral indicators of compromise (BIOC) and the ITDR module.
Alert Name Alert Source MITRE ATT&CK Technique Exchange inbox forwarding rule configured XDR Analytics BIOC, Identity Threat Module (ITDR) Hide Artifacts: Email Hiding Rules (T1564.008) User moved Exchange sent messages to deleted items XDR Analytics, Identity Threat Module (ITDR) Indicator Removal: Clear Mailbox Data (T1070.008) First connection from a country in organization XDR Analytics BIOC, Identity Analytics Compromise Accounts (T1586) First SSO access from ASN in organization XDR Analytics BIOC, Identity Analytics Valid Accounts: Domain Accounts (T1078.002) Impossible Traveler – SSO XDR Analytics, Identity Analytics Compromise Accounts (T1586) A user connected from a new country XDR Analytics BIOC, Identity Analytics Compromise Accounts (T1586) First SSO access from ASN for user XDR Analytics BIOC, Identity Analytics Valid Accounts: Domain Accounts (T1078.002) A user connected to a VPN from a new country XDR Analytics BIOC, Identity Analytics Compromise Accounts (T1586) VPN access with an abnormal operating system XDR Analytics BIOC, Identity Analytics Valid Accounts: Domain Accounts (T1078.002) First VPN access from ASN in organization XDR Analytics BIOC, Identity Analytics Valid Accounts: Domain Accounts (T1078.002) First SSO Resource Access in the Organization XDR Analytics BIOC, Identity Analytics Valid Accounts: Domain Accounts (T1078.002) Suspicious SSO access from ASN XDR Analytics BIOC, Identity Analytics Valid Accounts: Domain Accounts (T1078.002) A possible risky login to Azure XDR Analytics BIOC, Identity Analytics Compromise Accounts (T1586) User attempted to connect from a suspicious country XDR Analytics BIOC, Identity Analytics Compromise Accounts (T1586) SSO with new operating system XDR Analytics BIOC, Identity Analytics Valid Accounts: Domain Accounts (T1078.002) Massive file downloads from SaaS service XDR Analytics, Identity Threat Module (ITDR) Data from Cloud Storage (T1530) Table 1. Cortex XDR/XSIAM alerts on Jingle Thief campaign activity.
Continue Reading