Spatial expression and cell segmentation
To identify the distinct cell clusters and expression domains involved in early wheat spike development, we analyzed the expression of 99 genes simultaneously (Additional file 2: Table S1) by smFISH at three early stages of spike development (W1.5, W2.5, and W3.5 as defined by the Waddington scale [19]). W1.5 marks the initial transition of the shoot apical meristem (SAM) to the reproductive stage (Fig. 1A). W2.5 is defined as the late double ridge stage before glume primordia initiation (Fig. 1B and S1A), and W3.5 as the floret primordia stage (Fig. 1C and S1B). At W3.5, the inflorescence meristem (IM) begins its transition to a terminal spikelet (IM → TS), and the most advanced spikelet meristems (SMs) at the center of the spike initiate floret meristems (FMs, Figs. 1C and S1B).
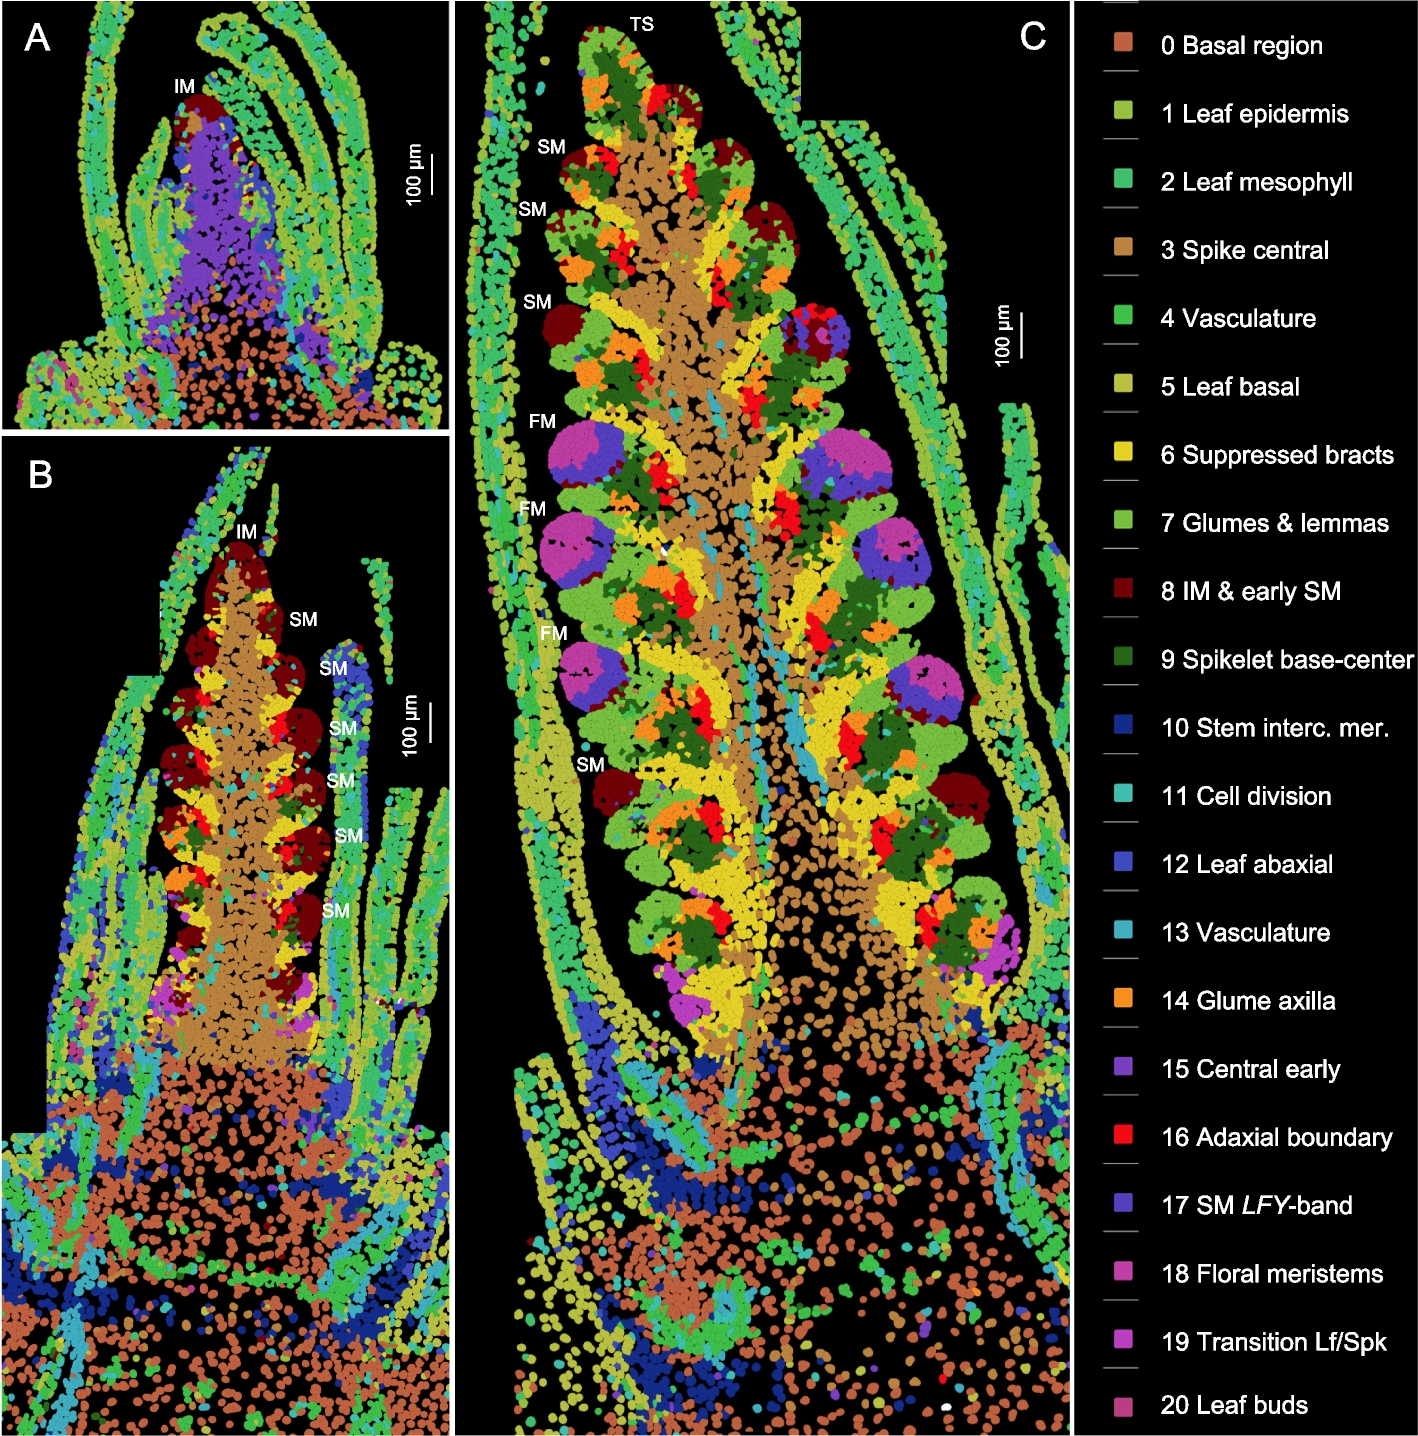
Cell clusters based on the expression of 99 genes analyzed by smFISH at three stages of wheat spike development. Cell clusters were generated from the three sections shown in this figure and replicate sections presented in Additional file 1: Fig. S2. Identical colors represent the same clusters across the six sections. A W1.5: initial transition from the vegetative to the reproductive stage (section C1-1). B W2.5: late double ridge stage (section B1-3). C W3.5: floret primordia stage (section A1-2). Scale bars = 100 μm. A detailed description of the cell clusters, cell counts, and preferentially expressed genes in each cluster is available in Additional file 2: Table S2. IM = inflorescence meristem, SM = spikelet meristem, FM = floral meristem, TS = terminal spikelet
We analyzed two sections from each developmental stage (Figs. 1, S2) using the cell segmentation program QuPath [20] and identified a total of 48,225 cells. In the same sections, cell walls were visualized with calcofluor-white (Figs. S3, S4). Based on the expression of 99 genes (Additional file 2: Table S1), these cells were grouped into 21 clusters, represented by consistent colors across all three developmental stages and replications (Figs. 1, S2). The individual cell clusters are presented separately in Additional file 1: Fig. S5 and can be also visualized, together with heatmaps of the 99 genes, at https://dubcovskylab.ucdavis.edu/JD99-wheat-spike-smFISH.
We characterized 7624 cells at W1.5, 16,400 at W2.5, and 24,210 at W3.5 (Fig. 1 and S2), showing a clear increase in cell number during spike development. These cells also exhibited increasing differentiation, with 14 clusters at W1.5, 19 at W2.5, and 21 at W3.5 (Fig. 1 and S2, Additional file 2: Table S2). At the two later stages, cell clusters formed at the SMs and beneath them were consistent across spikelets within the same spike and between sections in Figs. 1 and S2, demonstrating good reproducibility. The gene expression profiles obtained with Molecular Cartography also showed good reproducibility with previous in situ hybridization results (Additional file 1: Fig. S6) and recently published wheat spatial transcriptomics results generated using MERFISH [21] (Additional file 1: Fig. S7).
Annotation of the cell clusters and their preferentially expressed genes are summarized in Additional file 2: Table S2, whereas the correlations among cell clusters are presented in Additional file 2: Table S3. The five cell clusters detected in the leaves (c1, c2, c5, c12, and c20) were highly correlated (R ≥ 0.78, Additional file 2: Table S3) and are not discussed further in this study. To organize the description of the spike clusters and their changes during spike development, we separated the developing spike into five regions: the basal region below the spike, the spike central region, the region below the SMs, the SMs, and IM.
The basal region below the spike
The basal region below the spike consists of cells that will later differentiate into nodes and internodes, forming the stem and contributing to important agronomic traits such as plant height and stem strength. This region is primarily composed of cells grouped in cluster c0, which are located below the epidermis and outside the vascular tissue and are referred to hereafter as ground tissue. At W2.5 and W3.5, this basal region is interrupted by alternating bands of cells from clusters c4 (vasculature) and c10 (stem intercalary meristem, Figs. 1, S2, S5).
In longitudinal sections stained with calcofluor-white at W2.5 and W3.5 (Figs. S3, S4), two alternating zones are visible at the basal region: one with shorter cells likely corresponding to the nodes, and the other with longer cells likely corresponding to the internodes of the future stem. Enriched expression of the procambial marker LAX4 [22] and the phloem marker APL [23] was observed in the smaller cells, supporting their association with future nodes (Fig. 2A). These cells, together with those expressing the vascular genes in the leaf and spike vascular tissues, were all included in cluster c4 (Fig. 2B). Based on the location of c4 cells in the nodes and the orientation of the vascular bundles, we hypothesize that these cells may interconnect the parallel vascular bundles of the internodes.
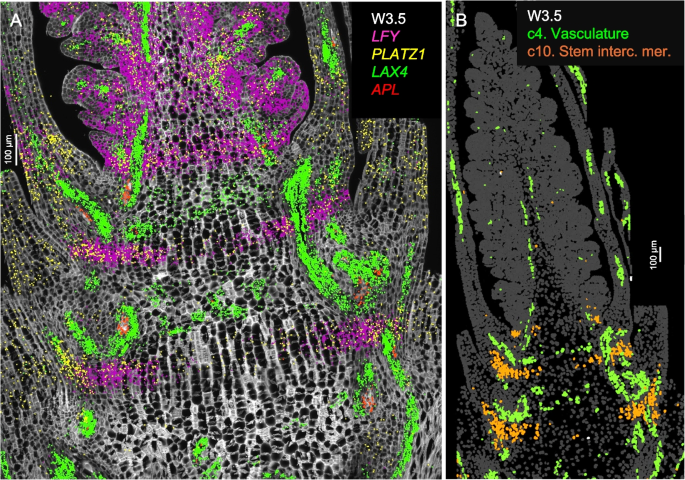
Single-molecule fluorescence in situ hybridization (smFISH) characterization of the basal region below the spike at W3.5. Cell walls were stained with calcofluor-white. A Vasculature patterning genes LAX4 (green) and APL (red) are concentrated in the region with shorter cells (likely future nodes). LFY (purple) and PLATZ1 (yellow) mark a band in the region with longer cells (likely future internodes). B Cell segmentation with highlighted clusters c4 in green (vascular tissue) and c10 in orange (stem intercalary meristem). Scale bar = 100 μm
Cells classified as cluster c10 (Fig. 2B) appeared as incomplete bands in the future internode regions at W2.5 and W3.5 (Figs. 1, S5). In the three-dimensional space, c10 cells may form a transversal disc across the stem located at the point where the abaxial base of the leaves joins the stem. These c10 cells were characterized by the differential expression of LFY, PLATZ1 (Fig. 2A), NAL1, ULT1, and SVP1 (Additional file 1: Fig. S8, Additional file 2: Table S2). Previous studies have demonstrated that loss-of-function mutations in wheat PLATZ1 [24] or SVP1 [7] significantly reduced plant height and that overexpression of these genes partially restored normal plant height. The functional validation of the roles of PLATZ1 and SVP1 in stem development suggested that cluster c10 may correspond to the stem intercalary meristem, a zone at the base of grass internodes that contributes new cells to the elongating internodes [25]. This hypothesis was further supported by our finding that LFY also plays an important role in wheat stem development.
Using the lfy-null mutant developed in a previous study [13], we showed here that the mutant had no significant effect on stem length, but resulted in significantly wider nodes (22.3% ± 1.8%) and internodes (11.5% ± 2.0%). Moreover, the mutants produced more solid stems, showing a 62% ± 17% reduction of the diameter of the hollow central region relative to the WT (Additional file 1: Fig. S9, Additional file 2: Table S4). The Short and Solid Culm (ssc) rice mutant is a LFY allele with a D16N amino acid polymorphism and a 3-fold higher transcript levels than the wildtype, which has been associated with reduced stem length and diameter [26]. These results revealed a shared role of LFY in stem development between wheat and rice and are a good example of the value of the smFISH data to generate functional hypothesis.
Since the gibberellic acid (GA) hormone plays a critical role in stem elongation, we examined the spatial distribution of two genes involved in GA biosynthesis (GA20ox1 and GA20ox2) and one involved in GA degradation (GA2ox1). At W2.5 and W3.5, the two GA biosynthetic genes were enriched in c0 at the basal region below the spike (Additional file 1: Fig. S10B-C, Additional file 2: Table S2). Loss-of-function mutations in either GA20ox1 or GA20ox2 reduced the levels of bioactive GA1 and GA4, resulting in shorter plants than the wildtype [27]. These findings support a positive role of these genes in wheat stem elongation, consistent with their spatial expression adjacent to the stem intercalary meristem region (c10).
The catabolic gene GA2ox1 showed higher levels of expression in the central region of the developing spikes at W1.5 (cluster c15) than at later stages (cluster c3, Additional file 1: Fig. S10A, Additional file 2: Table S2). We speculate that the elevated GA2ox1 expression at early spike development prevents premature cell elongation and induction of SOC1 and LFY, which are associated with increased GA levels [28]. At W2.5 and W3.5, GA2ox1 expression was restricted to the periphery of the region enriched in GA biosynthetic genes, possibly forming a ring of reduced GA abundance around the elongating cells. The negative role of GA2ox1 in stem elongation has been functionally validated in rice plants by both over-expression and ectopic expression of GA2ox1 under the OsGA3ox2 promoter [29]. We hypothesize that the spatial distribution of GA metabolic and catabolic genes described in this study may play an important role in normal wheat stem elongation.
The transition zone between leaf and spike
At W2.5 and W3.5, a group of cells within cluster c19 was detected in the transition region between leaves and spike (Additional file 1: Fig. S11A-B). The genes preferentially expressed in cluster c19 include the SPL transcription factors SPL2, SPL14, and SPL17 (Additional file 1: Fig. S11C-D), the TCP transcription factors (TEOSINTE BRANCHED1/CYCLOIDEA/PROLIFERATING CELL FACTOR) TB1 and TB2 (Additional file 1: Fig. S11E-F), and the MADS-box genes FUL2 and SOC1-1 (Additional file 2: Table S2). Several of these genes have previously been associated with the regulation of spike architecture.
Mutations in the SPL14 and SPL17 genes result in the formation of ectopic bracts at the base of the inflorescence in rice [30], maize [5], and hexaploid wheat [4]. Based on the basal location of these bracts, we hypothesize that the preferential expression of SPL14 and SPL17 in cluster c19 may contribute to bract repression in the transition zone. TSH4, the maize ortholog of SPL17 and its close paralogs UB2 and UB3 (SPL14) work together to target genes responsible for axillary meristem suppression such as TB1 and auxin response regulators [31].
In rice, SPL14 is a direct regulator of TB1 [32], which in our study was also preferentially expressed in cluster c19. TB1 reduces lateral branching, and mutants of this gene in maize [33] and rice [34] show increased tillering. TB1 mutants in barley and wheat also show increased tillering and produce additional lateral spikelets in barley [35] and paired spikelets in wheat [36, 37]. These findings indicate a conserved role of TB1 in the regulation of branching.
SQUAMOSA genes are direct targets of the SPL proteins [38, 39] and combined loss-of-function mutations in the wheat SQUAMOSA genes VRN1 and FUL2 result in de-repression of the lower ridge, leading to bract outgrowth below the spikelets at the base of the spike [3]. Individual vrn1 or ful2 mutants show no bract outgrowth, demonstrating that FUL2 and VRN1 play redundant roles in bract repression.
Based on the physical location of the c19 cells and the function of the genes preferentially expressed in this region (Additional file 2: Table S2), we hypothesize that the c19 cells contribute to the transition between the proximal region (where leaf meristems exhibit rapid development and axillary meristems undergo a temporary arrest) and the distal region (where the subtending bracts are suppressed and upper ridges rapidly develop into spikelet meristems).
The central region of the spike
The ground tissue cells in the central region of developing spikes were primarily assigned to cluster c15 at W1.5 and cluster c3 at both W2.5 and W3.5 (Figs. 1, S5), which were highly correlated with each other (R = 0.70). These two clusters also showed strong correlations with the ground tissue at the adjacent basal region beneath the spike (cluster c0, Additional file 2: Table S3). Cells from cluster c15 showed stronger correlations with the leaf mesophyll (R = 0.74) than cluster c3 (R = 0.46, Additional file 2: Table S3), suggesting progressive differentiation of the ground tissue at the center of the spike. Several genes were preferentially expressed at the spike central region across all three developmental stages, including AP3, bZIPC4 (Additional file 1: Fig. S12A-C), IDD4 and OSH1 (synonymous with KNOX3, Additional file 1: Fig. S12D-F). The homeobox gene OSH1 was expressed at the base and center of the spikelets, but not in developing glumes and lemmas. This expression pattern resembles that of its orthologs in maize and rice [40].
In Fig. 3, we present the expression profiles of four vascular markers: the auxin influx carrier LAX4 [41], the phloem marker APL [23], and the duplicated auxin efflux carriers PIN1a and PIN1b [22, 42] (Fig. 3). In Brachypodium, PIN1b plays a role in sink-finding and connecting new primordia to existing vasculature, whereas PIN1a forms narrower canals than PIN1b and is likely involved in vein patterning [42]. A similar pattern was observed in wheat, where PIN1b was expressed in a broader area than PIN1a (Fig. 3).
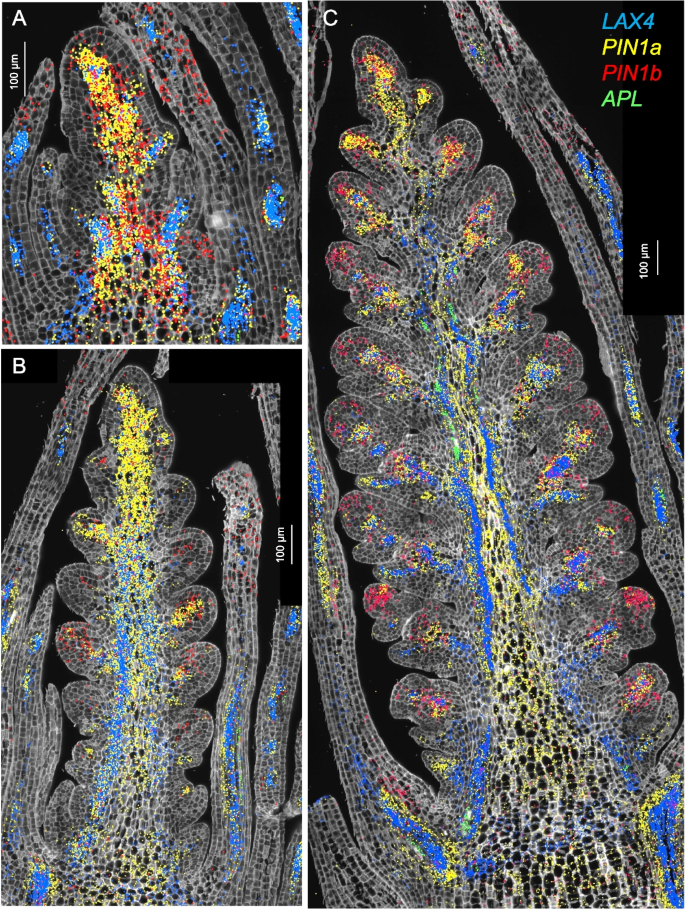
Single-molecule fluorescence in situ hybridization characterization of the spike central region (cluster c3). Spike central region (cluster c3). A W1.5, B W2.5, C W3.5. In all three panels, LAX4 hybridization signal is shown in blue, APL in green, PIN1a in yellow, and PIN1b in red. Cell walls are stained with calcofluor-white
PIN1a and PIN1b were preferentially expressed in clusters c4 and c13 (Additional file 2: Table S2, Additional file 1: Fig. S13A), which were annotated as vasculature clusters. APL was among the preferentially expressed genes in both c4 and c13 (Additional file 2: Table S2) but most of its expression was outside these clusters (Additional file 1: Fig. S13B). The expression of CEN5 overlapped well with c13 (Additional file 1: Fig. S13B) whereas the expression of LAX4 overlapped better with c4 (Additional file 1: Fig. S13C). PIN1a showed extensive overlap with both clusters (Additional file 1: Fig. S13D). The early accumulation of PIN1a and LAX4 (= ZmLAX2) in maize leaves marked the initial procambium specification [22], suggesting that c13 and c4 represent early stages of vascular development.
In maize, LAX4 and PIN1a have antagonistic functions and are frequently co-expressed in pro-vascular cells [22, 41], an overlap that was also apparent in wheat spikes at all three developmental stages (Fig. 3). The phloem marker APL was detected at developing vascular tissue of leaves at W1.5 and W2.5 (Fig. 3A,B), and in the central region of the spike at W3.5 (Fig. 3A).
In summary, an important function of the c4 and c13 vascular cells in the central region of the spike is to provide an efficient vascular system that transports water and nutrients to the developing spikelets. The central c3 cells are green from early developmental stages, suggesting that they contribute photosynthetic products to the developing spikes and also provide structural support to flowers and grains.
Region proximal to the spikelet meristem (SM)
At W2.5 (Fig. 4A), cortex cells proximal to the spikelet meristem were primarily classified into clusters c6 (suppressed bract), c9 (central SM basal region), and c16 (adaxial boundary). These clusters remained evident at W3.5, with the addition of clusters c7 (glume and lemma) and c14 (glume axilla). A few cells from clusters c7 and c14 were also detected at W2.5 (Fig. 4A).
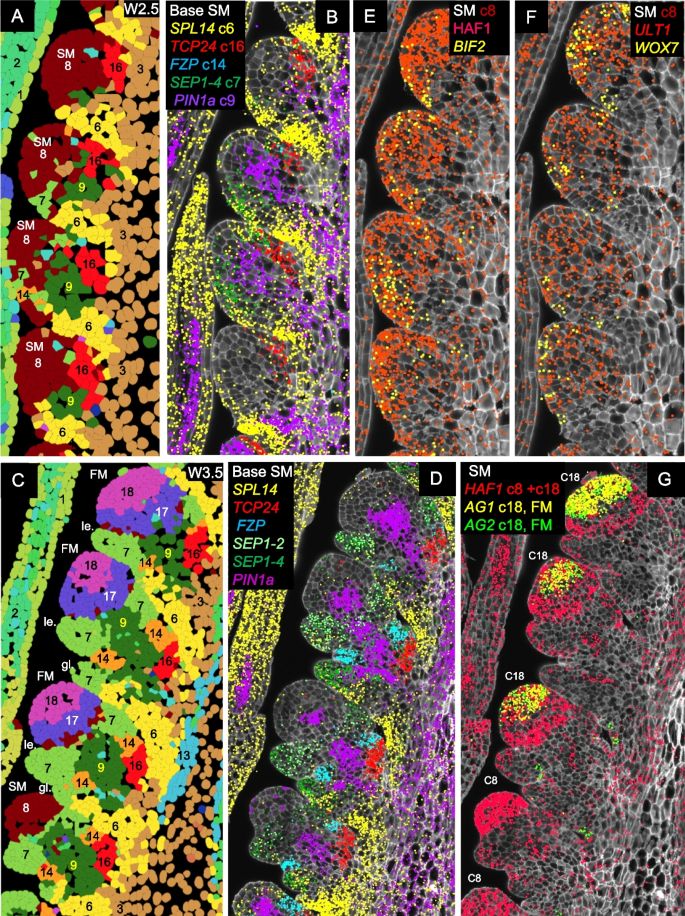
Expression profiles of genes differentially expressed during spikelet development. A, B, E, F W2.5 (late double ridge stage). C, D, G W3.5 (floret primordia stage). A, C Cell segmentation and clustering. B, D Genes differentially expressed at the base of the SM. E–G Genes differentially expressed in the SMs. In G, the more basal SMs are at an earlier stage (cluster c8) than the central spikelets, which have already transitioned to the floret development stage (FM, cluster c18) and are already expressing floral homeotic genes AG1 and AG2. SEP1-4 marks the developing glume (stronger) and lemma, SEP1-2 the developing lemma, PIN1a the developing vasculature, SPL14 the suppressed bract, FZP the glume axilla, and TCP24 the adaxial boundary. Complete spike images showing expression of these genes are presented in Figs. S15 and S18. SM = spikelet meristem, FM = floret meristem, le. = lemma, gl. = glume
Cluster c6 “suppressed bract”
Cluster c6 includes the suppressed bract region (Additional file 1: Fig. S14). This cluster showed a relatively high correlation with cluster c19 in the transition zone (R = 0.71, Additional file 1: Fig. S14 and Additional file 2: Table S3), which was also associated with leaf ridge repression. Both clusters showed preferential expression of SPL14 (Additional file 1: Fig. S14A-B), FUL2, and LFY (Additional file 2: Table S2), but cluster c6 differed from cluster c19 by its preferential expression of SPL13 (Additional file 1: Fig. S14C-D) and lower expression of TB1 and TB2. In both c6 and c19 clusters, preferential expression of SPL genes was associated with higher VRN1 and FUL2 expression (Additional file 1: Fig. S14E-F). Combined vrn1 ful2 mutations resulted in bract outgrowth at the basal spikelets (Additional file 1: Fig. S14G), suggesting a role of c6 and c19 cells in bract repression [3].
Cluster c9 “Spikelet base-center”
Cluster c9 is located at the center of the region proximal to the SM (Fig. 4) and showed high correlations (R = 0.75–0.80) with the surrounding clusters c3, c7, c8, c14, and c16 (Additional file 2: Table S3). This central cluster was enriched in PIN1a (Fig. 4A–D), PIN1b, and LAX4 (Additional file 2: Table S2), suggesting a role in vascular development and the transport of water and nutrients to developing spikelets. Additional genes preferentially expressed in c9 included SOC1-1, SEP1-4, OSH1, and TB1.
Cluster c7 “Glume and lemma”
The glume and lemma primordia, which became visible at W3.5, were both included in cluster c7. Both organs showed preferential expression of AP2L5 (Additional file 1: Fig. S6B), FUL2, and VRN1 (Additional file 1: Fig. S14E-F) and reduced expression of OSH1 (Additional file 1: Fig. S12E) and could be differentiated by the preferential expression of SEP1-2 in lemmas and SEP1-4 stronger expression in glumes than lemmas (Figs. 4C,D, S15B). The latter result is consistent with previous reports in rice [43]. Cluster c7 showed the highest correlation with the early meristem cluster c8 (R = 0.81) from which glumes and lemmas originate, and also relatively high correlations with the leaf cell clusters (R = 0.63–0.75, Additional file 2: Table S3). This latter result supports the hypothesis that glumes and lemmas are modified leaves [44]. Similar to leaves, glumes and lemmas later turn green, contributing photosynthetic products to flowers and developing grains, in addition to additional protection to the reproductive organs.
Cluster c16 “Adaxial boundary”
This cluster was located adaxial to c9 (Figs. 4A–D, S15) and was defined by the differential expression of the transcription factor TCP24 (Additional file 1: Fig. S15, Additional file 2: Table S2). TCP24 and its closest paralogs TCP22, TB1, and TB2 belong to the CYC/TB1 subclass of TCP transcription factors (Additional file 1: Fig. S11E-F) and can form homo and heterodimers [45]. In the maize male inflorescence [46] and the Brachypodium distachyon spike [47], the ortholog of TCP24, BRANCH ANGLE DEFECTIVE 1 (BAD1), is preferentially expressed in the pulvinus and affects branch or spikelet angle, respectively. The pulvinus is located at the axilla of the tassel branches in maize and at the spikelet axilla in Brachypodium but is absent in the Triticeae species. Loss-of-function mutations of TCP24 in rice (= OsTB2 = RETARTDED PALEA 1) are associated with mild reductions in the size of the palea with no other obvious effects on inflorescence or flower development [48]. By contrast, loss-of-function mutations in the barley ortholog HvTB2 (also known as COMPOSITUM1) result in spikes with branches in the basal region [45], suggesting functional differentiation among grass species.
Cluster c14 “Glume axilla”
Cluster c14 is defined by the expression of FRIZZY PANICLE (FZP, Additional file 1: Fig. S15B, Additional file 2: Table S2), which is expressed at the axillae of the developing glumes (Fig. 4C,D). A similar localization has been observed in previous in situ hybridization studies in rice and maize [49, 50]. In spike longitudinal sections, c14 cells frequently appear as two small cell clusters flanking c9, with the adaxial one adjacent to c16 (Figs. 4C,D, S15, S16). Cluster c14 also showed preferential expression of the homeobox domain gene WOX7 (Additional file 1: Fig. S16A) and the PINOID-like serine/threonine kinase BIF2 (Additional file 1: Fig. S16B), although these genes are also expressed outside of c14. Previous studies have shown that FZP plays an important role in the repression of the glumes’ axillary meristem. Natural or induced amino acid changes in FZP result in the formation of branches at the base of the spikes in “miracle wheat” (bh1 mutant) and barley (com2 mutant) [51, 52].
To characterize the function of FZP in tetraploid wheat, we generated loss-of-function mutations in both FZP homeologs by CRISPR (Additional file 1: Fig. S17). Eight independent T0 lines with mutations in both FZP homeologs showed spikelets replaced by dense arrays of nested glumes (Additional file 1: Fig. S17B and E). Dissection of these structures revealed new axes emerging from the axillae of the initial glumes, each producing multiple secondary glumes. The axillary meristems of these secondary glumes repeat the cycle but produce fewer and smaller tertiary glumes. The patterns repeat until the meristems were exhausted (Additional file 1: Fig. S17F). Poorly developed floral organs were occasionally observed among these recurrent glumes (Additional file 1: Fig. S17G). The rachilla continued its development but only vestigial florets were observed in its nodes (Additional file 1: Fig. S17H). A diagram describing the development of this structure is presented in Fig. S17I, and the dissection of a wildtype spikelet and the corresponding diagram in Additional file 1: Fig. S17J-K. In some distal nodes, we observed lemmas with longer awns subtending more normal floral organs. These results indicate that FZP is required to suppress the axillary meristems in the glumes to ensure normal floret development. Similar phenotypes have been described for fzp loss-of-function mutants in rice and maize [49, 50], suggesting a conserved function in grasses.
In summary, the different expression domains detected in the spikelet region proximal to the SM is consistent with recent grass inflorescence models proposing that the basal region of the grass spikelets is an important signaling center for spikelet development [53].
Spikelet meristem (SM) and floret meristem (FM) regions
At all three developmental stages, cells in the IM and early SMs were assigned to cluster c8. At W2.5, this cluster exhibited preferential expression of HAF1, BIF2 (Figs. 4E, S18A), ULT1, and WOX7 (Figs. 4F, S18C-D). HAF1, a C3HC4 RING domain-containing E3 ubiquitin ligase, has no reported role in inflorescence development [54, 55], but the other three genes are well-established regulators of meristem function. BIF2 regulates auxin transport and is required for axillary meristem initiation and lateral primordia development in maize and rice [56]. ULT1 encodes a SAND domain transcription factor that controls shoot and FM activity in Arabidopsis [57, 58], whereas WOX7 is a WUSCHEL-related homeobox gene that contributes to inflorescence architecture in rice [59]. Based on their physical location and preferential gene expression, we propose that c8 cells contribute to meristem function.
At W3.5, the more developed central spikelets showed the formation of floral meristems (Fig. S1B) that were assigned to cluster c18 (FM, Figs. 1, S2). This cluster was defined by the expression of floral homeotic genes SEP3-1, SEP3-2 (Additional file 1: Fig. S18E), PI1, AP3 (Additional file 1: Fig. S18F), AG1 and AG2 (Figs. 4G, S18G, Additional file 2: Table S2), strongly supporting a role in floral development. The SMs are not visible in the sections of the central spikelets (Fig. S1), either because the larger FMs displaced the adjacent SMs from the section plane or because the section was not perfectly centered (Additional file 1: Fig. S1E).
Cluster c18 also showed preferential expression of WAPO1, a gene encoding a protein that interacts with LFY (Additional file 1: Fig. S18H). Loss-of-function mutations in WAPO1 or LFY result in downregulation of floral homeotic genes and floral defects in wheat [13, 14] and other grasses [60,61,62].
The floral meristems in c18 are separated from the lemma primordia (c7) by a group of cells forming a distinct band assigned to cluster c17 (Figs. 1 and 4C). This cluster was defined by the preferential and high expression of LFY (Additional file 1: Fig. S18H, Additional file 2: Table S2). A previous study suggested that the overlap between the WAPO1 and LFY expression domains (Additional file 1: Fig. S18H) provides critical spatial information for correct flower development in wheat [13]. The dynamic changes in gene expression during spike development are described later.
Changes within the inflorescence meristem (IM) during the transition to a terminal spikelet (IM → TS) and SPL14 functional validation
In wheat, the rate of lateral meristem formation and/or the timing of IM transition to a terminal spikelet (IM → TS) determine SNS. Our previous studies showed that loss-of-function mutations in LFY or WAPO1 reduce the rate of SM formation and SNS [13]. The reductions in SNS were comparable in the single and combined lfy wapo1 mutants, suggesting that the LFY-WAPO1 protein complex is essential for establishing and/or maintaining a normal rate of SM generation. However, LFY and WAPO1 are co-expressed in the IM only during the earliest stages of spike development (W1.5), suggesting that the early presence of the LFY-WAPO1 protein complex may induce a persistent change in IM function [13].
Since changes in the timing of the IM → TS transition can also influence SNS, we focused on genes involved in the early stages of this transition. We were unable to identify marker genes that clearly distinguished IMs from early SMs (both grouped in cluster c8). Because spikelets are “small spikes”, SMs are also inflorescence meristem, making the identification of differential markers between IMs and early SMs more challenging. However, as SMs begin to differentiate into spikelets, an increasing number of genes become differentially expressed relative to the IM.
We manually delineated the apical meristem region and compared the hybridization density of the 99 genes in this region before the IM → TS (W2.5) and at the early stages of the transition (W3.5). These were within-gene comparisons and, therefore, were not influenced by probe hybridization efficiency. For each stage, we analyzed four sections (four biological replications for W2.5 and two for W3.5, each with two subsamples, see M&M). To verify that the selected W3.5 sections had already initiated the IM → TS transition, we confirmed the expression of FZP in the youngest lateral meristems (LM, Additional file 1: Fig. S19). The selected region encompassed both the terminal spike meristem (TM) and the two youngest LMs (henceforth, TM + 2LM). At W2.5 the TM corresponds to the IM and LMs to the SMs, whereas at W3.5 the TM corresponds to the SM of the terminal spikelet and the LMs the future glumes. Using this approach, we previously observed a significant decrease in LFY expression and a significant increase in FUL2 expression between W2.5 and W3.5 in the TM + 2LM region [13].
In this study, we identified 11 additional genes with significantly altered hybridization densities (spots/100 μm2) in the selected region between W2.5 and W3.5 (P < 0.05, Additional file 1: Fig. S20, Additional file 2: Table S5). Among them, SPL14 exhibited a highly significant decrease in hybridization density during the transition, (6.7-fold reduction, P = 0.0031, Figs. S19, S20, Additional file 2: Table S5). We also identified two additional MADS-box genes (SOC1-2 and SEP1-4), four bZIP transcription factors (bZIPC1, bZIPC3, FDL2, and FDL6), one bHLH transcription factor (BC1), one auxin efflux carrier (PIN1b), and one receptor-like kinase (CRN) involved in the CLV-WUS negative feedback loop (Additional file 1: Fig. S20) that were significantly upregulated during the transition. Several of these genes have been associated with inflorescence phenotypes. For example, mutations in bZIPC1 in wheat drastically reduce SNS [63], whereas mutations in the rice ortholog of SEP1-4 (OsMADS5) impact inflorescence branching [64].
To explore the phenotypic effect of reduced SPL14 expression during the IM → TS transition, we generated loss-of-function mutations in both SPL-A14 and SPL-B14 using CRISPR (Additional file 1: Fig. S21A-B). Plants with homozygous mutations for both homeologs showed a premature IM → TS transition and a 42% reduction in SNS (Additional file 1: Fig. S21C and E, Additional file 2: Table S6). These results suggest that SPL14 plays an important role in delaying the timing of the IM → TS transition in durum wheat. In addition, the spl14 mutant plants were 12 cm taller (Additional file 1: Fig. S21D and F), headed 2 days later (Additional file 1: Fig. S21G), and produced 2.5 more leaves than the wildtype (Additional file 1: Fig. S21H, Additional file 2: Table S6), indicating that SPL14 plays additional roles. Similar effects on SNS and heading time have been previously reported in spl14 CRISPR mutants in hexaploid wheat, and natural alleles have been identified with favorable effects on wheat grain yield [4]
Since SPL proteins directly regulate the expression of SQUAMOSA MADS-box genes, we hypothesize that the reduced SPL14 expression may be linked to the correlated increase in FUL2 and VRN1 expression in the IM observed during the IM → TS transition. Supporting this hypothesis, we previously showed that a mutation in a predicted SPL-binding site in the VRN1 promoter was associated with a significant increase in VRN1 expression during early spike development [65]. In summary, we identified multiple wheat genes involved in the early IM → TS transition and validated the association between SPL14 and the final number of spikelets per spike.
Time and pseudotime changes in spike development
Spike and spikelet developmental changes over time were explored across three developmental stages (W1.5, W2.5 and W3.5), along the longitudinal axis of the spike, and through trajectory analysis (Additional file 1: Fig. S22). At the early double ridge stage (W1.5), the IM and the upper ridge cells were included in cluster c8 (early meristem) and a few cells in cluster c6 (bract repression, Figs. 1A and S5). These two cell clusters expanded at the late double ridge stage (W2.5, Fig. 1B), and a gradient of spikelet differentiation started to form along the longitudinal axis, with the most advanced spikelets located at the center of the spike. This developmental gradient became more pronounced at W3.5, when well-developed floral meristems were observed at the central spikelets (Fig. 1C, clusters c17 and c18).
These dynamic changes were captured in a trajectory analysis (Additional file 1: Fig. S22), which used cluster c8 (IM and early SM meristems) as the root. From c8, two trajectories diverged in opposite directions: one leading to the formation of floral meristems (c17 and c18) and the other one towards the formation of the transition zone (c19), the repressed bract (c6), and the central zone (c3). A third trajectory diverged into three branches: one leading to the central spikelet (c9), another to the glume and lemma primordia (c7), and a third one to the boundary clusters c14 and then c16 (Additional file 1: Fig. S22). Cluster c9 was also connected to the suppressed bract trajectory (Additional file 1: Fig. S22).
These predicted trajectories reflected many of the developmental changes observed during spike development but also showed a few discrepancies. Although the c14 cluster appeared earlier than c16 in the predicted trajectory, c16 cells were observed at the base of the developing spikelets earlier than those assigned to c14, both across developmental stages and along the longitudinal gradient of the spike (Figs. 1 and S2). A closer examination of Additional file 1: Fig. S22 showed that multiple c16 cells connect directly to the meristematic region (c8), suggesting an alternative trajectory from c8 to c16 independent of c14.
The comparison of the different spikelets within a spike provided a precise view of the dynamic gene changes leading to the formation of the FM. The meristematic markers HAF1 and ULT1 were expressed in both early and advanced meristems, whereas BIF2 and WOX7 expression in the meristems was restricted to the youngest SMs (Additional file 1: Fig. S18B and D). In more advanced SMs or FMs, BIF2 and WOX7 were detected in c14 and other clusters (Additional file 1: Fig. S16). In SMs, slightly more developed than those expressing BIF2 and WOX7, we detected the MADS-box gene AGL6, which is known to play a role in paleae and lodicule development [12]. Finally, in the more developed central spikelets, AGL6 expression was restricted to a region between the lemma primordia and the FM that overlapped with c17, and the FM showed expression of floral homeotic genes and WAPO1 (Additional file 1: Fig. S18E-H).
Single-cell RNA sequencing of developing wheat spikes
To identify additional genes regulating wheat spike development, we conducted single-cell RNA-seq (scRNA-seq) using protoplasts isolated from Kronos spikes at the W2.5 and W3.5 stages (Fig. 5A). We optimized the cell wall digestion method to enhance meristem cell recovery, following a previous single-cell study on maize inflorescence stem cell [66] (see Methods). Raw scRNA-seq data are available in the NCBI Sequence Read Archive (SRA) under BioProject accession number PRJNA1199502 [67]. Reads were mapped to the Kronos reference genome v1.1 (annotation v1.0) [68].
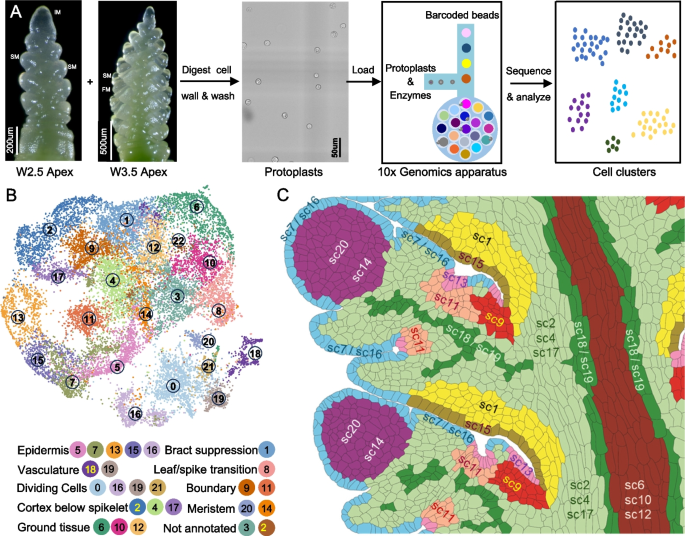
Single-cell RNA-seq (scRNA-seq) analysis of wheat developing spikes at the W2.5 and W3.5 stages. A Experimental workflow, including wheat protoplast isolation and subsequent scRNA-seq. B UMAP plots showing cell clustering and their annotations. C Cartoon with inferred positions of the different scRNA-seq clusters based on information discussed in the next sections. The cartoon is based on the same two central spikelets shown in Fig. 4C, allowing for direct comparisons with the smFISH clusters
In the initial analysis, we profiled 12,304 and 13,705 individual cells from three independent replicates at W2.5 and W3.5 stages, respectively (Additional file 2: Table S7). Good integration was observed among both replicates and stages (Additional file 1: Fig. S23A). We detected expression of 67,629 genes at W2.5 and 70,047 genes at W3.5 (Additional file 2: Table S7), comparable to the number of genes detected in bulk RNA-seq of Kronos spikes at the same developmental stages [69]. The mean and median unique molecular indices (UMIs), the number of detected genes per cell, and other statistics are reported in Additional file 1: Fig. S23A and Additional file 2: Table S7. Cell clustering of 26,009 cells from both stagers using Seurat v5 [70] identified 25 distinct clusters in the initial analysis (Additional file 1: Fig. S23A). Nine clusters were identified with cells at either the G2/M or S phase, marked by CYCB2 and HIS2A1 expression, respectively (Additional file 1: Fig. S23B-C).
To improve the resolution of biologically relevant clusters, cells from the nine cell-cycle clusters in the initial analyses were removed, and the remaining 17,283 cells were re-clustered into the final 23 clusters described in this study (sc0 to sc22, Fig. 5B). The final single-cell clusters were visualized using two-dimensional (2D) uniform manifold approximation and projection (UMAP) plots (Fig. 5B) and a 3D-UMAP (https://dubcovskylab.ucdavis.edu/content/kronos-scrna-3d-clusters). We also developed a Shiny App (https://ucdxu.shinyapps.io/Wheat-Kronos-spikes-scRNAseq/) to visualize gene expression across clusters. To quantify the relationships among clusters, we calculated the average normalized gene expression across all cells for each cluster and used these expression profiles to calculate Pearson correlations for all cluster pairs (Additional file 2: Table S8).
Characterization of scRNA-seq cell clusters and integration with spatial clusters
To annotate the scRNA-seq clusters, we identified and annotated genes preferentially expressed in each cluster (Additional file 2: Table S9). We used this annotation to identify known marker genes (Additional file 2: Table S1) and to perform KEGG pathway analyses (Additional file 2: Table S10). We also incorporated spatial information into the scRNA-seq clusters using RNA-seq data from the basal, middle, and top sections of Kronos developing spikes at W3.0 (Additional file 1: Fig. S24 and Additional file 2: Table S11), as well as from correlations with published spatial transcriptomics clusters from hexaploid wheat (Additional file 2: Table S13-15) [21].
To integrate the scRNA-seq and smFISH data, we used an imputation approach recently published in barley that incorporates scRNA-seq information into smFISH-labelled cells while retaining their spatial information [71]. Briefly, we analyzed the cells from both studies together using the 91 common genes and for each smFISH-labelled cell we identified the five closest scRNA-seq cells. We then used the average expression of these five cells (weighted by their distances) to impute the scRNA-seq expression into the smFISH-labelled cell (see Methods). We developed a web tool to visualize the spatial expression profiles of the 74,464 imputed genes in two spike sections at W2.5 and two at W3.5 (https://dubcovskylab.ucdavis.edu/imputed-genes). This tool greatly expanded the spatial information available to annotate the scRNA-seq clusters.
We used a similar approach to project the smFISH cluster ID into the scRNA-seq cells (see Methods). Since the number of genes in the smFISH clusters affected the number of identified cells, we divided the number of projected cells by the total number of cells in the smFISH clusters and generated a table including the “%-contribution” of each smFISH cluster to each scRNA-seq cluster (Additional file 2: Table S12).
The different sources of information used to annotate the scRNA-seq clusters are summarized in Additional file 2: Table S16 along with the final cluster annotations. The use in these annotations of similar names as the smFISH clusters indicates a better overlap than with other clusters and not a perfect one-to-one correspondence. The tentative physical locations of the scRNA-seq clusters are presented schematically in Fig. 5C as a reference for the evidence discussed in the sections below, which are grouped by similar functions.
Cell cycle enriched clusters
Although cells from the initial cell-cycle clusters were removed, four of the 23 final clusters exhibited enrichment in cell-division marker genes combined with markers for other tissues. The S-phase markers HIS2A1-1 and HIS2A1-2 were enriched in clusters sc0, sc16, sc19, and sc21 (Additional file 1: Fig. S25). Cluster sc16 was also enriched in G2/M phase cyclin markers (CYC7), cyclin-dependent kinases (CDKB2), and the GROWTH REGULATING FACTORs GRF2, GRF4, and their cofactor GIF1 (Additional file 1: Fig. S25). Gene IDs and references for all marker genes are provided in Additional file 2: Table S1.
Among the genes preferentially expressed in cluster sc21 (Additional file 2: Table S9) that exhibited significant differences in the RNA-seq study, 65% were expressed at higher levels in the base of the spike (Additional file 2: Table S11-S16) suggesting a predominantly basal location for sc21. The smFISH cluster with the highest contribution to sc21 was c3 (central spike) supporting the previous result (Additional file 2: Table S12). The basal and central regions of the Kronos spike were characterized by a green coloration (Fig. 5A), indicative of the presence of chlorophyll. This observation suggested that sc21 was enriched in genes within the photosynthetic pathway, a hypothesis supported by the KEGG analysis (Additional file 2: Table S10). Based on these findings, cluster sc21 was annotated as “cell cycle/photosynthetic ground tissue/basal region”.
Most of the genes preferentially expressed in sc0, sc16, and sc19 (Additional file 2: Table S9) were expressed at higher levels in the distal third of the developing spikes (Additional file 2: Table S16). This enrichment was strongest in sc0 (100% of the genes), intermediate in sc16 (78%), and weak but significant in sc19 (47%). Based on its distal position and enrichment in meristematic markers, sc0 was annotated as “cell cycle/meristematic/distal region”. Among the smFISH clusters, the one with the highest %-contribution to sc0 was c8 (early meristem) supporting the previous result (Additional file 2: Table S12). Cluster sc19 was also enriched in vascular markers, and among the smFISH clusters projected into sc19 the highest value was for c13 (vasculature, Additional file 2: Table S12). Based on these results, sc19 was annotated as “cell cycle/vasculature/enriched in spike tip”. Finally, sc16 showed multiple epidermal markers and KEGG enrichment in cutin, suberin, and wax biosynthesis (Additional file 2: Table S10), which supported its annotation as “cell-cycle/epidermis/enriched in spike tip”. Additional information for sc16 is provided in the next section on epidermal markers.
Epidermal clusters
A similar enrichment in cutin, suberin, and wax biosynthesis was detected in the KEGG analysis for cluster sc15, supporting its annotation as an epidermal cluster. Clusters sc5, sc7, and sc13 were also annotated as epidermal clusters based on the preferential expression of known epidermal markers, including ONI (synonymous with KCS10), PEL3, SCR, ROC2, ROC3, and ROC7 (Additional file 2: Table S1, Additional file 1: Fig. S26). The Kronos imputed expression data confirmed the epidermal expression of these six genes (Additional file 1: Fig. S26H). Since no epidermal markers were included in our smFISH experiment, these results exemplify the power of the imputation approach.
We compared the single-cell epidermal clusters to a recent hexaploid spatial transcriptomics study that identified two expression domains, ED1 and ED4, associated with epidermal cells [21]. These two epidermal expression domains had the highest correlations with sc7, sc13, sc15, and sc16 (Additional file 2: Table S13-15), further supporting the epidermal annotation of these clusters. However, their correlations with sc5 were intermediate (Additional file 2: Table S13-15). To identify markers that differentiate the five epidermal clusters, we performed a separate comparison including only these clusters and summarized the results in Additional file 2: Table S17.
Epidermal clusters sc16 and sc7 were highly correlated (R = 0.79) and were both enriched in genes with higher expression levels at the spike tip (sc7 = 50% and sc16 = 69%). These clusters also showed high expression levels of ribosomal genes (Additional file 2: Table S16), suggesting rapid cell growth and division. Cluster sc16 showed preferential expression of multiple cell-cycle genes (Additional file 1: Fig. S25A-G, Additional file 2: Table S17) and higher correlations with cell-cycle clusters sc0, sc19, and sc21 than all other epidermal clusters (Additional file 2: Table S8). Cluster sc16 was also enriched in meristematic markers WOX3a and WOX3b (Additional file 2: Table S17). The smFISH cluster c8 (early meristem) showed the highest %-contribution to sc16 relative to other smFISH clusters, supporting the previous result (Additional file 2: Table S12). Taken together, these results justify the annotation of sc16 as “cell cycle/epidermis/enriched in spike tip”.
Epidermal cluster sc7 was enriched in both meristematic and lateral organ markers. The enriched meristematic markers included AGL6 (Additional file 1: Figs. S18B and S27A), and the imputed WOX3b (Additional file 1: Fig. S27J) and CLE33 (Additional file 1: Fig. S27K). Cluster sc7 was also enriched in YAB3 and YAB4 genes (Additional file 1: Fig. S27C, Additional file 2: Table S17), which were detected at the lower ridge and lateral organs in hexaploid wheat [21]. This expression pattern was validated in our imputed expression data (Fig. 27L). Correlations between epidermal clusters sc7 and sc16 and the hexaploid wheat expression domains ED4 (meristem epidermis) and ED1 (glume and lemma epidermis) [21] were the highest in both directions and in all three developmental stages (Additional file 2: Table S13-S15). In addition, the smFISH clusters with the highest %-contribution to sc7 were c7 (glume and lemma) and c8 (early meristem) relative to other smFISH clusters (Additional file 2: Table S12). Taken together, these results support the annotation of epidermal cluster sc7 as “epidermis/meristem and lateral organs” (Fig. 5C).
Epidermal cluster sc15 showed the second highest correlations with ED1/ED4 after sc7/sc16 in hexaploid wheat (Additional file 2: Table S13-15). However, sc15 differed from sc7 by its lower expression of genes encoding ribosomal proteins and in its more uniform distribution along the spike (Additional file 2: Table S16). Among the marker genes identified for sc15, SPL13 and SPL14 (Additional file 1: Figs. S26G and S27D-E) suggest that sc15 may correspond to the abaxial base of the spikelets including the suppressed bract region (Additional file 1: Fig. S14A-D). This hypothesis is also supported by the higher correlation observed between sc15 and the suppressed bract cluster sc1 (R = 0.63) than with meristematic clusters sc14 and sc20 (Additional file 2: Table S8). Consistent with the previous result, the smFISH cluster with the highest relative %-contribution to sc15 was c6 (suppressed bract, Additional file 2: Table S12). Based on these results, sc15 was annotated as “epidermis/suppressed bract” (Fig. 5C).
Epidermal cluster sc13 showed a relatively high correlation with sc15 (R = 0.77) but differed by its preferential expression of TCP24, a marker gene for the adaxial boundary domain (Fig. 4A and C). Cluster sc13 was enriched in additional boundary markers such as TCP22, CUC3, LAX1, and DP1, which have been found to be preferentially expressed in the boundary domain in hexaploid wheat [21] and in our imputed expression profiles (Figs. S27M-P). The sc13 cluster sowed higher correlations with the hexaploid wheat expression domain ED12 (boundary domain) [21] than with epidermal clusters ED1/ED4 and all other clusters (Additional file 2: Table S13-15). Relative to other smFISH clusters, c16 (adaxial boundary) showed the highest %-contribution to sc13 (Additional file 2: Table S12). Based on these results, sc13 was annotated as “Epidermis/adaxial boundary” (Fig. 5C).
Finally, sc5 was the most divergent of the epidermal clusters, showing the lowest correlation with other epidermal clusters, the lowest expression levels of epidermal markers SCR, PEL, and ONI (Fig. 26G), and the largest number of differentially expressed genes (Additional file 2: Table S17) with two examples in Additional file 1: Fig. S27H-I. The smFISH clusters with the highest contribution to sc5 was c19 (transition zone), suggesting an enrichment in epidermal cells from the transition zone. However, based on sc5 intermediate/high levels of protoplasting induced genes (Additional file 2: Table S16), high correlations with unknown clusters sc3 and sc22 (Additional file 2: Table S8), and uniformly low correlations with spatial clusters in hexaploid wheat (Additional file 2: Table S13-15), we designated sc5 as “Epidermis/unknown”.
Vascular clusters
The vascular genes APL, LAX4, CEN5, PIN1a, and PIN1b characterized by smFISH (Fig. 3) were all preferentially expressed in sc18 and sc19, along with additional known vascular marker SHR1, phloem markers JUL1 and DOF19, and xylem markers TMAAT, TMO5L1, TMO5L3, WAT1, and XCP1, LOG10b, and NAC52 (Additional file 1: Fig. S28, Additional file 2: Table S1). The vascular location of the last ten markers was validated in the Kronos imputed expression profiles (Additional file 1: Fig. S28H), together with APL and LAX4 controls characterized also by smFISH (Fig. 3). The smFISH cluster with the highest contribution to sc18 and sc19 was c13 (vasculature, Additional file 2: Table S12). These results support the annotation of sc18 and sc19 as vascular clusters (Fig. 5C).
Both vascular clusters shared relatively high expression levels of OSH1 and genes encoding ribosomal proteins (Additional file 2: Table S16). However, the genes preferentially expressed in sc19 (Additional file 2: Table S9) were expressed at higher levels at the tip of the spike (Additional file 2: Table S16), whereas those preferentially expressed in sc18 (Additional file 2: Table S9) were expressed at higher levels at the base and middle of the developing spikes (Additional file 2: Table S16). Since sc19 was enriched in HIS2A expression and sc18 was not (Additional file 1: Fig. S25), sc19 was annotated as “cell cycle/vasculature/enriched in spike tip” and sc18 as “vasculature/enriched in spike base and middle”.
Cluster sc18 showed two distinct regions: one preferentially expressing phloem markers (Figs. S28B and D) and the other expressing xylem markers (Figs. S28C, E–F). To compare these regions, we further divided sc18 into three subclusters: sc18_0 with the highest correlation to the ground tissue cluster c3 (R = 0.625), sc18_1 including phloem markers JUL1 and DOF19, and sc18_2 including xylem markers WAT1, XCP1, TMO5L1, LOG10b, and NAC52 (Additional file 1: Fig. S28H). Genes differentially expressed in sc18_1 and sc18_2 are available in Additional file 2: Table S18.
Consistent with the key role of hormones in vascular development [72, 73], sc18 showed preferential expression of both homeologs of the auxin signaling genes PIN1, and ARF11, and the JA biosynthetic gene OPR3. Cluster sc18 also showed preferential expression of the CPS1 gene encoding a GA biosynthesis enzyme, and genes CKX-B3, CKX-B5, and CKX-B11, all involved in cytokinin degradation (Additional file 1: Fig. S28I).
Interestingly, the floral homeotic genes AP3 and PI1 (Additional file 1: Fig. S18F) were also detected in cluster sc18 (Figs. S29A-B). A closer examination of the smFISH profiles revealed that these two MADS-box genes were co-expressed with the vascular marker APL at all three developmental stages (Figs. S29C-E). Expression of class-B MADS-box genes in the developing vasculature has been reported in a few eudicot plant species [74]. Our findings extend this conserved function to monocots.
Central spike clusters
In addition to vascular and pro-vascular cells, the central region of the developing spike contains ground tissue cells, which correspond to cluster c3 (Fig. 1 central spike) in our smFISH study, and expression domains ED3 (developing rachis) and ED5 (rachilla) in the hexaploid wheat study [21]. These ground tissue cells showed a green coloration indicative of chlorophyll presence, which was stronger at the base of the spike (Fig. 5A). The KEGG analysis indicated that genes preferentially expressed in single-cell clusters sc6 and sc10 were enriched in photosynthesis pathways (Additional file 2: Table S10). Eighty two percent of the top 50 genes preferentially expressed in sc6 were annotated with photosynthesis-related functions (Additional file 2: Table S9), including CAB2R and LHCB1.1, which were detected in the central spike region in hexaploid wheat [21] and were validated in the Kronos imputed expression data (Additional file 1: Fig. S30A-H). The expression levels of these photosynthetic genes across all clusters are presented in a heat-map in Additional file 1: Fig. S31.
The highest average enrichment in photosynthetic genes was detected for sc6 followed by cell-cycle cluster sc21 (Additional file 1: Fig. S31, Additional file 2: Table S16). This finding supported the previous annotation of sc21 as “cell cycle/photosynthetic ground tissue/basal region”. Enrichment in photosynthetic genes was also observed in sc10 and sc12, but at decreasing levels relative to sc6 (Additional file 2: Table S16 and Additional file 1: Fig. S31). A large proportion of the genes preferentially expressed in sc10 (44%) and sc12 (36%) were also preferentially expressed in sc6 (Additional file 1: Fig. S32), supporting the connections among these clusters.
The genes preferentially expressed in sc6, sc10, and sc12 showed higher levels of expression at the basal region of the developing spikes based on the RNA-seq data (Additional file 2: Table S11-S16). This location was further supported by the enrichment of FWL3 and SVP1 in both sc6 and sc10, which are expressed in the central and basal parts of the spike (Figs. S32A-C and H). In addition, both sc10 and sc12 were enriched in OSH1, a gene highly expressed in the central spike region (Additional file 1: Fig. S12). Cluster sc6 was enriched in additional genes expressed in the central spike region, including AP3, bZIPC3, FDL15, FT2, OSH1, SPL3, and VRT2 (Figs. S12 and S30), as well as CAB2R and LHCB1.1 both in hexaploid wheat and in our imputed expression data (Additional file 1: Fig. S30H). The smFISH cluster with the highest relative %-contribution to sc6, sc10, and sc12 was c3 (spike central, Additional file 2: Table S12), supporting a central spike location for the cells of these three clusters. Based on the above information, clusters sc6 and sc10 were annotated as “central spike/photosynthetic ground tissue/spike base,” and sc12 as “tentative ground tissue/enriched spike base” (Fig. 5C).
Transition zone between leaves and spike
The transition zone between the leaves and the spike is represented by the smFISH cluster c19 (Figs. 1, S5), which shared several preferentially expressed genes with scRNA-seq cluster sc8. These genes included TB1, TB2, SPL17, GNI2, IDD10, and GA20ox1 (Additional file 1: Fig. S33A) from our smFISH study. This region was also enriched in LEC1 and TRD1, two genes identified in the hexaploid wheat data [21] and validated in our imputed expression data (Additional file 1: Fig. S33B-F). Cluster sc8 also showed high enrichment in jasmonic acid signaling genes MYC2 and JAZ8, although both genes were also expressed in other clusters (Additional file 1: Fig. S33E-F).
Among the genes preferentially expressed in sc8, SPL17 and its downstream target TRD1 [30] (ortholog of OsNL1 and ZmTSH1) were previously shown to play important roles in bract suppression in the transition zone. Loss-of function mutations in SPL17/SPL14 in hexaploid wheat [4] and its orthologs in rice [30] and maize [5] were associated with bract outgrowth at the base of the inflorescences. A similar phenotype was observed in TRD1 mutants in barley [75], rice OsNL1 [76], and maize ZmTSH1 [77]. This phenotype was consistent with the significantly higher expression at the base of the spike of SPL17 and TRD1 (Additional file 2: Table S11). Among the genes in the RNA-seq experiment with significant differences among the three sections of the spike, 66% of the ones expressed in sc8 showed higher levels at the base of the spike (Additional file 2: Table S16). Among the smFISH clusters, the one with the highest contribution to sc8 was c19 (transition leaf/spike) followed by c3 (central spike, Additional file 2: Table S12). Based on these results, sc8 was annotated as “transition leaf-spike/spike base”.
Suppressed bract cluster
Cluster c6, which includes the suppressed bract cluster, was consistently detected in the smFISH study at the base of each developing spikelet (Fig. 1). This cluster showed strong differential expression of SPL13 and SPL14 (Additional file 2: Table S2), two markers that were also enriched in the scRNA-seq cluster sc1 (Additional file 1: Fig. S34) and that supported its annotation as “suppressed bract region” (Fig. 5C). This annotation was also supported by smFISH cluster c6 (suppressed bract) showing the highest contribution to sc1 among the different smFISH clusters (Additional file 2: Table S12). The suppressed bract clusters c6 and sc1 also showed high correlations with the transition zone clusters c19 and sc8, respectively (Additional file 2: Table S3 and S8), probably reflecting their shared function in repressing the leaf ridge.
The overlap between c6 and sc1 is likely incomplete. Cluster sc1 also showed a relatively high contribution of smFISH cluster c3 (Fig. Additional file 2: Table S12), suggesting that it may include cells from both the suppressed bract and ground tissue. Conversely, the c6 cluster includes epidermal cells (Fig. 4C,D), which were included in the “epidermal/suppressed bract” cluster sc15 in the scRNA-seq study.
Boundary clusters
Among the genes analyzed in the smFISH experiment, FZP and TCP24 showed the most specific expression domains (Figs. 4, S15, Additional file 2: Table S2). FZP was expressed in the glume axilla (c14), while TCP24 was expressed adjacent to FZP at the adaxial boundary region below each spikelet (c16, Fig. 4C,D and S15-16). In addition to FZP, the hexaploid wheat spatial expression data showed enriched expression in the adaxial boundary for the WUSCHEL-RELATED HOMEOBOX9c (WOX9c, Additional file 1: Fig. S35A), TCP22, LAX1, and DP1 (synonymous with BAF1) [21]. We validated these expression profiles in the Kronos imputed expression data (Additional file 1: Fig. S27M, O-P).
Mutations in wheat MULTI-FLORET SPIKELET 1 (MFS1, synonymous with DUO and ERF130) have been previously associated with mild supernumerary spikelets and increased grain number per spike, highlighting its role in wheat spike development [78]. This motivated us to include MFS1 in the smFISH experiment, which showed high levels of expression in clusters c14 and c16, and lower expression in other clusters (Additional file 1: Fig. S35B-C). The high expression in c14 and c16 correlated with high MFS1 expression in the scRNA-seq clusters sc9 and sc11 (Additional file 1: Fig. S35D), prompting us to investigate a potential overlap among these clusters.
Three lines of evidence supported the annotation of single-cell cluster sc11 as “glume axilla” (Fig. 5C). First, glume axillary markers FZP and WOX9c were both preferentially expressed in sc11 (Additional file 1: Fig. S36). Second, c14 (glume axilla) showed the highest %-contribution to sc11 among the smFISH clusters (Additional file 2: Table S12). Finally, RNA-seq results showed that sc11 was significantly enriched in genes with higher expression in the center of the spike (Additional file 2: Table S16), mirroring the expression patterns of FZP and WOX9c.
We annotated the scRNA-seq cluster sc9 as “adaxial boundary” based on multiple shared markers with smFISH cluster c16. TCP24 was preferentially expressed in sc9 and was also abundant in sc13 (Additional file 1: Fig. S37), which includes the epidermal cell layer of the adaxial boundary domain. Other markers preferentially expressed in the adaxial domain, such as TCP22, LAX1, and DP1, were also preferentially expressed in sc9 and/or sc13 (Additional file 1: Fig. S37). The smFISH cluster c16 (adaxial boundary domain) %-contribution to sc9 was more than two-fold higher than the second highest (c9 central-base spikelet), which was also more than two-fold higher than the other smFISH cluster (Additional file 2: Table S12). Taken together, these results support the annotation of sc9 as adaxial boundary domain.
Cortex cells below developing spikelets
In the wheat spike, the cortex consists of a layer of cells situated between the vascular tissues and developing spikelets (Fig. 1). The parenchymatic cells in this region are expected to resemble those in the central ground tissue. As shown in Fig. 4C, the cell layer between the vasculature and the SM base includes ground tissue cells from the central cluster c3 as well as the innermost cells from clusters c6 (suppressed bract), c7 (glume – lemma), c9 (SM base-center), c16 (adaxial boundary), and c14 (glume axilla). Since cortical cells show no greening and are not meristematic, the scRNA-seq clusters including these cells are expected to show low enrichment in photosynthetic genes and reduced expression of OSH1 or ribosomal protein-encoding genes.
Clusters sc2, sc4, and sc17 exhibited high correlations with the spatial clusters located proximal to the developing spikelets in hexaploid wheat (ED0, ED3, ED5, and ED11, Additional file 2: Table S13-S15) [21]. In addition, we found relatively high %-contributions of the smFISH clusters c16 and c6 to sc2, from clusters c9 and c7 to sc4 and from cluster c16 to sc17 (Additional file 2: Table S12). They also exhibited low expression levels of photosynthetic and meristematic genes (Additional file 2: Table S16) and uniform expression along the spike based on the RNA-seq data. Taken together, these results suggest that sc2, sc4, and sc17 may correspond to cortical cells below the spikelets (Fig. 5C).
The annotation of sc2 as a cortex cluster was further supported by the preferential expression of LAX1 and DEPRESSED PALEA1 (DP1) (Additional file 1: Fig. S38), two genes previously shown to be preferentially expressed in the adaxial boundary below the spikelets [79,80,81,82] and validated in the Kronos imputed data (Additional file 1: Fig. S27O-P). Two additional genes, KAN1 and RL9, expressed in the adaxial boundary region below the spikelet in hexaploid wheat [21], were also preferentially expressed in sc2 (Additional file 1: Fig. S38), and their imputed expression is presented in Additional file 1: Fig. S38H. Additional markers enriched in the correlated sc2 and sc13 clusters (Additional file 2: Table S8) included ABCG11 [83] and SOT17 [84] (Additional file 2: Table S9) and were validated in Additional file 1: Fig. S38H.
A more central location of sc4, relative to sc2 and sc17, was supported by the higher %-contributions of the smFISH cluster c9 (central region below spikelet) to sc4 than to the other two spatial clusters (Additional file 2: Table S12). This hypothesis was also supported by the 2.4 to 3.4-fold higher expression of OSH1 in sc4 than in sc17 and sc2, respectively (Figs. S12, S39, Additional file 2: Table S16). In addition, the cortex marker gene NPF3.1 (also known as NPF6.4-LIKE2 in maize [85]) was enriched in sc4 (Additional file 1: Fig. S39F-G), suggesting that this cluster corresponds to cortical cells.
Overall, the scRNA-seq cluster sc17 showed lower correlations with the spatial clusters in hexaploid wheat than sc2, but they were still higher for the contiguous cortex clusters than for the rest of the spatial clusters (Additional file 2: Table S13-15). The highest %-contribution from the smFISH clusters to sc17 was from c16 (adaxial boundary, adjacent to cluster, Additional file 2: Table S12). We annotated sc17 as “tentative cortex region below spikelet lateral regions” due to the lack of validation with marker genes of known spatial distribution. Additional genes preferentially expressed in sc4 and sc17 are listed in Additional file 1: Fig. S39 and Additional file 2: Table S9.
Meristem clusters
The RNA-seq clusters sc14 and sc20 showed preferential expression of meristematic genes ULT1, AGL6 and SEP3-1 (Additional file 1: Fig. S40A-D) suggesting that they included meristematic cells. This hypothesis received additional support from the differential expression of the two homeologs of ULT1. The differences between ULT-A1 and ULT-B1 were evident in the bubble plot in Additional file 1: Fig. S40G, in the UMAPS for the separate homeologs (Additional file 1: Fig. S40H-I), and in the imputed expression profiles (Additional file 1: Fig. S40J-K). In the bubble plots and UMAPS, ULT-A1 showed high expression in meristematic clusters sc14 and sc20 (Additional file 1: Fig. S40H) whereas ULT-B1 did not (ULT-B1 showed differential expression in the central clusters sc6 and sc10, Additional file 2: Table S9). These differences were reflected in the imputed expression profiles, with ULT-A1 expression concentrated in the early (c8) and floral meristems (c17 and c18) and ULT-B1 expression concentrated in the central part of the spike (Additional file 1: Fig. S40J-K). The correspondence between the spatial location and ULT1 homeologs and their scRNA-seq cluster assignment in the UMAPS and bubble plots supported the conclusion that sc20 and sc14 include meristematic cells. More generally, the ULT1 results suggest that the expression imputation method developed by Demesa-Arevalo et al. [71] in diploid barley can be also used to differentiate expression profiles between wheat close homeologs in polyploid species.
The presence of meristematic cells in sc20 and sc14 was also supported by high levels of expression of ribosomal genes (Additional file 2: Table S16), intermediate expression levels of OSH1 (Additional file 1: Fig. S40G) and by the higher %-contributions of the smFISH cluster c8 to both sc20 (1.5% = 33 cells) and sc14 (5.3% = 114 cells) relative to other smFISH clusters (Additional file 2: Table S12). Taken together these results support the annotation of sc14 and sc20 as meristematic clusters.
AGL6 was detected in early meristems (c8) immediately before their transition to floral meristems (Additional file 1: Fig. S40L), after which it became more abundant at the base of the FM (c17, Additional file 1: Fig. S40L). This result is consistent with the role of AGL6 role in paleae and lodicule development [12]. SEP3-1 showed a similar profile but its expression started slightly later than AGL6 and was detected in both the FM (c18) and its base (c17, Additional file 1: Fig. S40M). Additional file 1: Fig. S40N-P shows three additional genes differentially expressed in sc14 (Additional file 2: Table S9). SEP1-2 is preferentially expressed in lemmas and a few meristematic cells (SEP1-2, Additional file 1: Fig. S40N and Fig. 4). The rice homolog of SEP1-2, LHS1/OsMADS1 controls floret meristem specification [86]. The second gene, JLO, encodes a LOB domain protein gene expressed in Arabidopsis at the base of the floral meristem (c17, Additional file 1: Fig. S40O) [87]. Finally, FCP1 was expressed in the floral meristem (c17 and c18) and c14 at the glume axilla (Additional file 1: Fig. S40P). In rice, FCP1 is a negative regulator of WOX4 and of meristem maintenance [88]. Based on these results sc14 was annotated as “meristem proximal region.” Cluster sc20 was enriched in genes differentially expressed in the distal one-third of the spike (Additional file 2: Table S16), so it was annotated as “meristem/enriched in spike tip.”
Many of the genes enriched in sc14 and sc20 also show some enrichment in epidermal clusters sc7 and sc16 (Additional file 1: Fig. S40G, small arrows), supporting their previous annotation as “epidermis/meristem and lateral organs.” The imputed expression data showed enriched expression of WOX3b and CLE33 in c8 including the epidermal cells (Additional file 1: Fig. S27J-K). Additional genes preferentially expressed in sc14 and sc20 are listed in Additional file 2: Table S9.
Protoplasting affected clusters
The last two scRNA-seq clusters, sc3 and sc22 (smallest cluster with only 163 cells), showed evidence of being affected by the protoplasting. First, these clusters showed the highest proportion of preferentially expressed genes that were not detected in RNA-seq studies of Kronos developing spikes (this study and [69]). Approximately 19% of the preferentially expressed genes in sc3 and 28% in sc22 were not detected at the same stages in Kronos spikes under normal conditions (Additional file 2: Table S16). The 235 genes detected only in the scRNA-seq were enriched in stress-related GO terms (Additional file 2: Table S19), further supporting their induction by protoplasting. The preferentially expressed genes in sc3 and sc22 also showed a relatively high overlap with a list of genes previously annotated as potentially affected by protoplasting [85] (sc3 = 11% and sc22 = 13%, Additional file 2: Table S16). The percentage of genes identified by these two criteria across the 23 single-cell cluster showed a high correlation (R = 0.81), indicating a similar underlying process. Cluster sc3 showed a high correlation with sc10 (R = 0.85, Additional file 2: Table S8) and sc22 with cluster sc14 (R = 0.88, Additional file 2: Table S8), suggesting that these clusters may contain cells related to those clusters but affected by protoplasting. Based on these results, we annotated sc3 and sc22 as “unknown.”
Co-expression analyses
The generation of smFISH and scRNA-seq datasets from the same genotype, tissues, and developmental stages provided the opportunity to identify additional genes co-expressed in specific expression domains. We focused on four genes with specific expression domains―FZP and TCP24 in the boundary domains and ULT1 and AGL6 in the meristem―and calculated Pearson correlations between each of them and all other genes across all cells in the scRNA-seq dataset. The genes with R values exceeding four standard deviations above the mean (close to zero as expected) were selected as co-expressed genes for further analyses (Additional file 2: Table S20-S24).
Genes co-expressed with boundary genes FZP (c14) and TCP24 (c16)
The genes with the highest co-expression values for FZP and TCP24 were their respective homeologs, serving as positive controls (Additional file 2: Table S20-S21). We found 608 genes significantly co-expressed with FZP and 606 with TCP24, with 226 shared (988 total).
Among the shared co-expressed genes, we identified the well-studied gene CUP-SHAPED COTYLEDON 3 (CUC3, Additional file 2: Table S20-S21), a NAC-domain transcription factor involved in meristem/organ boundary specification in rice [89] and Arabidopsis [90]. In situ and scRNA-seq experiments in maize demonstrated that CUC3 is expressed in both the FZP and TCP24 domains [82, 85, 91], a result validated by our imputed expression data (Additional file 1: Fig. S27N). The MFS1 gene also showed a significant correlation with both FZP and TCP24 (Additional file 2: Table S20-S21) and was co-expressed with both genes in the smFISH and imputed expression data (Additional file 1: Fig. S35B-C).
Among the genes showing significant co-expression with FZP and not with TCP24, we identified WOX-9c and CLE33 (Additional file 2: Table S20. Additional file 1: Fig. S35). WOX-9c is a close paralog of WOX7 [92, 93] with a similar expression profile as FZP (Additional file 1: Fig. S35A). CLE33 showed a similar expression profile as WOX7 (Figs S16 and S18C), changing from expression in the early meristems (Additional file 1: Fig. S27K) to an overlap with FZP in the more developed spikelets with FMs (Additional file 1: Fig. S35E). In Arabidopsis, RNA interference of WOX9 in reproductive meristems resulted in the conversion of flowers into inflorescence-like structures [94], resembling the conversion of spikelets into branches observed in fzp natural mutants in wheat and other grass species [49,50,51,52]. The rice loss-of function mutations in WOX7 (dwt1) resulted in larger panicles, suggesting that these two related WOX genes have functional roles in inflorescence development [59].
TCP24 showed high co-expression with TCP22 (the close paralog of TCP24), DP1, and LAX1 (Additional file 2: Table S21), three genes previously confirmed to be expressed in the adaxial boundary domain in hexaploid wheat [21] and validated in our imputed expression data (Additional file 1: Fig. S27M-P). DP1 is an ortholog of the maize gene BARREN STALK FASTIGIATE1 (BAF1, Additional file 2: Table S21), which is expressed in a narrow domain adaxial to developing axillary meristems in maize [91]. Mutations in BAF1 resulted in the absence of ears or their fusion to the main stalk, supporting its role in demarcating the boundary of the developing axillary meristem. LAX1 is required for the initiation of aerial lateral meristems and is expressed in the adaxial boundary region of the spikelet meristems in both rice and maize (BARREN STALK1, ZmBA1) [79, 80]. A strong correlation was also observed between TCP24 and RAMOSA2 (RA2, Additional file 2: Table S21), which is preferentially expressed in cluster sc9 in the imputed expression data (Additional file 1: Fig. S35F). In maize, RA2 is expressed in a group of cells that predict the position of the axillary meristem formation [95]. Additional genes co-expressed with TCP24 are listed in Additional file 2: Table S21. Based on the physical location of TCP24 and its co-expressed wheat genes, together with the known functions of the maize homologs, we hypothesize that c16 cells contribute to delimiting the wheat SM and act as an important signaling center for spikelet development [96].
To investigate the interactions centered on TCP24 and FZP, we generated a gene regulatory network using GENIE3 [97], focusing on the 988 genes co-expressed with FZP (Additional file 2: Table S20) and/or TCP24 (Additional file 2: Table S21) in the scRNA-seq dataset. From the top-500 significant interactions, we constructed a network visualized in Cytoscape 3.10.3 (Additional file 1: Fig. S42). The 95 genes included in this network were all transcription factors (Additional file 2: Table S22) suggesting that FZP and TCP24 are part of a broad regulatory network including many other transcription factors. The analysis revealed connections between the TCP24 homeologs, which share multiple targets, including their closest paralog TCP22. TCP24 also showed regulatory links with LAX1 homologs and RA2, supporting their coordinated expression in the adaxial boundary (Additional file 1: Fig. S42, Additional file 2: Table S22). Similarly, the two FZP homeologs were connected and shared common links including WOX9c. Additionally, TCP24 and FZP shared several downstream targets, such as the boundary regulator CUC3, suggesting a potential functional convergence (Additional file 1: Fig. S42, Additional file 2: Table S22). This regulatory network analysis provides a framework to investigate the genetic interactions that define the functions of these boundary domains.
Genes co-expressed with meristem genes ULT1 and AGL6
The smFISH results for ULT1 showed expression in the IM, SM, and FM meristems as well as in the central spike region (Figs. 4F and S18C-D). However, the co-expression analysis revealed limited correlation between ULT-A1 and ULT-B1 homeologs (Additional file 2: Table S23) supporting their functional differentiation described in Additional file 1: Fig. S40H-K. Interestingly, among the 100 genes showing the highest correlations with ULT-A1, 82 encoded ribosomal proteins (Additional file 2: Table S23), suggesting a higher rate of protein production and rapid cell growth and division. This enrichment was not observed for ULT-B1, supporting the conclusion that ULT-A1 is the homeolog predominantly expressed in meristematic cells. A heatmap based on the 45 ribosomal genes with the highest correlation values with ULT-A1 revealed that cluster sc20 exhibited the highest expression level among the 23 single-cell clusters (Additional file 1: Fig. S43). Cluster sc14 also showed relatively high levels of ribosomal genes, but lower than those in sc20.
Co-expression analysis of AGL6 revealed significant correlations with floral homeotic genes SEP3-1, SEP3-2, WAPO1, AG1, and PI1 (Additional file 2: Table S24). Among the 100 genes showing the highest co-expression values with AGL6, 43 encode ribosomal proteins (Additional file 2: Table S24). A similar enrichment of ribosomal protein encoding genes has been reported in a single-cell study of maize stem cells [66]. These co-expression studies also revealed genes with previously uncharacterized roles in inflorescence development (Additional file 2: Table S23-S24). We explored the imputed expression of these genes and prioritized three that were expressed in the spike meristematic regions for further functional characterization: the remodeling genes DDM1a [98] (Additional file 1: Fig. S41B) and BTBN16 (Additional file 1: Fig. S41C), and the auxin response gene SHI1 [99] (Additional file 1: Fig. S41D).
scRNA-seq trajectory analysis
To summarize the relationships among the scRNA-seq clusters, we performed a trajectory analysis (Additional file 1: Fig. S44) starting from the early meristematic cluster sc14. In the lower region of the graph, one branch of the trajectory connected sc14 with the vascular clusters sc18 and sc19 (and the cell division clusters), and the other branch with the epidermal clusters (Additional file 1: Fig. S44). The early connection of sc14 with sc5 (epidermis unknown) and sc7 (epidermis meristem and lateral organ) suggested that these clusters may correspond to early stages of differentiating epidermis cells. The same trajectory later connected with sc15 (epidermis repressed bract) and sc13 (epidermis adaxial boundary).
In the opposite direction, sc14 was linked to two separate loops, each with multiple internal connecting trajectories. The first loop included the ground tissue clusters sc6, sc10, and sc12 and the transition zone sc8. The second interconnected loop included the cortex clusters sc2, sc4, and sc17, and the related repressed bract cluster sc1 and adaxial boundary sc9. The glume axilla cluster sc11 remained disconnected from the rest despite its proximity to cortex cluster sc4 and epidermal cluster sc13. Overall, the predicted trajectories aligned relatively well with the expected relationships among the different cell types derived from the meristematic cells in the wheat spike.