MONTRÉAL, Oct. 15, 2025 /CNW/ – SYDNEY, October 16, 2025 – Champion Iron Limited (TSX: CIA) (ASX: CIA) (OTCQX: CIAFF) (“Champion” or the “Company”) announces that it will be hosting a conference call and webcast on October 30, 2025, at 9:00 AM (Montréal time) / October 31, 2025, at 12:00 AM (Sydney time) with its senior management, during which they will review the Company’s operational and financial results for the second quarter ended September 30, 2025, of the financial year ending March 31, 2026.
Champion’s financial statements and management’s discussion and analysis for the second quarter ended September 30, 2025, will be released prior to the conference call and webcast, and will be available in the “Financial & Regulatory Reports” section of the Company’s website at www.championiron.com, under the Company’s profile on SEDAR+ at www.sedarplus.ca and on the ASX at www.asx.com.au.
A live audio webcast of the conference call will be accessible for a period of 90 days through Champion’s website at www.championiron.com/investors/events-presentations.
Access to the Conference Call:
Tel. local & overseas:
(+1) 416 945 7677
Tel. North America:
(+1) 888 699 1199
Tel. Australia:
(+61) 2 8017 1385
Webcast:
www.championiron.com/investors
Replay overseas:
(+1) 289 819 1450
Replay N. America:
(+1) 888 660 6345
Replay passcode:
11410 #
Replay expiration:
Thursday, November 6, 2025, at 11:59 PM (Montréal time) / Friday, November 7, 2025, at 3:59 PM (Sydney time)
About Champion Iron Limited
Champion, through QIO, owns and operates the Bloom Lake Mining Complex located on the south end of the Labrador Trough, approximately 13 kilometres north of Fermont, Québec. Bloom Lake is an open-pit operation with two concentration plants that primarily source energy from renewable hydroelectric power, having a combined nameplate capacity of 15M wet metric tonnes per year that produce lower contaminant high-grade 66.2% Fe iron ore concentrate with a proven ability to produce a 67.5% Fe direct reduction quality iron ore concentrate. Benefiting from one of the highest purity resources globally, Champion is investing to upgrade half of the Bloom Lake’s mine capacity to a direct reduction quality pellet feed iron ore with up to 69% Fe. Bloom Lake’s high-grade and lower contaminant iron ore products have attracted a premium to the P62 index. Champion ships iron ore concentrate from Bloom Lake by rail, to a ship loading port in Sept-Îles, Québec, and has delivered its iron ore concentrate globally, including in China, Japan, the Middle East, Europe, South Korea, India and Canada. In addition to Bloom Lake, Champion holds a 51% equity interest in Kami Iron Mine Partnership, an entity also owned by Nippon Steel Corporation and Sojitz Corporation, which owns the Kami Project. The Kami Project is located near available infrastructure, only 21 kilometres southeast of Bloom Lake. Champion also owns a portfolio of exploration and development projects in the Labrador Trough, including the Cluster II portfolio of properties, located within 60 kilometres south of Bloom Lake.
For additional information on Champion Iron Limited, please visit our website at: www.championiron.com.
This press release has been authorized for release to the market by the CEO of Champion Iron Limited, David Cataford.
SOURCE Champion Iron Limited
For further information: For further information, please contact: Champion Iron Limited, Michael Marcotte, CFA, Senior Vice-President, Corporate Development and Capital Markets, 514-316-4858, Ext. 1128, Info@championiron.com
Wondering when, where and how to watch the upcoming “Chris Hemsworth: A Road Trip to Remember” this November? We’ve got you covered. “Chris Hemsworth: A Road Trip to Remember” premieres Nov. 23 at 9/8c on National Geographic and streams next…
In the wake of the COVID-19 pandemic, there has been increasing demand for the remote delivery of health care services using information communication technologies (ICTs), including mobile phones, tablets, and computers [-]. Telehealth is defined as the use of ICTs to support and promote remote clinical health services, health education, public health, and health administration [,]. Telemedicine is a subset of telehealth that focuses on the use of ICTs for the “provision of health care services, including the exchange of medical information, diagnosis, treatment, and monitoring of patients who are not physically present with the health care provider” [].
The World Health Organization (WHO) classifies telemedicine services into one of two model types: (1) patient-to-provider, where telemedicine services are conducted between patients seeking health care services and health care providers, or (2) provider-to-provider, where telemedicine is conducted between 2 or more health care providers to provide specialized input or second opinions []. Telemedicine services may be delivered in real time (synchronously), where live interactive sessions are involved, or in a deferred mode (asynchronously), where data are stored and information is sent remotely through a remote client or patient monitoring, also known as telemonitoring. The main channels for providing telemedicine services include audio calls, SMS text messages, email, audio-video calls, smartphone or customized applications, and picture archive and communication systems [].
India (population of 1.4 billion) is home to some of the world’s earliest and largest telemedicine services []. Emerging first in the 1990s, early telemedicine services were designed and implemented by the Indian Space Research Organization (ISRO), using satellite communication to connect providers in frontline health facilities (“spokes” or peripheral hospitals) with specialists in tertiary hospitals (“hubs”) to deliver health care service remotely []. At the turn of the century, the ISRO expanded its partnership to include the Apollo private hospital network, a partnership that has evolved to include premier public sector facilities, including the All India Institute of Medical Science (AIIMS) New Delhi, the Postgraduate Institute of Medical Education and Research (PGIMER) Chandigarh, and the Sanjay Gandhi Postgraduate Institute of Medical Sciences, and additional private hospitals (Apollo, Aravind Eye Care, and Narayana Hrudayalaya) [-]. By 2015, the ISRO network had grown to include over 245 hospitals (205 district and rural hospitals and 40 superspecialty hospitals) across India [].
In the wake of COVID-19, additional telemedicine services have continued to emerge. Most notably, eSanjeevani, a national telemedicine service, was launched by the Government of India in early 2019. eSanjeevani includes both patient-to-provider and provider-to-provider telemedicine services and is currently operational in 31 states and union territories across India. Since September 2023, with the support of nearly 200,000 registered providers, eSanjeevani is reported to have served over 162 million patients through 1.08 million health and wellness centers (spokes) and 14,007 secondary or tertiary hospitals (hubs) [].
The growing digitization of health care services in India and elsewhere globally has highlighted the potential for telemedicine services to increase access to timely and appropriate care seeking, corresponding to improved health outcomes and cost savings to the individual and health system. Despite this potential, little is known about the varied typologies of telemedicine services providing in India, their design and model characteristics, scale of implementation, and the available evidence on their impact. Improved understanding of the services implemented to date, particularly at scale in India, may help to guide the efforts of future telemedicine services in other low- and middle-income countries where the disease burden is highest and the need for improved access to timely and appropriate health services is greatest.
This scoping review aims to describe the characteristics of large-scale telemedicine services initiated between 2000 and 2023 in India and to present an overview of the evidence available on these services. Study findings are anticipated to improve understanding of the vast expanse of telemedicine services offered in India and provide insights into the design, implementation, and available evidence on the impact of these telemedicine services.
Methods
Overview
This review adopted a scoping review methodology to map the breadth of telemedicine initiatives in India and generate insights into their design, implementation, and reported impact. In keeping with the objectives of scoping reviews, no formal assessment of risk of bias or methodological quality was undertaken []. The review was conducted in accordance with the framework proposed by Arksey and O’Malley [] and reported following the PRISMA-ScR (Preferred Reporting Items for Systematic Reviews and Meta-Analyses extension for Scoping Reviews) guidelines, as given in .
Search Strategy
A comprehensive and multisource search strategy was used to identify telemedicine services in India. The primary information sources were the 3 major scientific databases, such as Embase, PubMed, and Scopus. Additionally, a Google web search was conducted to identify gray literature and programmatic reports, and the Google Play Store was searched to capture relevant mobile health applications. The reference lists of included articles were also reviewed to identify additional eligible studies. This combined approach ensured that both published evidence and real-world implementations not indexed in traditional databases were included. Detailed search strategies for each source are provided in .
Eligibility Criteria
Telemedicine was defined as including (1) a health care expert (doctor, nurse, physical therapist, or nutritionist) who makes (2) decisions tailored to a specific patient profile, through (3) a digital solution, including phone, computer, or tablet. “Formal” telemedicine services were defined as digital communication sanctioned by the organization and used according to a protocol. Telemedicine services were further categorized based on the reported scale of their implementation and considered to be moderate to large in scale if they met one or more of the following criteria: (1) a minimum of 1000 app downloads or patients reached, catered to, or consultations conducted, and (2) implemented in >1 hospital or geographical location.
Included telemedicine services were restricted to those that included humans, were published in the English language between January 1, 2010, and July 4, 2023, and pertain to services in India. Studies were excluded if they (1) were 1-way direct-to-beneficiary applications that provide information only, (2) relied on informal technology use by providers, such as personal telephone calls or patient contact solely on publicly available chat applications (eg, WhatsApp), (3) focused on data capture, workflow support applications, clinical decision-making algorithms, or job aids, including those that use artificial intelligence to render a diagnosis or are used by providers to screen patients in the course of home visits, (4) pertained to e-training or e-mentoring services, or (5) self-monitoring services, including those involving artificial intelligence or chatbots. Articles focusing solely on the technical specification of internet connectivity, book reviews, and conference proceedings were also excluded.
Study Selection and Data Charting
Once identified, articles were imported to Covidence (Veritas Health Innovation Ltd), and the process of abstract screening was initiated using 2 independent reviewers and a third person to resolve conflicts. Full-text articles were screened by 2 independent reviewers and a third person to resolve conflicts. Data from the full-text articles were extracted into Microsoft Excel. To ensure alignment across reviewers with the data extraction, weekly meetings were held across the study team. Senior investigators additionally conducted spot checks of articles to review their classification and the data extracted.
Data Items
summarizes the extraction domains across three broad categories: (1) model type, (2) model characteristics, and (3) reach and impact. The model type includes the health delivery sector (public, private, or public-private partnership [PPP]) and the WHO classification type (provider-to-provider, patient-to-provider, or both). Model characteristics include key stakeholders, services provided, timing of delivery, service delivery channel, licensing provisions, monitoring, and learning and evaluation activities. Reach and impact include details on the scale of implementation and evidence on effectiveness where reported.
Figure 1. Extraction domains used for assessing telemedicine model type, model characteristics, and reach and impact. MLE: monitoring, learning, and evaluation.
Critical Appraisal of Evidence
Given that this is a scoping review and not a systematic evidence synthesis or meta-analysis, we did not assess the quality of evidence reported in individual articles. Rather, the goal of this scoping review was to identify the full range of telemedicine services, including those for which peer-reviewed articles have not been published. Findings from peer-reviewed articles on the effectiveness of telemedicine sought to provide a broad overview of the landscape of evidence across disparate types of research and areas of inquiry.
Synthesis of Results
Efforts to synthesize details on the model characteristics of the telemedicine service sought to follow the framework in . Efforts to collate evidence on effectiveness drew from the evaluation categories depicted in WHO’s guidance on the monitoring and evaluation of digital health interventions [].
Results
Overview
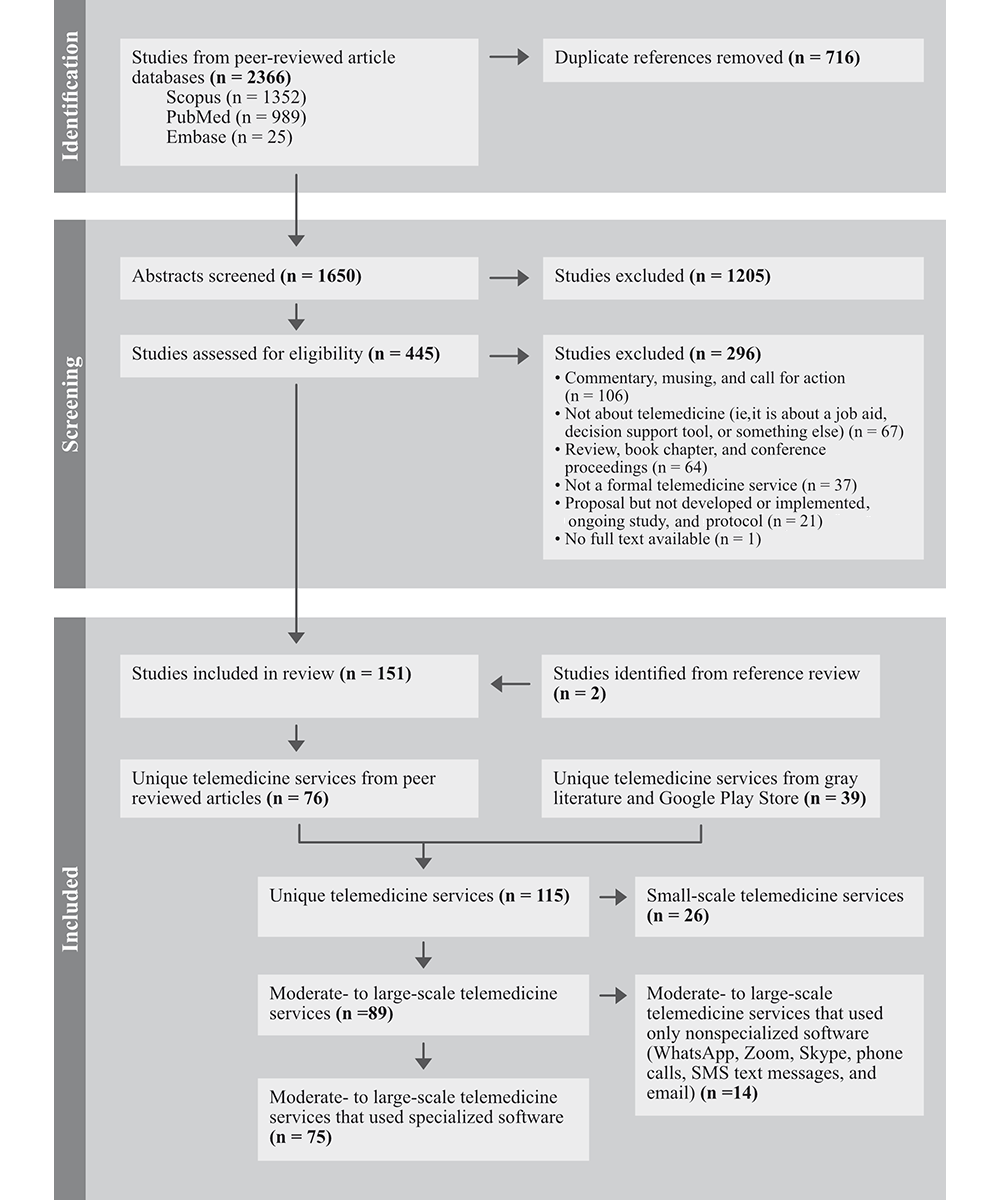
The PRISMA (Preferred Reporting Items for Systematic Reviews and Meta-Analyses) flow diagram in provides a summary of the screening process. From the peer-reviewed article databases, 2366 articles were identified, and after the exclusion of 716 duplicates, the abstracts from 1650 articles were screened for eligibility. Of these, 1205 were excluded, and 445 articles were deemed eligible for full-text review. A total of 151 studies were included for the full-text review and data extraction, including 2 articles identified from the references of other articles.
Figure 2. PRISMA (Preferred Reporting Items for Systematic Reviews and Meta-Analyses) flow diagram.
To identify unique telemedicine services, we categorized peer-reviewed articles by name and additionally reviewed the gray literature and Google Play Store. A total of 115 unique telemedicine services were identified (76 from the peer-reviewed literature and 39 from gray literature and the Google Play Store). Unique telemedicine services were further classified based on (1) scale and (2) reported use of specialized software. Among the 115 unique services, 89 (77%) were classified as being moderate to large in scale, and 26 (23%) were small. Large scale is operationalized as those services that met one or more of the following criteria: (1) a minimum of 1000 downloads, patients, or consultations, and (2) implemented in >1 hospital or geographical location. Among the 89 moderate- to large-scale services, 75 used specialized software and 14 used nonspecialized software, such as WhatsApp. The tables and figures that follow present extracted data for the unique moderate- to large-scale services that reported using specialized software (n=75).
Characteristics of Telemedicine Services
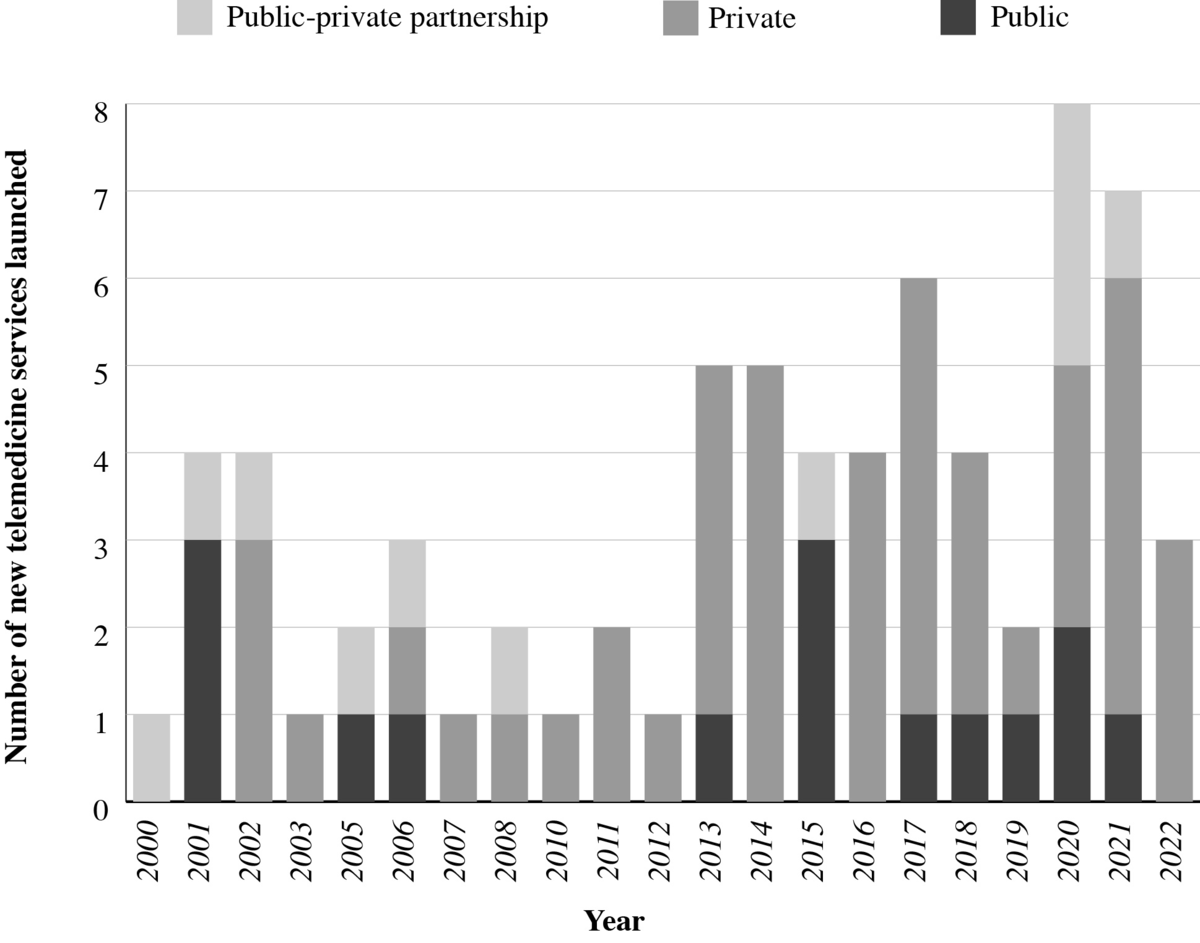
shows the distribution of moderate- to large-scale unique telemedicine services using specialized software initiated or launched between 2000 and 2023. On average, 3 new telemedicine services were initiated annually from 2000 to 2019, and the growth of new services occurred predominantly in the private sector. The start of the COVID-19 pandemic in 2020 corresponds to an increase in the number of new telemedicine services.
Figure 3. Number of moderate- to large-scale unique services using specialized software initiated over time.
Model Characteristics
presents summary characteristics of moderate- to large-scale telemedicine services using specialized software in India. Out of 75 services, 64% (48/75) were delivered by the private sector, while 19% (14/75) were public sector and 17% (13/75) were PPP. Nearly half (37/75) of the services were provided through a patient-to-provider model, 24% (18/75) provider-to-provider, and one-third (20/75) using both patient-to-provider and provider-to-provider models. Services were provided in real time (synchronous) for 69% (52/75), while 28% (21/75) of services delivered both synchronous and asynchronous services, and 3% (2/75) delivered only asynchronously. While most services (52/75, 69%) offered multispecialty care covering 2 or more health domains or conditions, one-third (23/75) focused on condition-specific care (eg, ophthalmology or mental health). All services in both public (14/75, 19%) and PPP (13/75, 17%) sectors were provided with limited (nominal charges for outpatient registration) to no fees. In the case of private sector services (n=48), service fees ranged from US $2.40 (INR 200) to US $7.21 (INR 600) per service, and for some services, monthly subscription fees ranging from US $18 to US $32 (INR 1500-3000) were charged depending upon the services beneficiaries subscribed to. For some private sector telemedicine services, beneficiary charges occurred indirectly through the purchasing of insurance and other employee wellness schemes.
Table 1. Characteristics of moderate- to large-scale telemedicine services using specialized software in India (n=75).
Telemedicine service characteristics
Values, n (%)
Health delivery sector
Public
14 (19)
Private
48 (64)
Public-private partnership
13 (17)
Model type per WHOa classification
Provider-to-provider
18 (24)
Patient-to-provider
37 (49)
Both
20 (27)
Timing of delivery
Synchronous or real-time
52 (69)
Asynchronous
2 (3)
Both
21 (28)
Health domain or condition
Multispecialty
52 (69)
Condition specific (eg, ophthalmology or mental health)
23 (31)
aWHO: World Health Organization.
Key Stakeholders
outlines the details of key stakeholders engaged in the implementation of moderate- to large-scale telemedicine services. The earliest telemedicine services involving the public sector were initiated by the ISRO with support of other government bodies, including the Department of Information Technology, Ministry of External Affairs, Ministry of Health and Family Welfare, and the state governments []. More recent telemedicine services have been led by the Ministry of Health and Family Welfare at the national level, in coordination with state governments for implementation (14/75, 19%). The public sector included both models of service delivery, that is, patient-to-provider (5/14) and provider-to-provider (2/14). In contrast, the majority of private sector services (48/75, 64%) were patient-to-provider (30/48), through one of two categories: (1) networks of hospitals (16/48, 33%) or (2) technology service providers (32/48, 67%) who created technology solutions. The latter included business-to-business for third-party health care providers (n=8) and business-to-consumer technology solutions for patients and providers (n=24).
Table 2. Key stakeholders of moderate- to large-scale unique telemedicine services using specialized software (n=75).
Health delivery sector
Public (n=14), n (%)
PPPa (n=13), n (%)
Private (n=48), n (%)
Model type
Provider-to-provider
2 (14)
5 (38)
11 (23)
Patient-to-provider
5 (36)
2 (16)
30 (62)
Both
7 (50)
6 (46)
7 (15)
Implementing organization
Networks of hospitals
N/Ab
N/A
16 (33)
Technology service providers (B2Bc)
N/A
N/A
8 (17)
Technology service providers (B2Cd)
N/A
N/A
24 (50)
Clinical and service providers
MBBS doctors or higher-level specialists
14 (100)
13 (100)
48 (100)
Dentists
0 (0)
0 (0)
11 (23)
AYUSHe practitioner
1(7)
1 (8)
7 (15)
Allied health services
4 (29)
4 (31)
11 (23)
Patients (age group)
All age groups
13 (93)
13 (100)
48 (100)
Specific (pediatric)
1 (7)
0 (0)
0 (0)
aPPP: public-private partnership.
bN/A: not applicable.
cB2B: business to business.
dB2C: business to consumer.
eAYUSH: Ayurveda, Yoga and Naturopathy, Unani, Siddha and Homeopathy.
All 75 (100%) telemedicine services had MBBS doctors or higher-level specialists as clinical providers, while 25% (19/75) included access to allied health services, 13% (10/75) to dentists, and 12% (9/75) to AYUSH (Ayurveda, Yoga and Naturopathy, Unani, Siddha, and Homeopathy—the 6 Indian systems of medicine) practitioners. Among beneficiaries, only 1 telemedicine limited services to pediatric patients, while the remainder (74/75, 99%) catered to patients of all age groups. Technology, monitoring and evaluation, and funding of the services were either not reported or limited. Detailed description of key stakeholders for each telemedicine services is provided in Multimedia appendix 3.
Scale of Implementation
The scale of implementation for the moderate- to large-scale telemedicine services using specialized software is summarized in . Services reported their scale of implementation using a wide range of parameters, and no common standard has yet been developed. Thus, we gather information on scale across the following parameters based on available information: (1) geographic areas (state and districts) of implementation, (2) number of registered providers, (3) number of spokes and hubs, (4) number of patients served or treated, (5) number of consultations (overall or daily) or prescriptions, and (6) number of downloads on the Google Play Store. Information for at least 1 scale parameter was reported in 75 telemedicine services.
Among public sector services, as of July 19, 2023, eSanjeevani reported the largest number of registered providers (n=185,100) and health facilities (>100,000 primary health clinics and >13,000 secondary and tertiary hospitals) and is operational across 31 states and union territories across India. The total number of patients served was reported to exceed 138 million, and over 10 million consultations were carried out from November 2019 to July 2023. Among PPP models identified, Apollo telehealth services reported providing services in over 350,000 telemedicine centers, Apollo clinics, and common service centers, and 73 Apollo hospitals across 14 states in India. From 2000 to 2023, Apollo services reportedly reached over 13 million patients and delivered over 16 million teleconsultations. Among private sector–only models (n=48), 17% (8/48) reported having conducted over 1 million consultations. Practo, a private sector service that launched in 2008, provides services through over 0.1 million doctor partners. provides a brief overview of the 5 largest telemedicine services in India that use specialized software.
Textbox 1. Overview of the 6 largest telemedicine services in India that use specialized software.
eSanjeevani
Public
Largest
Model type: patient-to-provider and provider-to-provider, along with assisted telemedicine service
Provides chat and audio-video consultations, real-time and asynchronous telemedicine, free of cost, with state service doctors, Ayushman Bharat Health Account integration, a multilingual interface, and health services covering allopathic care and Ayurveda—with variation across states, where some also include Homeopathy. Available as mobile and web-based application and facility-based online system. Implemented as hub-and-spoke model, where hubs are either secondary or tertiary care centers (community health centers, district hospitals, or medical college hospitals), dedicated telemedicine centers, or primary health centers, and spokes are Ayushman Bharat health and wellness centers.
Indian Space Research Organization (ISRO)
Public-private partnership (PPP)
First telemedicine network
Used satellite communication
Model type: provider-to-provider, along with assisted telemedicine service
Provides audio-video consultations, real-time telemedicine, free of cost, state service and private specialist doctors, and allopathic health services. Available through facility-based online system. Implemented as hub-and-spoke model, where hubs are specialty hospitals (government and corporate) and spokes are remote, rural, or district hospitals or telemedicine mobile units.
National Telemedicine Network
Public
First fiber-optic–based telemedicine network
Model type: provider-to-provider
Provides audio-video consultations, real-time telemedicine, free of cost, state service doctors, and allopathic services. Available through facility-based online system. Implemented as a tiered hierarchy of support, wherein primary health centers and community health centers were upgraded with broadband to provide telemedicine services, district hospitals provide telemedicine support to these community-level facilities, and super specialty hospitals (All India Institute of Medical Science) and medical colleges provide a further tier of support.
Apollo group of hospitals
Private and PPP
First PPP-based telemedicine provider
subsidiary of the largest hospital network
Model type: patient-to-provider and provider-to-provider, along with assisted telemedicine service
Provides audio-video consultations, real-time telemedicine, state service doctors in PPP, private specialist doctors, and allopathic services. Available as mobile and web-based application and facility-based online system. Implemented as hub-and-spoke model, where hubs are superspecialty Apollo hospitals, including Apollo Chennai and Apollo Hyderabad, and spokes are (1) Apollo clinics and Apollo telemedicine centers (private model) and (2) mostly government health centers (PPP model). Patient-facilitated subset of common service centers serves as access points created under the National e-Governance project of the Government of India. Other facilities include ordering medicines over the internet through Apollo pharmacies and patient bookings over the internet through the Ask Apollo application across India.
Aravind Eye Care (teleophthalmology)
PPP
Model type: provider, along with assisted telemedicine service
Launched as a PPP model in partnership with ISRO as a mobile eye unit. Later established a private sector model as the Aravind teleophthalmology network. Network of eye hospitals with primary care vision centers, as well as secondary and tertiary specialty centers. An example of a disease-specific telemedicine service.
Provides audio-video consultations, real-time and asynchronous telemedicine, private specialists, and allopathic services. Implemented as hub-and-spoke model, where hubs are Aravind eye hospitals, including Madurai and Chennai, and spokes are (1) vision centers across Coimbatore, Tirunelveli, and Madurai in Tamil Nadu; (2) community outreach via mobile eye care units and eye camps; and (3) selected diabetic centers across Tamil Nadu for diabetic retinopathy screening.
Practo
Private
Launched as a platform for booking doctor appointments, which evolved to include a telemedicine application
Largest online directory of doctors
Model type: patient-to-provider
Provides audio-video consultations, real-time telemedicine, cost per service, allopathic and AYUSH (Ayurveda, Yoga and Naturopathy, Unani, Siddha, and Homeopathy) health services, and private doctors enrolled in Practo working in various clinics or hospitals across selected cities in India. Available as a mobile and web-based application. Other facilities include a hospital and clinic management system that is compliant with Ayushman Bharat, a patient management application, and the ability to order medicine and laboratory tests online. The platform is ISO 27001 certified, and its data centers are Health Insurance Portability and Accountability Act (HIPAA) compliant.
Over a quarter (21/75, 28%) of the moderate- to large-scale services that used specialized software were being implemented in 1 state. The remaining services are implemented in multiple states—17% (13/75) in fewer than 10 states and 12% (9/75) in 10 or more states—or did not report any geographical location (4/75, 5%). All telemedicine service applications identified from the Google Play Store (28/75, 37%) were accessible in all states across India. However, for some of these (7/28, 25%), accessibility within states was limited to either major cities or certain parts of the state.
Beyond the distribution of telemedicine services across and within states, information on the number of “registered” or “active” providers was reported for only 20% (15/75) of services. For those services that reported this information, the number of active or registered providers ranged from 5 to 0.5 million, with 33% (5/15) reporting 100,000 or more providers. Telemedicine reach in terms of the number of patients served, treated, or “lives saved,” or the number of consultations or prescriptions provided, was reported for 61% (46/75) of services. For the 46 services that reported reach, 36 (78%) served less than 1 million patients or provided consultations, 8 services had between 10 and 20 million, and only 2 services reported more than >100 million patients served (eSanjeevani and Practo). Among the telemedicine applications in the Google Play Store, 61% (17/28) had fewer than 1 million downloads, and 39% (11/28) had more than 1 million, ranging up to >100 million downloads (4 telemedicine services).
Evidence on Effectiveness
We examined peer-reviewed research articles for evidence on the effectiveness of the 75 moderate- to large-scale telemedicine services. We considered an article to include evidence of effectiveness if it provided information on processes, outcomes, or impact. This included but was not limited to studies on reach, quality of care, economic evaluation, or provider or patient perceptions of the service. Details on the evaluation were extracted, including study design, methods, and findings ().
Table 3. Summary of evidence on effectiveness.
Evidence of effectiveness
Moderate- to- large-scale telemedicine services reporting effectiveness (n=75), n (%)
Articles reporting on effectiveness (n=84), n (%)
Inputs
Technological readiness
20 (27)
34 (40)
Patient readiness
6 (8)
9 (11)
Provider readiness
15 (20)
28 (33)
Structural readiness
14 (19)
17 (20)
Processes
Technical care
14 (19)
20 (24)
Interpersonal and respectful care
11 (15)
21 (25)
Technological performance
9 (12)
11 (13)
Patient-provider engagement with technology
5 (7)
8 (10)
Outcomes
Experience of care
17 (23)
36 (43)
Costs, time savings
14 (19)
25 (30)
Health outcomes
24 (32)
52 (62)
Provider capacity (at the spoke level)
3 (4)
5 (6)
Equity
3 (4)
4 (5)
Gender inclusion
2 (3)
2 (2)
Economic evaluation
Cost-effectiveness or cost-utility
6 (8)
7 (8)
Cost outcome (telemedicine service costing analysis)
4 (5)
4 (5)
Data sources
System-generated data analysis
7 (9)
8 (10)
Structured survey (patients and providers)
19 (25)
39 (46)
Qualitative methods: in-depth interviews and focus group discussions
6 (8)
6 (7)
Medical record review
23 (31)
45 (54)
Clinical observation
3 (4)
3 (4)
Vignettes
1 (1)
1 (1)
Study design
Descriptive
Surveillance
0 (0)
0 (0)
Ecological correlation
0 (0)
0 (0)
Cross-sectional (prevalence)
22 (29)
50 (60)
Case report
6 (8)
6 (7)
Qualitative
6 (8)
6 (7)
Analytic
Experimental with randomization
0 (0)
0 (0)
Quasi-experimental
3 (7)
8 (11)
Observational: cohort
6 (8)
7 (7)
Observational: cross-sectional
8 (12)
10 (13)
Observational: case-control
1 (1)
1 (1)
Evidence on effectiveness was available for 43% (32/75) of the services, reported across 84 articles. PGIMER Chandigarh’s telemedicine service was the most studied in terms of service effectiveness, with 10 articles published. The National Institute of Mental Health and Neuro Sciences Bengaluru telemedicine service was a close second with 7 articles, while 14 of the 32 services with evidence on effectiveness had just 1 published article covering this topic (). See for details by telemedicine service and article.
Evidence on Effectiveness Related to Health Outcomes From Analytic Studies
Given the large number of studies across a range of designs, we focus here on a synthesis of findings from the analytic research on health outcomes. Evidence of the effectiveness of telemedicine on health outcomes (which includes impact on patient access to care, diagnosis, and morbidity) was reported in 52 of 84 articles for 24 of 75 telemedicine service (), of which 18 articles for 11 services provided analytic evidence (see ). The remaining articles reported solely descriptive findings.
Within the set of 18 analytic articles on health outcomes, none were randomized controlled trials. A total of 7 were quasi-experimental studies on 3 services: the Pediatric HIV Telemedicine Initiative in Maharashtra [-], the World Health Partners’ Sky Program in Uttar Pradesh and Bihar [-], and Aravind Eye in Tamil Nadu []. The clinical management of children living with HIV in centers linked with the Pediatric HIV Telemedicine Initiative was better compared to nonlinked centers [-,]. Fewer patients were lost to follow-up at the centers with the Pediatric HIV Telemedicine Initiative, but there was no difference in the proportion of patients with delayed treatment once the telemedicine service reached its later phase of implementation []. The World Health Partners’ Sky Program showed no improvement in the quality and coverage of maternal health services at the population level [], no improvement in treatment for childhood diarrhea and pneumonia, nor reduced prevalence of these diseases before and after implementation [], nor did it change provider knowledge []. Opening an Aravind Eye telemedicine center staffed by mid-level (nonphysician) providers led to a significant increase in overall network visit rates and rates of eyeglasses prescriptions for the population living within 10 km of the new center [].
The 11 remaining analytical studies on health outcomes consisted of 5 observational cohort studies on 5 services [-], 5 observational cross-sectional studies on 5 services [-], and 1 observational case-control study []. Among the observational cohort studies, 2 found that telemedicine was associated with patient improvements; patient mental health scores significantly improved post telepsychiatry treatment in Goa [], and patients showed a significant reduction in hemoglobin A1c (HbA1c) test result from baseline to follow-up while receiving telemedicine support through the Diabetes Tele Management System at Jothydev’s Diabetes and Research Center in Kerala []. One found no significant difference in functional assessment of “overdentures” (dentures anchored to teeth or modified roots) fabricated by newly graduated students who were guided remotely through provider-to-provider telemedicine versus guided in person at a university teaching hospital []. Furthermore, 2 reported that telescreening for retinopathy of prematurity was suitable to assess incidence over time [,].
The observational cross-sectional studies found that the use of telemedicine for diagnosis was equal to in-person models or brought added benefit. The 2 found comparable levels of diagnosis between telemedicine and in-person care: school hearing tests conducted by doctors through a remote audiometer, Distortion Product Otoacoustic Emissions system, and video-otoscope compared to doctors in person [], and diabetic retinopathy screening conducted by doctors through Dr Mohan’s Diabetes Specialties Center’s teleophthalmology compared to doctors in person []. Comparing the diagnosis of head and neck tumors made in person by clinicians at Amrita Institute of Medical Sciences, Kochi, versus remotely by colleagues in the United States found high concurrence, low differential diagnosis, and some additional diagnoses []. Sankara Nethralaya’s telescreening model diagnosed a higher prevalence of diabetic retinopathy compared to the in-person ophthalmologist-based screening camp model and found more sight-threatening retinopathies []. Finally, a higher portion of children went for diagnosis referral to telediagnostic auditory brainstem response (ABR) compared to in-person ABR (97% taken to telediagnostic ABR appointment vs 80% taken to ABR appointment) [].
The observational case-control study compared virtual diabetes care using the Diahome app to hospital outpatient service use and found that app users had a greater reduction in HbA1c (but higher triglycerides throughout) []. The remaining studies on health outcomes were descriptive, describing patient outcomes without a comparator.
Evidence on Costs and Cost-Effectiveness
Data on patient or provider costs for telemedicine services were reported in 21 studies. The predominant means of measuring costs was through structured surveys, which asked respondents about perceived savings of time and money [-], future willingness to pay for teleconsultation costs [], or actual costs incurred. Regarding the latter, in a limited number of studies, a broad range of cost-related outcomes were assessed, including distance traveled to seek care [,-], food and overnight charges [], consultation and clinical costs [,,,,-], waiting time [], and reported lost workdays [-]. These were used to collectively estimate costs and cost savings attributed to telemedicine services from a range of perspectives.
Costing analyses, which presented data on the costs of a single telemedicine service, were reported in 4 articles. These studies sought to present evidence on the telemedicine costs needed to establish the service [,,]. Data on the cost-effectiveness and cost-utility of telemedicine services were reported in 8 articles for 9 moderate- to large-scale services. The methods, including the perspective from which costs and effects were derived, the primary and secondary data sources, the analytic time horizon used, and sensitivity analyses conducted, varied widely across studies, which impeded efforts to draw cross-cutting syntheses of findings.
Discussion
Overview
Scoping review findings led to the identification of 2368 articles from which 151 studies and 115 unique telemedicine services were identified and further categorized based on their scale of implementation and use of specialized software. Among moderate- to large-scale services (n=89), 75 used specialized software in isolation or augmented with telephone calls, WhatsApp, Zoom, and other nonspecialized software. Of these 75 services, 64% (48/75) were in the private sector, and the rest were either public or in partnership with private actors. The patient-to-provider model was the model that nearly half (37/75) of the telemedicine used to deliver their services. Telemedicine services were provided in real time (synchronous) for 69% (52/75), and 28% (21/75) delivered both synchronous and asynchronous services. Evidence was available for 43% (32/75) of the services.
Efforts to differentiate telemedicine services based on their scale of implementation and use of software sought to narrow emphasis in a crowded space, removing the “‘noise” of services established ad hoc within a limited geography or health setting, or without the software arguably needed to scale or accommodate the structural and procedural access controls for handling sensitive personal health data. Use of nonspecialized software may stem from user preferences, wherein providers and patients are more comfortable using existing software already on their phones, or may be driven by specialized software shortcomings. In situations where the specialized software crashes or has limited functions (ie, is only suitable for booking appointments or cannot be used for bidirectional sharing of photos and documents), patients and providers may shift to nonspecialized software. This ongoing use of nonspecialized software has enabled telemedicine services to scale but may have some drawbacks. Using specialized software allows each consultation to be integrated with electronic medical records, enabling backend data on call duration and other parameters to be tracked. In cases where the use of nonspecialized software persists, facilities may want to ensure that providers use telemedicine only on official phones, thereby protecting patient data and ensuring separation of work and personal life for providers.
Data on the typologies of telemedicine models sought to distinguish between provider-to-provider, patient-to-patient, and hybrid models. The fact that public sector services used both models suggests that telemedicine is being operationalized as a health system–strengthening intervention in addition to improving patient access to services by the government. By comparison, in the private sector, the implementation of telemedicine services seemed to focus on the use of telemedicine to expand accessibility and reach.
We found that many departments in large hospitals such as AIIMS New Delhi, Jawaharlal Institute of Postgraduate Medical Education and Research, PGIMER Chandigarh, and Apollo used the hospital-wide telemedicine services in different ways, according to their department’s needs. For instance, at AIIMS New Delhi, we found that 6 departments were using telemedicine and that some had used it for over 6000 patients (eg, pediatrics) [], while others had used it for just 314 (eg, oncology palliative medicine) []. Some reported using only special software, while others reported augmenting this software with WhatsApp or telephone calls.
Study findings on the evolution of telemedicine services in India cement India’s place as a global leader in the use of technology for health. In other low-resource settings, the field is characterized by fragmentation and driven by private sector and nongovernment organization–led models with limited scale and reach. Nigeria is home to several telemedicine initiatives, including the World Telehealth Initiative [], which aims to expand health care access through a clinical mentorship service in Opoji, Nigeria, and Hudibia (established in 2013), which is an application-based solution that allows users to search and see doctors through videoconferencing or to book a face-to-face appointment []. In Ghana, a recent review of telemedicine services [] identified a small number of services, including Bima, which uses a direct-to-patient model to provide health advice and succinct health education to Ghanaians. Elsewhere regionally, HelloDoctor in South Africa [] and Babyl Rwanda [] are private sector models that aim to bolster access to medical doctors and nurses as well as a range of clinical and laboratory services directly to the phones of beneficiaries. Data on the uptake of these services are limited.
The wide breadth and variety of telemedicine services, including public and private sector–led and types of telemedicine models (patient-to-provider or provider-to-provider), render comparisons challenging. However, India is unique for a number of reasons. From a supply-side perspective, the government is investing heavily in national telemedicine services via eSanjeevani (established in 2019), which includes both a patient-to-provider and a provider-to-provider model. While there is limited evidence on the reach and impact of both eSanjeevani models, the service has scaled widely [] with support from Ayushman Bharat Digital Mission and other government initiatives. From a demand side, less than half of women in India report having access to a mobile phone that they themselves can use []. Further barriers to women’s use of technology [] are likely to limit the reach and use of patient-to-provider telemedicine services in India, particularly in rural areas. Emerging data on the limited uptake of eSanjeevani’s patient-to-provider model reinforces these challenges.
Limitations
The large volume of studies has necessitated that we narrow our focus to unique telemedicine services that are moderate- to large-scale and report using specialized software. The central challenge in reporting the scale was that few services publicly list information on the scale of implementation, including the number of active providers and consultations completed. Those that do have listings have varied definitions for key constructs. For example, unique consultations versus the number of patients treated, and active versus registered providers. While we extracted information on the reported evidence generation, given the volume and variety of methodological approaches undertaken, we have not taken into account the quality of evidence reporting.
Conclusions
The widespread proliferation of telemedicine services in India has much potential to improve access to and continuity of timely and appropriate care seeking for health. However, our findings highlight significant limitations in evidence generation and reporting. Future research is needed to bolster independent evidence gathering on the impact that telemedicine services may have in bolstering equitable access to timely, continuous health services of equivalent or better quality than face-to-face services. Further data on costs to beneficiaries, including any cost savings, as well as assurances that remote service delivery does not compromise beneficiary experiences, are needed.
The authors would like to thank the Gates Foundation’s India Country Office for providing funding support and important insights used to optimize the presentation of findings. We thank Dan Harder of the Creativity Club UK for his efforts to improve the figures presented. We also extend our thanks to Jai Mendiratta for his support in facilitating the work.
Data curation: OU (lead), AL (equal), KS (equal), AS (supporting), AK (supporting), DM (supporting)
Writing—original draft: OU (lead), AL (equal), KS (equal), DM (supporting), AS (supporting), AK (supporting)
All authors have read and approved the final version of the manuscript.
None declared.
Edited by T Leung, G Eysenbach; submitted 09.Jul.2024; peer-reviewed by A Orchanian-Cheff, A Venkataraman, M Sadiq; comments to author 08.Nov.2024; revised version received 05.May.2025; accepted 28.Aug.2025; published 15.Oct.2025.
This is an open-access article distributed under the terms of the Creative Commons Attribution License (https://creativecommons.org/licenses/by/4.0/), which permits unrestricted use, distribution, and reproduction in any medium, provided the original work, first published in the Journal of Medical Internet Research (ISSN 1438-8871), is properly cited. The complete bibliographic information, a link to the original publication on https://www.jmir.org/, as well as this copyright and license information must be included.
This request seems a bit unusual, so we need to confirm that you’re human. Please press and hold the button until it turns completely green. Thank you for your cooperation!
This request seems a bit unusual, so we need to confirm that you’re human. Please press and hold the button until it turns completely green. Thank you for your cooperation!
This request seems a bit unusual, so we need to confirm that you’re human. Please press and hold the button until it turns completely green. Thank you for your cooperation!
Physical activity is associated with numerous benefits among older people [-] and is a key recommendation for promoting healthy aging []. Advancing age is associated with increasing diversity and variability across a wide range of biological, physiological, functional, and performance measures—an expression of the growing disparity between biological and chronological age which typifies aging [,]. Accordingly, the effectiveness of current exercise (structured, purposeful physical activity) guidelines [,], which adopt a “one-size-fits-all” approach, is questionable, with protagonists emphasizing the need for a personalized approach [].
An additional limitation of current guidelines is the lack of detailed attention concerning fitness components other than cardiovascular fitness [,]. While guidelines specify the duration, intensity, and frequency of aerobic exercise, minimal guidance exists concerning optimizing balance, strength, and flexibility—all crucial factors for preserving functional integrity with advancing age. In particular, the absence of accurate individualized assessments of these components outside a laboratory setting hinders the transition from generalized to personalized exercise programs for older adults.
The potential contribution of artificial intelligence in shaping personalized medicine is of current interest, including the promotion of personalized physical activity [,]. Nonetheless, it remains a fact that current physical activity guidelines are manually formulated, generic, and focus on group rather than personalized exercises.
To address these limitations, we developed a novel home-based approach to personalized exercise programs for older adults, utilizing a simple smartphone that obviates the need for a laboratory or professional intervention. Through smartphone accelerometer and gyroscope sensors, we remotely assess key components of motor fitness, including balance, flexibility, and strength. Based on these assessments, a machine learning–generated personalized exercise program, tailored to each individual’s needs, was delivered via video directly on the smartphone.
We previously described the design, development, validation, and pilot study results [-]. Briefly, an interdisciplinary expert panel selected motor components and standard movement tests for remote fitness assessment. These were incorporated into a user-friendly smartphone app, which provided simple audiovisual instructions for self-testing, recorded the test results, and uploaded the raw data to a remote study database, where machine learning was used to create a unique fitness profile for each participant. In order to create personalized exercise programs, we developed a collection of exercises specifically designed for older adults, spanning the different movement abilities (balance, flexibility, and strength) and graded according to difficulty. According to the participants’ unique fitness profile, a tailored selection of exercises was chosen using machine learning, uploaded to the app, and remotely delivered to the study participant via the study app. With repeated fitness testing and ongoing data collection, the precision of machine learning for matching fitness profile to tailored exercise programs is constantly improving.
In this study, we tested the implementation of our approach in a randomized controlled trial. Our objective was to investigate the effectiveness of an 8-week, remotely delivered personalized exercise program based on individual fitness assessments, compared to either WHO general guidelines (active-control) or no intervention (control). We hypothesized that participants in the personalized experimental group would show greater improvements in balance, flexibility, and strength than those in the active-control and control groups. Specifically, we anticipated a reduction in body sway during balance tests, an increased range of motion in flexibility, and faster lifts of the body or arms in strength. The real-life implications and subsequent benefits of improvements across this range of motor fitness components are notable. Thus, for example, well-established evidence highlights that balance improvement is critical for fall prevention [,,], while flexibility [,] and strength [,] are essential for performing activities of daily living.
Methods
Study Design
A randomized controlled trial was conducted, with participants randomly assigned to three groups: (1) experimental group (personalized exercise); (2) active-control group (World Health Organization [WHO] general exercise guidelines); and (3) control group (no intervention).
Sample Size Predetermination
Based on a statistical power analysis using G*Power [], our target was to enroll 300 participants, with 100 in each of the 3 treatment groups (see more details in our protocol paper []). However, to maintain methodological rigor, we later conducted a more precise power analysis based on the actual number of participants included in the statistical analyses (see Results section).
Participants
The study was conducted in a community setting (private homes and independent living facilities) in central and northern Israel, including both urban and agricultural settlements. Recruitment included local flyers and lectures delivered by the principal investigator in community clubs, senior centers, cultural centers, or other local gathering places. Participant enrollment was carried out by the study team, which consisted of 6 testers and a study manager.
From a total of 317 volunteers, 239 community-dwelling, healthy older adults (155 women), aged 72.63 (SD 5.38) years, completed the 8-week study intervention, and 230 completed the full 12-week follow-up. Inclusion criteria were (1) age 65+ years, (2) independent living, (3) independent walking, (4) fluent in Hebrew, and (5) smartphone competency. Exclusion criteria included (1) cognitive impairment (Mini-Cog score <3) [], (2) any hospitalization (>24 h) or emergency room visit within past year for cardiac (heart failure, rhythm disorder, ischemia, valvular disease) or neurological conditions (dizziness, cerebrovascular, vestibular, progressive diseases affecting gait or balance), and (3) high fall risk (≥1 positive answer from 3-item test), validated in community-based exercise intervention and fall-prevention studies []. Data collection included demographics, self-reported habitual physical activity, depression status (Geriatric Depression Scale) [], and frailty index [].
Ethical Considerations
The study design, procedures, and informed consent were approved by the Hadassah Hebrew University Hospital Ethics Committee, Jerusalem, Israel (Trial ID 0074‐19-HMO), and were conducted according to the ethical standards of the Helsinki Declaration.
Informed Consent
Written informed consent was attained following a detailed explanation given by the study physician and included instructions on how to act in case of any possible medical complications arising either directly (eg, risk of falls and fractures, musculoskeletal pains, strained ligaments) or secondary to the exercise programs (eg, cardiac arrhythmias or angina). Participants were informed of their freedom to opt out.
Privacy and Confidentiality
Each participant was assigned a unique study identification number. The key linking these numbers to participant identities was stored separately by the principal investigator. All data were subsequently deidentified.
Compensation Details
Participants did not receive any compensation.
Randomization
We used a permuted block design [] with 2 stratification factors (age: 65‐74 and 75+ years; gender: men and women), each block included 6 participants, 2 per group. Block distribution was adjusted using the minimization principle [] in order to address randomization imbalance. More specifically, as there were 6 testers, and each tester had his or her randomization table. This process was supervised by an advanced student (EB).
At a certain point, we realized that few testers had the first participants on the control group, and the control group became a lot larger than the other groups. Based on the minimization principle, we changed the block distribution to 2 experimental, 2 active-control, and only 1 control (5 participants in a block).
Outcome Measures
The motor components chosen for remote fitness assessment were postural control (stability) while standing (static balance) or moving (dynamic balance), strength (muscle endurance) of upper and lower body, and range of motion of upper body (flexibility). The following standard movement performance tests were selected to assess these components:
Static balance: Leg stance (single leg stance left and right) for 10 seconds.
Static balance: Tandem stance—one foot directly in front of the other (left foot forward and right foot forward) for 20 seconds.
Dynamic balance: Tandem walk forward (10 steps) and tandem walk backward (10 steps).
Upper body flexibility (torso rotation): Seated position, holding a ball between thighs and baton in hands in front of chest for stabilization []; maximal torso rotation to left and right.
Upper body flexibility (arm flexion): Seated position, armless chair, back against wall; lifting straight arm (right and left separately) forward and up, trying to reach the ear.
Upper body flexibility (arm extension): Standing position, face towards wall, all front body against wall; lifting straight arm (right and left separately) backward as far as possible.
Upper body strength (arm strength): Seated position on an armless chair, a 0.5 kg weight for women and 1 kg for men attached to wrist; lifting straight arm (left and right separately) forward up to shoulder height as fast as possible 20 times and to the side 20 times.
Lower body strength (sit-to-stand): From sitting position, hands on waist, stand and sit 10 repetitions.
Instructions were incorporated into a smartphone app developed by Montfort Brain Monitor Ltd. Movement was captured by smartphone accelerometer and gyroscope sensors by attaching the mobile phone to the relevant body part using a simple band (see : tandem walk forward, arm flexion, arm extension, arm strength).
Figure 1. Examples of phone placement in tandem forward, arm flexion, arm extension, and arm strength.
Digital Markers
The specific digital markers (DMs) generated from the phone for each test are as follows:
Balance tests (Tests 1‐3): Five DMs that assess body sway, with lower scores indicating less sway and better performance:
Average linear acceleration (m/s²), generated by the accelerometer in the mediolateral direction.
Average linear acceleration (m/s²), generated by the accelerometer in the anterior-posterior direction.
Angular (radial) velocity, assessed in radians per second (rad/s), generated by the gyroscope in the mediolateral direction.
Angular (radial) velocity, assessed in radians per second (rad/s), generated by the gyroscope in the anterior-posterior direction.
Angular (radial) velocity, assessed in radians per second (rad/s), generated by the gyroscope in the superior-inferior direction.
Torso rotation (Test 4): The angle (peak pitch) in the superior-inferior direction. A greater angle indicates a larger range of motion and better performance.
Arm flexion (Test 5): The angle between the arm and the horizon (peak yaw in the anterior-posterior direction).
Arm extension (Test 6): The angle between the arm and the horizon (peak yaw in the anterior-posterior direction). A greater angle indicates a larger range of motion and better performance.
Arm strength (Test 7): Average duration for 20 repetitions, measured in seconds. A shorter duration indicates better performance.
Sit-to-stand (Test 8): Average duration for each repetition, measured in seconds. A shorter duration indicates better performance.
Detailed information and graphical demonstrations of the DMs have been previously published [,].
Study Procedure
Data collection started in November 2020 and ended in September 2023. Following informed consent, demographic/clinical data collection, and randomization, baseline fitness (T0) was assessed using the study app. Fitness levels across the study measures were determined (low versus high), and assessment was repeated at 4 weeks (T1), 8 weeks (T2), and 12 weeks (follow-up T3). The assessment was conducted by 6 qualified physical activity teachers, each trained to use the app for testing participants individually and supervised by the study manager, a senior physical activity teacher. The app was installed on the teachers’ (testers’) smartphones, and the test results were automatically streamed to the database. All study participants (the personalized exercise group, the active-control group, and the control group) were tested. The testers and participants were blinded to the test results. Participants received weekly phone calls from the teachers to maintain contact and motivation. There were no issues of safety or other issues reported.
Intervention Groups
Personalized Exercise (Experimental Group)
Participants in the experimental group received their personalized exercise program based on their fitness assessment. The personalized program, including clear instructions regarding the performance of the exercises, was delivered to the participants’ personal smartphones immediately after the testing. The testers explained to the participants, on an individual basis, how to use the app on their personal smartphones for exercising. Following our pilot study [], and according to evidence concerning the advantages of exercising >3×/week [,], we instructed participants to exercise 5×/week for 8 weeks. Their video exercise program covered three target categories: (1) balance and lower body, (2) upper body flexibility, and (3) upper body strength exercises. Two difficulty levels, A (simple) and B (advanced), were matched according to fitness assessment. For an example of exercise displayed on a smartphone, please see . Additional examples have been described previously [].
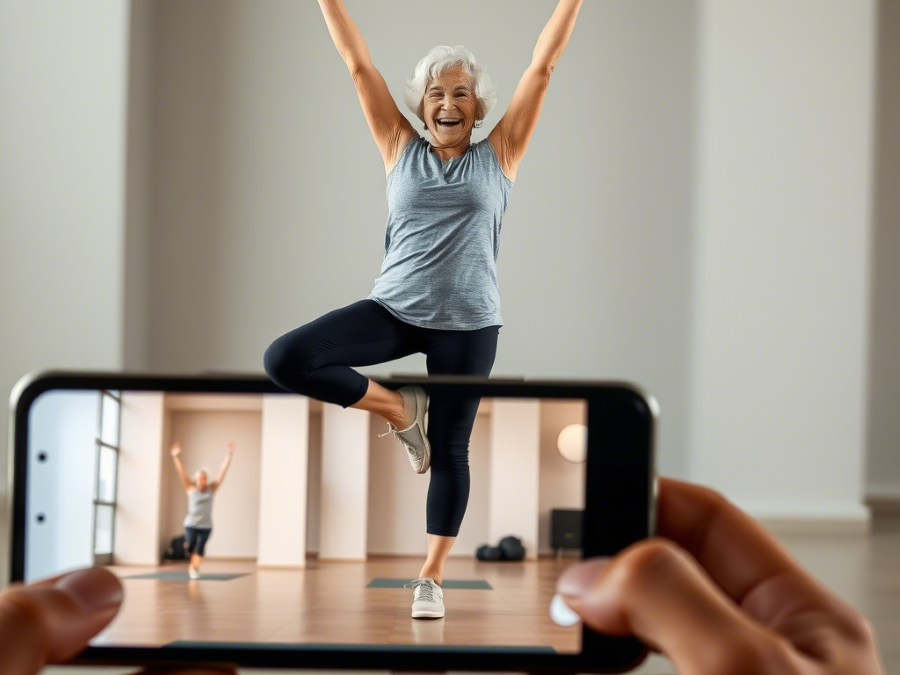
Figure 2. Practicing at home with the exercise displayed on the phone.
General Exercise (Active Control Group)
Participants were individually counseled and advised to exercise for 8 weeks according to official WHO guidelines []. Specifically, they were asked to perform leisure-type aerobic exercise for 150‐300 minutes or vigorous-intensity exercise for 75‐150 minutes/week. Examples such as walking, jogging, and cycling were given. In addition, they were asked to perform ≥3 sessions/week of multicomponent physical activity that emphasizes functional balance and strength training at moderate or greater intensity. They received the following examples of balance exercises: standing on toes, one-leg stance, walking while lifting the knee, walking backward, and side walking while bending and extending the knees. Examples of strength exercises included the following: (1) in a standing position—lifting the leg to the side (abduction), extending a straight leg backward, lifting a straight leg forward, sit-to-stand movements—and (2) against a wall—pushing the body away from the wall using the hands, lifting the arms to the side, optionally with dumbbells.
Control Group
Participants were advised to continue their normal routine. A personalized exercise program was offered after study completion.
Matching Fitness Level With Exercise Prescription for the Personalized Exercise Group—A Machine Learning Approach
Data from the pilot study [] served as a baseline for large-scale data collection, and the baseline (T0) fitness level of participants in the current study (low or high) was determined using machine learning principles. Based on the fitness level, the app determined the appropriate level of exercise difficulty (A or B) for each fitness component. For example, a participant in the personalized exercise group might have been assigned level A for balance exercises, level B for flexibility, and level B for strength. illustrates an example of a study participant’s unique fitness profile, based on the DMs, graphically displayed alongside the average profile for the entire study sample. Repeated fitness assessments at 4 weeks (T1) allowed for the personalized exercise program to be adjusted according to the updated DMs.
Figure 3. A participant’s unique fitness profile graphically displayed alongside the average profile. AP: anterior-posterior; ML: mediolateral.
Data Transformation
For comparability reasons due to different units of measurement, we transformed the DM data into normalized (z) scores. For balance measures, we calculated the mean of the 5 generated DM scores to one for each balance test. Results are presented as z scores.
Adherence to Program Recommendations: Adherers and Nonadherers in the Personalized Exercise Group—Post Hoc Distribution
Since participants needed to access the study app in order to watch and perform exercise videos, it was therefore possible to determine the actual and accurate measurement of adherence. Although they were instructed to exercise 5×/week, the actual adherence varied. To explore whether adherence influenced improvements, we conducted an exploratory analysis categorizing participants as adherers or nonadherers. The following cutoff points, along with their rationale, were examined:
Stage 1: ≥3 sessions/week versus <3 sessions/week (based on official recommendations, whereby 3 sessions/week is considered optimal) [].
Stage 2: ≥2.45 sessions/week versus <2.45 sessions/week (the median adherence score).
Stage 3: ≥2 sessions/week versus <2 sessions/week (a lower threshold to determine the minimum frequency needed for fitness improvements).
Stage 4: ≥1.5 sessions/week versus <1.5 sessions/week (an even lower threshold to determine the minimum frequency needed for fitness improvements).
A consistent trend favoring adherers over nonadherers emerged across all cutoff points (see ). The most notable differences were observed with the ≥2 sessions/week versus <2 sessions/week and ≥1.5 sessions/week versus <1.5 sessions/week cutoffs.
Ultimately, we selected 1.5 sessions/week as the final cut-off for two reasons:
This frequency suggested that significant improvements in balance, flexibility, and strength could be achieved with as few as 1.5 tailored exercise sessions per week.
It served as a criterion for distinguishing nonexercisers while still retaining a sizable proportion of participants (71.7%; see ) in the personalized exercise group.
Subsequently, we conducted statistical analyses using four groups: (1) personalized exercise adherers (n=66), (2) personalized exercise nonadherers (n=26), (3) general guidelines exercise (active-control; n=80), and (4) control (n=67).
Statistical Analyses
We applied statistical analyses to the 3-time measurements during the intervention period, T0, T1, and T2, and examined whether improvements observed after 8 weeks (T2) were maintained at 12-week follow-up (T3). Specifically, a mixed repeated measures ANOVA (3 test dates×4 groups) was conducted for each fitness component, and Eta squared (η²) was calculated to assess the effect size. Fisher LSD was used for pairwise post hoc analyses, and Cohen d coefficients were calculated to reveal the standardized differences between means when effects reached a significance level (P<.05).
To examine whether improvements were maintained at T3, we examined participants from the general group and personalized adherers who demonstrated improvement from T0 to T2 (between the baseline and the end of the 8-week intervention period). Improvement was defined as a change of ≥0.12 in z score (zT2-zT0), corresponding to the 55th percentile with normal distribution. More specifically, individuals with T2-T0 z scores ≥0.12 were considered “improvers.” Two-way ANOVA (2 test dates×2 groups) with repeated measures was applied on the outcome measures.
Attrition Rate (Percentage of Remaining Participants in Each Group)
Due to incomplete compliance during 1 or more measurements, or failure to upload measurements due to poor internet connectivity, specific data points for certain individuals were excluded. Additionally, scores greater than 2.5 SDs from the raw data means were omitted. As a result, the number of participants in each ANOVA (assessing the effect of the intervention on each fitness component) ranged from 189 to 231. The participation rate (%) for each group was calculated for the main outcomes (see ). χ² analyses revealed no significant differences. The power calculation was based on a sample size of n=189.
Results
Participants
illustrates the participant flowchart across the 3 original study groups. Of those who completed the 12 weeks, 90 were from the personalized exercise group, 78 from the general exercise group, and 62 from the control group.
Figure 4. Participants’ flowchart.
presents baseline data.
Table 1. Baseline characteristics.
Personalized exercise (n=92)
General exercise (n=80)
Control (n=67)
Female, n (%)
55 (59.7)
57 (71.3)
43 (64.2)
Male, n (%)
37 (40.2)
23 (28.8)
24 (35.8)
Age (y), mean (SD)
72.37 (5.01)
72.80 (5.58)
72.78 (5.70)
Height (cm)
Female, mean (SD)
161.92 (5.68)
160.84 (6.20)
161.90 (5.64)
Male, mean (SD)
172.22 (6.00)
173.48 (5.16)
175.22 (4.30)
Weight (kg)
Female, mean (SD)
68.42 (10.73)
69.65 (12.93)
69.02 (10.00)
Male, mean (SD)
78.97 (12.68)
83.3 (10.75)
80.17 (6.34)
Working
No, n (%)
36 (39.1)
26 (35.6)
31 (47.7)
Yes, n (%)
29 (31.5)
21 (28.8)
20 (30.8)
Volunteer, n (%)
23 (25.0)
26 (35.6)
14 (21.5)
Married/living with a partner, n (%)
66 (71.7)
53 (66.3)
47 (70.1)
Don’t smoke, n (%)
86 (93.5)
73 (91.3)
63 (94.0)
Score 0 on Short GDS, n (%)
89 (96.7)
78 (97.5)
62 (96.9)
Frailty (out of 41 deficits), mean (SD)
2.85 (1.92)
3.64 (2.14)
3.13 (2.08)
Engaged in physical activity during the last 7 d, n (%)
79 (85.9)
61 (76.3)
56 (83.6)
Aerobic activity in the last 7 d (min), mean (SD)
227.28 (247.04)
173.63 (185.08)
232.84 (227.19)
Other exercise in the last 7 d (min), mean (SD)
87.22 (98.07)
76.50 (89.73)
77.46 (115.80)
Total exercise last 7 d (min), mean (SD)
314.51 (256.86)
250.13 (212.59)
310.30 (275.55)
Sedentary time during 1 d (h), mean (SD)
6.58 (4.26)
5.69 (3.41)
6.82 (4.57)
Active in the last 7 d (1‐5 scale), mean (SD)
4.03 (0.93)
4.04 (0.91)
4.30 (0.65)
aGDS: Geriatric Depression Scale.
bP<.05
Power Analysis Based on the Post Hoc Distribution (Four Groups)
We used G*Power [] to perform power analysis for a 2-way ANOVA (3 test dates×4 groups) with repeated measures on the outcome measures. Our sample (n=189) provided 91% statistical power to find an interaction with small effect (Cohen f=0.1), 91% power to find group differences of moderate effect (Cohen f=0.25), and 97% power to find within measurements differences of small effect (Cohen f=0.1). All power analyses used a correlation of 0.685 among repeated measures because, among all our primary outcomes, this was the lowest (the highest was 0.856) and thus the most conservative value to use.
Results of the Statistical Analyses
describes the main results. Group×time interaction was significant for dynamic balance (mean tandem walk forward and backward, F6,404=3.232, P=.004, η2=0.046; ). Pairwise analyses indicated significant improvements among personalized exercise adherers (Adherers) from T0 to T2 (Mdiff0,2=0.228, P=.002, d=0.404) and group differences in favor of the Adherers in T2 (Mgrp1,3=−0.357, P=.02, d=0.456; Mgrp1,4=−0.383, P=.01, d=0.474; ). The interaction on static balance (mean of leg stance and tandem stance) was not significant, but group differences favored the Adherers at T1 (Mgrp1,3=−0.375, P=.01, d=0.430; Mgrp1,4=−0.361, P=.02, d=0.446; ).
Group×time interactions were revealed on both arm flexion (mean right and left, F6,448=2.527, P=.02, η2=0.033) and arm extension (mean right and left, F6,450=2.753, P=.01, η2=0.035; ). Follow-up pairwise analyses indicated significant improvement in the Adherers on arm flexion (left and right) from T0 to T2 (Mdiff0,2=−0.227, P=.007, d=0.356) and on arm extension (left and right) from T0 to T1 (Mdiff0,1=−0.221, P=.02, d=0.302) and from T0 to T2 (Mdiff0,2=−0.210, P=.03, d=0.290; ).
Group×time interaction was also indicated on arm strength total (mean of lifting right arm forward, left arm forward, left arm to the side, and right arm to the side; F6,424=2.394, P=.03, η2=0.033; ). Follow-up pairwise analyses indicated significant improvement among the Adherers on arm strength total from T0 to T1 (Mdiff0,1=0.228, P=.008, d=0.438) and from T0 to T2 (Mdiff0,2=0.217, P=.008, d=0.384; ).
Figure 5. z scores of (A) dynamic and static balance, (B) arm flexion and extension, and (C) arm strength. Ctrl: control.
More results are presented in the tables below. Regarding balance, group×time interactions were significant for tandem stance left (left foot forward, η2=0.033), tandem walk forward (η2=0.039), tandem walk backward (η2=0.034), and balance total (mean of all balance scores, η2=0.040; ). Pairwise analyses indicated improvements (time differences) only in the Adherers from T0 to T2 (Mdiff0,2=0.163, P=.009, d=0.259), with group differences favoring the Adherers at T1 (Mgrp1,3=0.344, P=.007, d=0.470) and at T2 (Mgrp1,3=0.399, P=.003, d=0.520, Mgrp1,4=0.347, P=.01, d=0.480; ).
Regarding flexibility, group×time interactions were revealed on right arm flexion (η2=0.038), right arm extension (η2=0.032), left arm (mean flexion and extension, η2=0.035), and right arm (mean flexion and extension, η2=0.054; ). Pairwise analyses indicated significant improvements only among the Adherers on right arm flexion from T0 to T2 (Mdiff0,2=−0.321, P=.002, d=0.425), on right arm extension from T0 to T1 (Mdiff0,1=−0.264, P=.02, d=0.293), and from T0 to T2 (Mdiff0,2=−0.262 , P=.03, d=0.309), on right arm (mean flexion and extension) from T0 to T1 (Mdiff0,1=−0.205, P=.008, d=0.341) and from T0 to T2 (Mdiff0,2=−0.283, P<.001, d=0.625), and on left arm (mean flexion and extension) from T0 to T1 (Mdiff0,1=−0.192, P=.009, d=0.359; ). No change was observed on torso rotation ().
Table 2. z scores of T0 (baseline), T1 (4 wk), and T2 (8 wk) balance measures.
Personalized exercise adherers (1)
Personalized exercise nonadherers (2)
General activity (3)
Control (4)
F Time (df)
F Group (df)
F Interaction (df)
Left leg stance, mean (SD)
0.65 (2, 336)
1.91 (3, 168)
1.24 (6, 336)
T0
−0.189 (0.914)
−0.469 (0.419)
−0.136 (0.719)
0.221 (1.089)
T1
−0.161 (0.892)
−0.150 (0.670)
0.064 (1.006)
0.020 (0.968)
T2
−0.218 (0.762)
−0.205 (0.837)
0.009 (0.830)
0.087 (1.096)
Right leg stance, mean (SD)
0.27 (2, 340)
3.54 (3, 170)
0.55 (6, 340)
T0
−0.193 (0.762)
−0.386 (0.678)
0.031 (0.889)
0.012 (0.935)
T1
−0.251 (0.590)
−0.288 (0.721)
0.079 (1.049)
0.136 (1.084)
T2
−0.313 (0.585)
−0.346 (0.542)
0.015 (0.853)
0.192 (1.108)
Tandem stance left, mean (SD)
1.01 (2, 404)
2.91 (3, 202)
2.32 (6, 404)
T0
−0.119 (0.708)
−0.019 (1.053)
−0.100 (0.746)
0.181 (1.069)
T1
−0.366, (0.599)
−0.159 (0.816)
0.062 (0.842)
0.179 (0.987)
T2
−0.255 (0.792)
0.115 (1.208)
0.107, (0.967)
0.084 (0.781)
Tandem stance right, mean (SD)
0.19 (2, 380)
1.22 (3, 190)
1.04 (6, 380)
T0
−0.030 (0.806)
−0.092 (1.020)
−0.164 (0.779)
0.134 (0.929)
T1
−0.184 (0.990)
−0.215 (0.756)
0.041 (0.940)
0.120 (0.886)
T2
−0.131 (0.975)
0.001 (1.209)
−0.061 (0.838)
0.128 (0.725)
Tandem walk forward, mean (SD)
0.13 (2, 380)
1.05 (3, 190)
2.56 (6, 380)
T0
−0.009 (0.875)
−0.111 (0.941)
0.037 (0.924)
0.082 (0.899)
T1
−0.118 (0.809)
−0.023 (0.981)
0.164 (0.929)
−0.035 (0.925)
T2
−0.266, (0.704)
−0.083 (0.962)
0.146 (0.948)
0.105 (0.873)
Tandem walk backward, mean (SD)
0.01 (2, 382)
0.85 (3, 191)
2.21 (6, 382)
T0
−0.007 (0.750)
0.064 (1.092)
0.033 (0.844)
−0.033 (0.920)
T1
−0.143 (0.881)
0.030 (0.837)
0.191 (0.915)
0.011 (0.841)
T2
−0.162 (0.810)
−0.068 (1.002)
0.143 (0.856)
0.176, (0.985)
Leg stance (L+R), mean (SD)
0.04 (2, 370)
2.66 (3, 185)
0.54 (6, 370)
T0
−0.138 (0.776)
−0.259 (0.786)
0.093 (0.899)
0.245 (1.019)
T1
−0.148 (0.758)
−0.155 (0.600)
0.149 (0.993)
0.133 (0.948)
T2
−0.231 (0.687)
−0.110 (0.905)
0.080 (0.878)
0.176 (0.986)
Tandem stance (L+R), mean (SD)
0.30 (2, 420)
2.00 (3, 210)
2.11 (6, 420)
T0
−0.022 (0.725)
0.008 (0.916)
−0.048 (0.772)
0.218 (1.000)
T1
−0.214, (0.760)
−0.092 (0.830)
0.101 (0.822)
0.262 (0.961)
T2
−0.143 (0.933)
0.115 (1.099)
0.096 (0.872)
0.150 (0.741)
Balance total, mean (SD)
0.51 (2, 432)
2.11 (3, 216)
3.03 (6, 432)
T0
−0.019 (0.641)
−0.010 (0.786)
0.102 (0.783)
0.128 (0.801)
T1
−0.123, (0.642)
0.068 (0.719)
0.221, (0.795)
0.120 (0.732)
T2
-0.182, (0.712)
0.132 (0.921)
0.217, (0.811)
0.165 (0.721)
aAdherers: ≥1.5/wk
bNonadherers: <1.5/wk
cDifferences between groups (P<.05).
dP<.05.
eDifferences between groups (P<.01).
fDifferences between T0 and T1 (P<.05).
gDifferences between T0 and T2 (P<.05).
hDifferences between T0 and T2 (P<.01).
iP=.05.
Table 3. z scores of T0 (baseline), T1 (4 wk), and T2 (8 wk) flexibility measures.
Personalized exercise adherers (1)
Personalized exercise nonadherers (2)
General activity (3)
Control (4)
F Time (df)
F Group (df)
F Interaction (df)
Left arm flexion, mean (SD)
0.29 (2, 434)
0.09 (3, 217)
1.30 (6, 434)
T0
–0.132 (0.959)
–0.115 (1.031)
0.052 (0.990)
0.074 (1.005)
T1
0.026 (0.978)
–0.091 (0.929)
–0.066 (0.982)
0.007 (1.000)
T2
0.032 (0.968)
–0.032 (0.959)
0.059 (1.088)
–0.032 (0.870)
Right arm flexion, mean (SD)
0.08 (2, 420)
0.07 (3, 210)
2.78 (6, 420)
T0
–0.175 (0.946)
–0.009 (0.887)
0.067 (0.899)
0.062 (1.160)
T1
–0.054 (0.976)
–0.063 (0.985)
0.002 (0.963)
0.018 (1.023)
T2
0.146, (1.059)
–0.035 (1.080)
0.025 (1.014)
–0.145 (0.909)
Left arm extension, mean (SD)
0.01 (2, 434)
0.99 (3, 217)
1.95 (6, 434)
T0
–0.001 (0.989)
0.039 (1.036)
0.013 (0.99)
–0.021 (1.029)
T1
0.138 (0.963)
0.168 (0.845)
0.050 (0.932)
–0.315, (1.029)
T2
0.117 (0.883)
0.105 (0.959)
–0.044 (1.055)
–0.129 (0.883)
Right arm extension, mean (SD)
0.27 (2, 432)
0.51 (3, 216)
2.40 (6, 432)
T0
–0.122 (1.004)
0.156 (0.768)
0.068 (1.025)
–0.037 (1.007)
T1
0.142 (0.970)
0.239 (0.871)
–0.032 (1.054)
–0.193 (0.978)
T2
0.141 (0.912)
–0.064 (1.010)
–0.022 (1.002)
–0.083 (1.036)
Left arm (flex+ext), mean (SD)
0.15 (2, 454)
0.49 (3, 227)
2.78 (6, 454)
T0
–0.046 (0.728)
0.009 (0.826)
0.023 (0.765)
0.029 (0.747)
T1
0.145, (0.682)
0.031 (0.600)
0.006 (0.750)
–0.155, (0.810)
T2
0.088 (0.740)
0.097 (0.721)
0.009 (0.817)
–0.098 (0.714)
Right arm (flex+ext), mean (SD)
0.11 (2, 448)
0.13 (3, 224)
4.29 (6, 448)
T0
–0.168 (0.743)
0.083 (0.646)
0.086 (0.767)
0.024 (0.732)
T1
0.037 (0.726)
0.088 (0.644)
–0.038 (0.780)
–0.075 (0.708)
T2
0.115 (0.666)
–0.049 (0.772)
–0.029 (0.836)
–0.087 (0.590)
Torso rotation left, mean (SD)
0.26 (2, 440)
0.32 (3, 220)
0.77 (6, 440)
T0
–0.145 (1.045)
0.018 (1.114)
0.007 (1.038)
0.082 (0.872)
T1
–0.064 (0.994)
–0.111 (1.061)
0.023 (1.038)
–0.013 (0.930)
T2
–0.109 (0.986)
–0.099 (1.088)
0.071 (1.019)
–0.018 (0.930)
Torso rotation right, mean (SD)
0.27 (2, 440)
0.51 (3, 220)
1.54 (6, 440)
T0
0.063 (1.133)
0.037 (0.929)
–0.078 (0.999)
0.036 (0.874)
T1
0.189 (1.030)
–0.231 (0.940)
–0.139 (0.982)
0.068 (1.041)
T2
0.074 (1.094)
0.002 (1.042)
0.018 (1.003)
–0.069 (0.087)
aAdherers: ≥1.5/wk
bNonadherers: <1.5/wk
cP<.05.
dDifferences between T0 and T2 (P<.05).
eDifferences between T1 and T2 (P<.05).
fDifferences between groups (P<.05).
gDifferences between T0 and T1 (P<.01).
hDifferences between T0 and T1 (P<.05).
iDifferences between T1 and T2 (P=.05).
jP<.01.
kDifferences between T0 and T2 (P<.01).
Concerning arm strength, a group×time interaction was observed for lifting right arm to the side (η2=0.034; ). Specific improvements were noted in the Adherers from T0 to T1 (Mdiff0,1=0.247, P=.02, d=0.395) and from T0 to T2 (Mdiff0,2=0.213, P=.02, d=0.327; ). Pairwise differences were observed for arm strength variables, although no interactions were found: the Adherers improved on right arm forward from T0 to T1 (Mdiff0,1=0.271, P=.006, d=0.444) and from T0 to T2 (Mdiff0,2=0.308, P=.002, d=0.466), on left arm forward from T0 to T1 (Mdiff0,1=−0.215, P=.03, d=0.332) and from T0 to T2 (Mdiff0,2=−0.266, P=.005, d=0.399), on left arm to side from T0 to T1 (Mdiff0,1=0.201, P=.03, d=0.331) and from T0 to T2 (Mdiff0,2=0.179, P=.04, d=0.272; ).
No change was observed in lower body strength (sit-to-stand; ).
Table 4. z scores of T0 (baseline), T1 (4 wk), and T2 (8 wk) strength measures.
Personalized exercise adherers (1)
Personalized exercise nonadherers (2)
General activity (3)
Control (4)
F Time (df)
F Group (df)
F Interaction (df)
Left arm forward, mean (SD)
2.58 (2, 388)
2.17 (3, 194)
1.86 (6, 388)
T0
−0.052 (0.821)
0.448 (0.186)
0.103 (1.108)
−0.037 (0.910)
T1
−0.267, (0.710)
0.236 (0.943)
0.029 (1.170)
0.107 (0.981)
T2
−0.320, (0.688)
0.337 (0.971)
−0.045 (1.088)
0.029 (0.912)
Right arm forward, mean (SD)
0.93 (2, 392)
1.84 (3, 196)
1.92 (6, 392)
T0
0.015 (0.869)
0.300 (1.118)
0.012 (1.048)
0.063 (0.983)
T1
−0.257, (0.859)
0.308 (0.968)
−0.011 (1.082)
0.105 (0.998)
T2
−0.293, (0.793)
0.337 (1.062)
−0.033 (1.049)
0.130 (0.950)
Left arm to side, mean (SD)
0.22 (2, 404)
3.27 (3, 202)
1.47 (6, 404)
T0
−0.095 (0.865)
0.440 (1.271)
−0.059 (0.960)
0.023 (0.931)
T1
−0.296, (0.778)
0.373 (0.960)
−0.054 (1.122)
0.157 (0.989)
T2
−0.274, (0.690)
0.492 (1.081)
−0.085 (1.012)
0.078 (0.959)
Right arm to side, mean (SD)
0.45 (2, 388)
1.52 (3, 194)
2.26 (6, 388)
T0
0.318 (1.083)
0.318 (1.083)
0.063 (1.134)
−0.060 (0.868)
T1
−0.253, (0.799)
0.319 (0.916)
−0.001 (1.051)
0.153, (1.045)
T2
−0.219, (0.817)
0.285 (1.034)
−0.038 (1.016)
0.078 (0.958)
Total forward (left+right), mean (SD)
2.84 (2, 408)
2.44 (3, 204)
1.88 (6, 408)
T0
−0.001 (0.838)
0.517 (1.182)
0.059 (1.086)
0.052 (0.975)
T1
−0.228, (0.796)
0.318 (0.910)
0.004 (1.098)
0.150 (1.007)
T2
−0.275, (0.753)
0.402 (1.047)
−0.275 (0.753)
0.120 (0.973)
Total to side (left+right), mean (SD)
0.35 (2, 412)
2.23 (3, 206)
1.83 (6, 412)
T0
−0.048 (0.900)
0.379 (0.166)
0.024 (1.069)
−0.019 (0.882)
T1
−0.277, (0.773)
0.346 (0.930)
−0.028 (1.085)
0.142 (0.997)
T2
−0.229, (0.776)
0.388 (1.052)
−0.040 (1.020)
0.077 (0.927)
Total left (forward+side), mean (SD)
1.09 (2, 414)
2.61 (3, 207)
1.93 (6, 414)
T0
−0.072 (0.823)
0.444 (1.160)
0.052 (1.067)
−0.005 (0.893)
T1
−0.277, (0.726)
0.305 (0.923)
0.007 (1.135)
0.142 (0.960)
T2
−0.283, (0.686)
0.415 (1.000)
−0.029 (1.043)
0.069 (0.923)
Total right (forward+side), mean (SD)
0.38 (2, 442)
3.91 (3, 221)
1.88 (6, 442)
T0
−0.153 (0.807)
0.512 (1.004)
0.041 (0.972)
−0.043 (0.938)
T1
−0.256, (0.775)
0.471 (0.888)
0.040 (1.006)
0.029 (1.000)
T2
−0.237 (0.771)
0.591 (1.011)
0.037 (0.995)
−0.026 (0.988)
Lower body strength (sit to stand), mean (SD)
1.10 (2, 420)
2.16 (3, 210)
0.72 (6, 420)
T0
−0.158 (0.974)
0.220 (0.891)
0.099 (1.048)
−0.099 (0.976)
T1
−0.254a (0.965)
0.325a (1.121)
0.126 (1.043)
−0.025 (0.910)
T2
−0.281 (0.877)
0.077 (0.947)
0.115 (1.069)
−0.061 (0.923)
aAdherers: ≥1.5/wk
bNonadherers: <1.5/wk
cDifferences between groups (P<.05).
dDifferences between T0 and T1 (P<.05).
eDifferences between groups (P<.01).
fDifferences between T0 and T2 (P<.01).
gDifferences between T0 and T1 (P<.01).
hP<.05.
iDifferences between T0 and T2 (P<.05).
jP<.01.
Follow-Up
No group×time interaction was observed on any of the outcomes. Significant (P<.05) time effects were revealed, indicating significant deterioration in both groups—the personalized Adherers and the general groups—during the 4-week follow-up.
Discussion
Principal Findings
We examined the hypothesis that remotely delivered, personalized multicomponent exercise for older adults—based on a simple yet reliable and accurate smartphone motor fitness assessment and individually tailored using machine learning—can improve balance, flexibility, and strength among older adults, all without the need for a laboratory or professional supervision.
The results of this randomized controlled study demonstrated that a multicomponent personalized exercise program among older people was more effective when compared to active controls who were counseled to perform regular exercise according to WHO guidelines, as well as a passive control group (who received no intervention). Furthermore, improvements were achieved with as few as 1.5 tailored exercise sessions per week over 8 weeks and in many fitness measurements, even within 4 weeks.
The study tool has been refined from the initial prototype and proof of concept [-] and in its present form was proven to be sufficiently sensitive to measure both improvement and decline across the motor fitness measures, in as few as 4 weeks following the initiation or cessation of the exercise intervention, respectively.
The improvement in balance is of particular importance, as the relationship between balance impairment and falls [] and the positive effect of exercise on balance and fall prevention among older people is well documented []. However, exercise interventions typically involve group sessions in neighborhood clubs or physical therapy laboratories [], requiring a specialized trainer or therapist, and mostly target participants at risk of falls [,]. Balance control is multifactorial [,], and the novelty of the study tool presented in this study is not only its potential widespread application but also the fact that it includes 4 static and 2 dynamic balance tests, each comprising 5 DMs assessing body sway in all directions (mediolateral, anterior-posterior, and superior-inferior), offering a complete overview of the participant’s balance. Simultaneously, the balance-focused segment of our exercise programs addresses all components of balance, encompassing 5 subcategories: static, dynamic, vestibular, leg strength, and leg flexibility [].
Flexibility is a fitness component known to typically decline with advancing age, presenting a major contribution to reduced functioning []. Although amenable to improvement through focused exercise [], nonetheless, current guidelines provide only minimal detailed attention, and consequently, this element of fitness often remains neglected [,]. Our findings revealed significant improvement in flexibility in as little as 4 weeks of tailored exercise for upper body (arm) flexibility (both extension and flexion), which was most pronounced among the personal adherers, while measures of torso rotation remained unchanged. In all likelihood, this lack of observed change in torso flexibility is an artifact due to the technical difficulty measuring this vector with the smartphone.
The importance of upper body strength is notable with advancing age, with weakness associated with painful symptomatology [], upper limb dysfunction, and decreased performance measures []. It should be noted that upper extremity strength can be represented by several measurements, such as the widely used arm curl test [,]. We chose to focus on the shoulder joint because age-related decline in maximal upper extremity torque is greater at the shoulder than at the elbow and wrist joints [].
In contrast to the shoulder, we did not observe significant differences in leg strength, although a trend for improvement was seen in the intervention group. In our pilot study, we previously observed improvements in leg strength using sit-to-stand repetitions over a 30-second period [,]. However, to simplify testing, we modified this measure to a time score for 10 repetitions, which led to a ceiling effect. Importantly, leg strength is essential for functioning in older adults [,], and evaluating the impact of exercise on this component is crucial. Since the sit-to-stand repetitions (as many repetitions as possible over 30 s) were shown to be sensitive to changes following exercise, we plan to return to this method in future assessments.
Our study is unique in using a simple yet accurate smartphone platform to incorporate a remote assessment of balance, flexibility, and strength to serve as the baseline for a subsequent matched range of exercises, spanning these modalities of motor fitness. The existing models rely heavily upon fitness trackers, built-in accelerometers, and on occasion GPS to remotely monitor steps, endurance, and energy consumption. However, the critical elements of balance, flexibility, and shoulder strength are neglected, despite their crucial importance among older people. It is worth mentioning that recent evidence is emerging from the rehabilitation setting, supporting the use of smartphones for assessing balance or flexibility (range of motion) in older adults; however, mostly for highly specific conditions requiring clinical supervision [-].
Notably, while the platform demonstrated sufficient sensitivity to detect changes at a low threshold (1.5 sessions per week over 4 weeks), it remains uncertain whether this frequency is adequate to produce meaningful clinical health benefits. This concern is further emphasized by the small effect sizes observed—despite their statistical significance—and by the higher frequency recommended in WHO guidelines. Based on our findings, we cannot assert that this level of activity is sufficient for inducing clinical health improvements.
Similarly, the deterioration observed after the 4-week follow-up period without exercise was also subtle, suggesting that short-term inactivity may not necessarily lead to clinically relevant declines in fitness. This aligns with the broader detraining literature, which indicates that the rate of fitness loss is highly dependent on the initial training volume—encompassing factors such as intensity, duration, and frequency. Individuals with a higher training volume tend to experience a more gradual decline in fitness, whereas those with lower initial levels may exhibit more rapid losses [-].
In our study, the smartphone app was able to detect subtle yet significant improvements in fitness after 4 weeks of exercise, which then disappeared following 4 weeks of inactivity. While neither of these changes is likely to translate into meaningful clinical health effects, they underscore the application’s sensitivity in capturing even small fluctuations in fitness over time—both in improvement and decline. This capability highlights its potential as a tool for remotely monitoring fitness trends that might otherwise go unnoticed outside of laboratory settings.
An interesting finding of our study is the notable relationship between participants’ habitual physical activity and sedentary time before starting the intervention and their subsequent adherence to the exercise regimen. Significant differences were observed between adherers and nonadherers, with adherers engaging in more habitual physical activity and nonadherers spending more time sedentary. It is important to note that the classification into adherers and nonadherers was made post facto, only after the intervention ended. This suggests that nonadherence to physical activity, often associated with a more sedentary lifestyle, may reflect an underlying behavioral predisposition that persists even when individuals voluntarily enroll in an exercise program.
Study Limitations
Several limitations to our study deserve mention. First, the rate of adherence to the exercise program was accurately measured via the smartphone among the interventional group, while we had to rely upon self-reported data among the controls. Attempts to categorize the active control group into adherers and nonadherers based on self-reports, using the same cutoff points as described for the personalized group, showed no clear trends. To address this limitation, we compared the overall percentage of improvers in the intervention group to those in the active control group over the 8-week program, irrespective of the degree of adherence. Compared to the controls, the intervention participants showed higher rates of improvement for static balance (46% vs 33.3%, P=.07), dynamic balance (53.6% vs. 28.4%, P=.002), arm flexion (52.8% vs 43.4%, P=.48), and arm extension (46.1% vs 34.6%, P=.30).
Second, in the current study, in order to generate accurate data for the study, the trained study personnel performed the testing of participants. However, the ultimate goal of the application is that participants will be able to assess themselves (or possibly with the assistance of a lay person, eg, family member).
Another limitation is the sample’s bias toward participants from higher socioeconomic status. As this is a randomized controlled study, this bias does not affect the main outcome—the improvement of the intervention group over the controls. However, it may impact the generalizability of the study results to other populations.
In addition, in the current study, we applied only 2 levels of difficulty for each of the 3 movement components. As large-scale data accumulate, there is potential to expand and further define more variations of movement profiles.
Furthermore, physical fitness may include more components than the ones included in our study. For example, for assessing strength, while the selected tests did represent the major muscle groups, nonetheless, not all muscle groups were included. We also did not include other components such as eye–hand coordination or fine motor abilities. However, we selected the most appropriate tests for assessing motor and physical fitness in old age, taking into consideration medical aspects and safety precautions (for more information on designing the tests, see []).
The interaction with the technology—the smartphone—may also be problematic. For example, using the smartphone screen was inconvenient for some participants, and larger screens would improve the ease of performing the exercises. This could be solved by connecting the smartphone to a large screen. In addition, the videoed exercise program was running in a continuous manner on the phone screen; however, if the participant wanted to repeat an exercise before moving to the next one, or to stop for some reason, he or she had to change his or her current position, approach the phone, stop the program, and restart it again.
It may be argued against the smartphone sensors that there are settings where more accurate assessments may give more accurate results. Although applicable for research, these settings are inaccessible to the general population as they are scarce and expensive to use. Prior work [,] has already demonstrated that smartphones offer a reliable tracking of motor functions and therefore offer a sufficient, even if not perfect, means for evaluation in large scales.
The study sample was generally healthy at the time of enrollment, as assessed by the study physician. Enrolled participants were cognitively intact, free from any hospitalization in the last year for any cardiac or neurological reason, independent in daily function, able to walk without assistance, and with a low fall risk. Furthermore, we included a 41-item frailty assessment (see ), which confirmed very low levels of frailty across all participants. Although comorbidities or other current health conditions were not formally assessed, nonetheless, the study sample’s health profile of high cognitive function, independent functional and mobility status, very low frailty levels, and no recent cardiological or neurological illness for hospitalization was suggestive of an overall health status.
Using Artificial Intelligence for Extending and Refining the Tailored Exercise Program
Generating optimal personalized exercise program should rely not only on assessing the level of fitness but also considering basic aspects of the individual health status and behavior patterns. In line with personalized genomics and big data accumulation, a possible future upgraded version of this application might be used in conjunction with data drawn from genetic, molecular, clinical, social, and behavioral domains in order to achieve an optimal prescription of personalized exercise programs.
Furthermore, large-scale data will enable an in-depth analysis of individual movement capacities, a more accurate assessment of a wide range of fitness and mobility parameters, and, subsequently, more specific personalized exercise programs. For instance, when assessing balance in individuals with stability issues, it is beneficial to analyze the specific directions of sway—mediolateral, anteroposterior, and superior-inferior. Similarly, an arm strength test can be broken down into separate actions of “lifting the hand up” and “lowering it down,” while the sit-to-stand test can be divided into “getting up” and “sitting down.” Accurately localizing movement impairments has important clinical implications.
The potential ramifications of this study are multifold. First, we provide a model whereby a home-based, highly detailed remote analysis of fitness and mobility parameters provides objective quantitative data as a basis for subsequent tailored exercise interventions at the individual level. Furthermore, the sensitivity of the remote sensors was shown to be sufficient to enable an adaptive, precise, and updating exercise program, determined by the participants’ progress over time. In addition, the continually updating database serves to constantly improve the machine learning precision of decisions concerning the selection of appropriate exercises. Second, our study included only healthy, independent adults aged 65 years and over. We provide evidence to support a platform that has the potential to be adapted to meet the specific needs and abilities of various healthy and patient populations. Specifically, among older people, it is plausible that targeted and individualized exercise interventions are likely to play a beneficial role in improving intrinsic capacity and resilience, moderating frailty and deconditioning. Similarly, individualized programs can be further refined to address specific needs of populations with mobility limitations, such as those at risk of falls or confined to wheelchairs, as well as the potential applicability among participants with cognitive impairments.
Summary and Conclusions
In this randomized controlled study, we examined a novel home-based approach for personalized exercise programs for older adults, utilizing a simple smartphone that obviates the need for a laboratory or professional intervention. Through smartphone accelerometer and gyroscope sensors, we remotely assessed key components of motor fitness, including balance, flexibility, and strength. Based on these assessments, a machine-learning-generated personalized exercise program, tailored to each individual’s needs, was delivered via video directly on the smartphone. The results demonstrated that a multicomponent personalized exercise program was more effective when compared to active controls who were counseled to perform regular exercise according to WHO guidelines, as well as a passive control group who received no intervention. Furthermore, improvements were achieved with as few as 1.5 tailored exercise sessions per week over 8 weeks and in many fitness measurements, even within 4 weeks. The remote delivery of user-friendly multicomponent exercise programs to older people has the potential for widespread health benefits. Given the potential of this approach to be extended to various groups of older adults, including those with mobility and cognitive impairments, and considering the advantages of cost-free digital technology (assuming widespread smartphone ownership), health care providers may adopt this approach to provide home-based strategies for health promotion.
This work was supported by the Ministry of Innovation, Science and Technology, Israel (grant 3‐15714). The funder had no role in the design and conduct of the study; collection, management, analysis, and interpretation of the data; preparation, review, or approval of the manuscript; or decision to submit the manuscript for publication.
The datasets generated or analyzed during this study are available from the corresponding author on reasonable request.
YN initiated the idea, was responsible for the grant application for this trial, and wrote the original draft of the manuscript. EA was responsible for the project management. JMJ took a major part in the grant application and in establishing the study protocol and was responsible for achieving ethical approval. JMJ determined the medical criteria for the inclusion and exclusion criteria for the study and was responsible for medical aspects of the study. EA and EB were responsible for designing the exercise program and for the fitness tests. ZY took part in writing the grant application and was responsible for developing the dedicated digital app of the selected tests. KTK took a major part in developing the digital app. SB-S took a leading role in visualization. MA and SB-S were responsible for data curation. MA took a leading role in analyzing the data. SB-S took a major role in reviewing and editing the manuscript. All authors have read and approved the final version of the manuscript.
None declared.
Edited by Taiane de Azevedo Cardoso; submitted 27.Feb.2025; peer-reviewed by Kelechi Elechi, Leela Prasad Gorrepati, Reenu Singh; final revised version received 22.May.2025; accepted 27.May.2025; published 15.Oct.2025.
This is an open-access article distributed under the terms of the Creative Commons Attribution License (https://creativecommons.org/licenses/by/4.0/), which permits unrestricted use, distribution, and reproduction in any medium, provided the original work, first published in the Journal of Medical Internet Research (ISSN 1438-8871), is properly cited. The complete bibliographic information, a link to the original publication on https://www.jmir.org/, as well as this copyright and license information must be included.
A UNLV-led team of researchers has co-opted a common kitchen spice to create a new class of cannabidiol (CBD)-like medicines that show powerful seizure-reducing effects — offering a safer, more affordable, and more…