Animals
Three-month-old sheep were housed in controlled environmental conditions and divided into two groups. One group of ten sheep were fed control feed (1050 kcal); the other group were fed high-concentrate feed (2010 kcal). The mouse was kept in controlled environmental conditions that were free from specific pathogens and divided into two categories of dietary conditions. One group were fed a standard control diet (4.37 kcal); The other group were fed a high-concentrate diet (16.45 kcal). The animals were euthanized by CO₂ inhalation. During the procedure, CO₂ gas was introduced into the euthanasia chamber at a rate of 10% of the chamber volume per minute (corresponding to a flow rate of 5.8 L/min). The gas flow rate was precisely controlled by adjusting the flow control valve to minimize stress in animals prior to loss of consciousness. CO₂ gas was continuously supplied until the animals completely stopped moving, ceased spontaneous breathing, and exhibited dilated pupils. Once these signs were confirmed, the CO₂ gas supply was turned off, and the animals were observed for an additional 2–3 min to ensure death. All animal experiments were conducted in accordance with the ethical policies and procedures approved by the Inner Mongolia University Animal Care and Use Committee (IMU-MOUSE-2023-013, IACUC Issue No. IMU-SHEEP-2021-011), Inner Mongolia University, China.
Single-cell library and sequencing
Testicular tissues were dissected into small fragments and digested with collagenase IV (1 mg/ml, 37 °C, 15 min). After filtration through a 40 μm cell strainer (BD Falcon, USA, 352340), the resulting single-cell suspension was assessed for viability (>90%) and concentration (>1000 cells/μl). Single-cell libraries were prepared using the Chromium Single Cell 3’ Kit v3 (10 × Genomics, USA) and sequenced (PE150) on an Illumina NovaSeq 6000 platform following the manufacturer’s protocol. The sheep reference genome was processed using cellranger mkgtf and cellranger mkref, and raw data were aligned using cellranger count. Subsequent analysis was performed in Seurat, including data normalization, integration, and differential gene expression analysis (FindAllMarkers, thresholds: |log2FC| ≥ 0.25, P < 0.05). Functional enrichment was conducted using g: Profiler based on Gene Ontology (GO) terms.
Metabolome detection and analysis
Metabolomic profiling was performed on sterilely collected small intestinal contents using a Waters Acquity I-Class PLUS UPLC system coupled with a Xevo G2-XS QTof high-resolution mass spectrometer (Waters). Separation was achieved on an Acquity UPLC HSS T3 column (1.8 μm, 2.1 × 100 mm). Raw data were normalized prior to statistical analysis. Differential metabolites were identified based on significance thresholds of P < 0.05 (Student’s *t*-test), |log₂FC| ≥ 1, and VIP (Variable Importance in Projection) > 1 (derived from multivariate cross-validation). Metabolite enrichment analysis was conducted using MetaboAnalyst 5.0, and visualization was performed in R Studio (v4.2).
16S rDNA amplicon sequencing and analysis
After collecting small intestinal contents under sterile conditions, genomic DNA was extracted and purified using the QIAGEN kit. Subsequently, the samples were sequenced using the Illumina platform.
Subsequent data analysis was conducted utilizing R Studio (v4.2) in conjunction with other relevant software tools. Initially, the data underwent alpha diversity and beta diversity analysis using QIIME2. Subsequently, Metastats (v2020.6) was employed to conduct a t-test on the species abundance data between the groups. Differential species were identified using a stringent dual-filter criterion: unadjusted P value < 0.05 and Q value < 0.05. Species with a p-value less than 0.05 were deemed significantly different. To assess the correlation between genera exhibiting distinct abundances, Spearman correlation analysis was performed, and correlation values with a significance level of P value < 0.05 were retained. Following this, the resulting correlation network was visualized using Cytoscape (v3.9.0). The functional prediction of differential genera is carried out using the Linear discriminant analysis Effect Size (LEfSe) method and the PICRUSt2 tool.
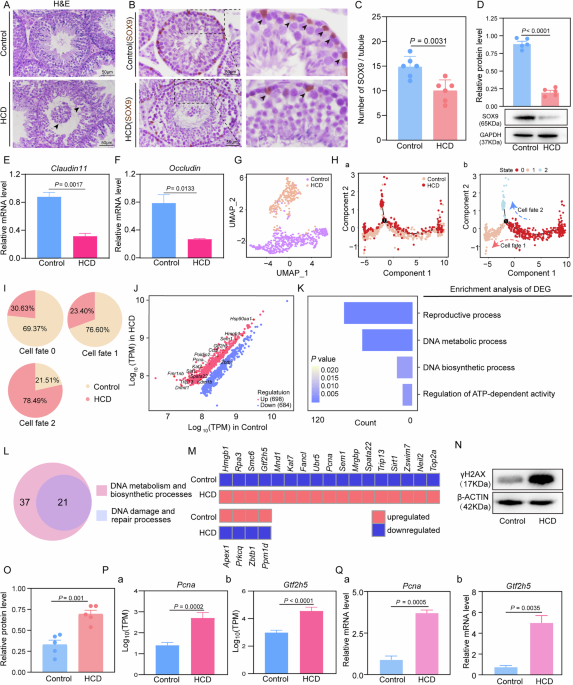
Hematoxylin–eosin (H&E) staining
The testis was placed in Bouin’s solution (Sigma, HT10132, Germany) at 4 °C overnight after the dehydration and embedding of tissue blocks. For this study, serial sections with a thickness of 5 μm were utilized. Following drying at 37 °C, the samples were stained using Lillie-Mayer hematoxylin (Solarbio, G1080, China) and eosin (Zsbio, ZLI-9613, China). The tissue sections were subsequently dehydrated with alcohol and sealed with Neutral Balsam Mounting Medium (ZSGB-BIO, 96949-21-2, China). Finally, the samples were left to dry naturally, facilitating easy observation and statistical analysis.
Immunohistochemistry
The testis was placed in Bouin’s solution (Sigma, HT10132, Germany) at 4 °C overnight after the dehydration and embedding of tissue blocks. The tissue sections were dewaxed and incubated in a blocking solution (3% BSA, 10% normal donkey serum in TBST) for 30 min. The primary antibody (Table S1) was incubated overnight at 4 °C. Subsequently, the corresponding secondary antibody was applied, followed by color development using DAB (ZSGB-BIO, ZLI-9013, China). Finally, counterstaining was performed using Lillie-Mayer hematoxylin (Solarbio, G1080, China), and the samples were dehydrated and sealed for further analysis.
Immunofluorescence
The testis was placed in 4% paraformaldehyde solution at 4 °C overnight after the dehydration and embedding of tissue blocks. The experimental procedures for dewaxing, blocking, and the application of primary and secondary antibodies followed the standard protocols for immunohistochemistry (Immunohistochemistry). Following the completion of the secondary antibody incubation, the nuclei were stained with DAPI. Finally, the samples were sealed using Fluoromount™ Aqueous (Sigma, F4680, Germany) Mounting Medium for further analysis.
RNA extraction and RT-qPCR
Total RNA from testicular tissue and mouse TM4 Sertoli cell line was extracted using the EasyPure RNA kit (TRANS, ER101-01, China). Subsequently, cDNA was synthesized through reverse transcription using an RNA reverse transcription kit. RT-qPCR was performed on a Roche Light Cycler 480II System (Roche, Germany) using TB Green Premix Ex TaqII (Takara, RR820A, China). The primer sequences for this study were provided in Table S2.
Fecal microbiota transplantation
Use 3-week-old male ICR mice as recipients for fecal microbiota transplantation. Prepare a solution by mixing 1 g of sheep small intestinal contents with 1 ml of sterile glycerol (20%) and diluting it with normal saline to a concentration of 0.05 g/ml. Mice are treated with a combination of antibiotics, including vancomycin (0.5 g/L), neomycin sulfate (1 g/L), metronidazole (1 g/L), and ampicillin (1 g/L), for two consecutive weeks prior to microbiota transplantation. After the antibiotic treatment, fecal transplantation experiments were conducted daily for a duration of eight weeks.
Cells culture and treatment
Mice TM4 Sertoli cell line were cultured in DMEM medium containing 10% fetal bovine serum (Gibco, 10099-141, Australia) and 1% penicillin-streptomycin (HyClone, SV30010, China). The cells were cultured in a cell incubator at 37 °C and 5% CO2, and the medium was changed every 24 h. Cells were passaged when the cell density reached 80–90%, and cells were treated 24 h later (5 mM L-Citrulline (MCE, HY-N0391, China); 35 μM Sucrose; 35 μM Sucrose + 5 mM L-Citrulline).
Cell proliferation assay
Cell proliferation was detected using MTT Detection kit (Beyotime, C0009, Nantong, China). After 48 h of treatment, discard the medium, add 10 μl/well of MTT working solution into a 96-well plate, and incubate at 37 °C for 4 h in the dark. Next, add 100 μl per well of the Formazan solution from the MTT kit and incubate for 1 h in the dark. Finally, the absorbance of the 96-well plates at 570 nm was measured using a Microplate Reader (Bio-Rad, iMark™, USA).
ROS evaluation
For TM4 cell line, ROS staining reagent (Beyotime, S0033S, China) was added to a 96-well plate. Then, the plate was incubated at 37 °C for 30 min in a dark environment. Following this, the cells were washed twice with PBS and the fluorescence intensity of each group was immediately observed using a Nikon fluorescence microscope. For tissue ROS assessment, tissue homogenates were prepared in liquid nitrogen and centrifuged to obtain the supernatant. ROS levels were measured using a mouse ROS ELISA kit (JILID, J25190, China). Following the addition of enzyme conjugate reagent, the plates were incubated at 37 °C for 60 min. After washing with the provided buffer, the wells were blotted dry and developed with substrate at 37 °C for 15 min, protected from light. Absorbance was measured at 450 nm.
Sertoli cell isolation and culture
Testes from 7-day-old mice were decapsulated and digested sequentially. The first digestion used 0.1% collagenase IV at 37 °C with shaking (85 rpm) for 20 min. After sedimentation, the supernatant was discarded, and the tissue was washed twice with PBS. The second digestion was with 0.1% collagenase IV and 0.1% hyaluronidase at 37 °C for 10 min, followed by centrifugation (500 rpm, 1 min) and PBS washing (x3). The third digestion involved 0.1% collagenase IV, 0.1% hyaluronidase, and 0.25% trypsin at 37 °C for 20 min. After terminating the digestion, the solution was centrifuged (1000 rpm, 3 min), and the pellet was resuspended in culture medium. The single-cell suspension was seeded onto Matrigel-coated dishes and cultured at 34 °C with 5% CO₂ for 48 h. Cells were treated with 20 mM Tris for 2.5 min, washed with DMEM/F12 (x3), and culture was resumed. Drug treatments followed the same protocol as for TM4 cells.
Western blot
The TM4 Sertoli cells were lysed using RIPA buffer (Beyotime, P00113B, China). Proteins were separated by SDS-PAGE and transferred onto PVDF membranes (Millipore, ISEQ00010, Germany). After blocking with 5% BSA for 1 h, the membranes were incubated overnight at 4 °C with primary antibodies (Table S1), followed by a 2 h incubation with HRP-conjugated secondary antibodies at room temperature. Protein bands were visualized and quantified using ImageJ software.
Enzyme-linked immunosorbent assay (ELISA)
The concentrations of L-citrulline in the small intestinal contents and testis were quantified using enzyme-linked immunosorbent assay (ELISA) kits (J43384 and J25562, Giled Biotechnology, Wuhan, China), following the manufacturer’s protocols.
Statistical analysis
In this study, GraphPad Prism (v 8.0) software was used for statistical analysis. Bioassay data were shown as mean ± SEM. Data analysis was performed using two-tailed Student’s t test or one-way analysis of variance (ANOVA). Significant difference was *P < 0.05, **P < 0.01, ***P < 0.0001. Two-tailed Student’s t-test was used to compare the mean differences between two independent samples. One-way ANOVA was used to compare the mean differences among four independent samples, with post-hoc analysis performed using the Tukey’s test.