Characteristics of patients at baseline
Table 1 presents the baseline characteristics of 1,264 survivors and 293 non-survivors stratified by 28-day mortality. While age (p = 0.841) and sex distribution (62% male in both groups, p = 0.963) were comparable, non-survivors had a higher proportion of non-white patients (41.0% vs. 33.5%, p = 0.017). Critically ill patients exhibited significantly impaired physiology, including elevated heart rate (96 vs. 91 bpm, p = 0.002), reduced blood pressure (SBP 112 vs. 119 mmHg, p < 0.001; DBP 62 vs. 66 mmHg, p = 0.004), and marked laboratory derangements (WBC 14 vs. 10 × 10⁹/L, INR 1.70 vs. 1.40; all p < 0.001 except Hb [p = 0.034]). Organ dysfunction was more severe in non-survivors (SOFA 10.0 vs. 5.5), who also had higher burdens of sepsis (51.9% vs. 20.0%), acute kidney injury (77.1% vs. 47.6%), and cirrhosis (46.8% vs. 28.7%)—all strongly associated with mortality (p < 0.001). Conversely, diabetes and cardiovascular comorbidities showed no prognostic significance. Life-sustaining interventions, including CRRT (25.3% vs. 9.1%) and mechanical ventilation (87.0% vs. 77.5%), were administered more frequently to non-survivors.
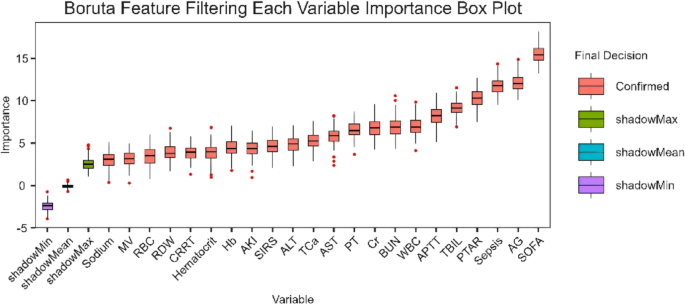
Boruta based feature importance analysis of PTAR in GIB prognosis
This study applied the Boruta algorithm—a random forest-based feature selection method—to systematically assess prognostic factors in GIB patients and identify key predictive indicators. Analytical results revealed that the SOFA score, AG, sepsis, and PTAR exhibited significant independent prognostic value (Fig. 2).
The feature importance analysis based on Boruta pinpoints critical predictors for 28-day mortality in GIB patients
The work provides two key advances: (1) machine learning validation of the PTAR’s prognostic utility in GIB, and (2) development of the first objective, indicator-based risk stratification system for GIB patients. These findings establish the PTAR as a critical predictor of adverse outcomes while offering a data-driven framework for clinical decision-making.
Association between PTAR and all-cause mortality
In the unadjusted Cox proportional hazards model, each unit increase in PTAR was associated with a 2.67-fold higher 28-day mortality risk (HR 2.67, 95% CI 2.19–3.25, p < 0.001) and a 2.50-fold higher 365-day mortality risk (HR 2.50, 95% CI 2.10–2.97, p < 0.001). Similarly, unadjusted analysis in the high-risk GIB cohort demonstrated significantly elevated mortality, with a 28-day HR of 3.31 (95% CI 2.62–4.16, p < 0.001) and a 1-year cumulative HR of 3.01 (95% CI 2.47–3.66, p < 0.001), reinforcing a robust association with adverse clinical outcomes.
In the model adjusted for age and sex (Model 1), PTAR remained significantly associated with mortality risk at both 28 days (HR 2.70, 95% CI 2.22–3.29, p < 0.001) and 365 days (HR 2.51, 95% CI 2.11–2.99, p < 0.001). Furthermore, stratified analyses confirmed significant prognostic discrimination in the high-risk group, with adjusted 28-day HR of 3.38 (95% CI 2.68–4.26) and 1-year HR of 3.05 (95% CI 2.50–3.71), all of which remained statistically significant (p < 0.001).
After further adjustment for clinical and laboratory covariates (Model 2), the association between PTAR and mortality was attenuated but remained statistically significant at both 28 days (HR 1.90, 95% CI 1.47–2.45, p < 0.001) and 365 days (HR 1.73, 95% CI 1.38–2.18, p < 0.001). In stratified analyses, the high-risk group maintained significant predictive value, with adjusted 28-day HR of 1.98 (95% CI 1.54–2.54) and 1-year HR of 1.83 (95% CI 1.48–2.26), all p-values < 0.001. These findings confirm PTAR as an independent predictor of mortality in GIB patients (see Table 2 for complete results).
Analysis of Kaplan-Meier and ROC curves
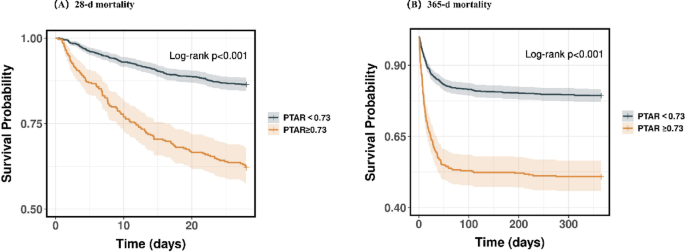
K-M analysis demonstrated significantly higher mortality rates in the high-risk cohort compared to controls at all observed time points: 37.9% vs. 13.5% at 28 days (P < 0.01) and 49.1% vs. 20.7% at 365 days (P < 0.01), with all comparisons showing statistical significance (Fig. 3).
KM survival analysis curves for all-cause mortality in patients with GIB at 28-d (A) and 365-d (B) of hospital admission
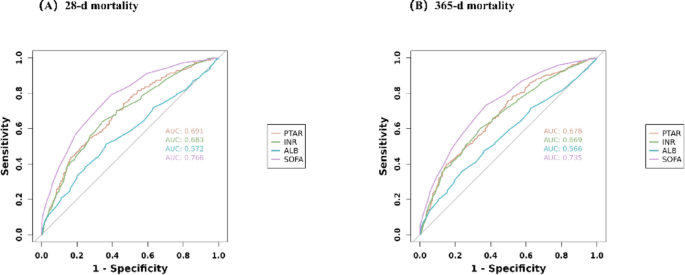
To evaluate the predictive capacity of different biomarkers (PTAR, INR, ALB, and SOFA score), we performed ROC curve analysis. Among these, PTAR showed moderate discrimination ability for all-cause mortality, though with lower performance than the SOFA score (AUC comparison; Fig. 4). Complete statistical comparisons are presented in Table 3.
ROC curves for predicting all-cause mortality in patients with GIB at 28-d (A) and 365-d (B) of hospital admission
Association between PTAR and GIB prognosis: a restricted cubic spline analysis
The RCS regression analysis demonstrated a statistically significant linear association between higher PTAR levels and poorer clinical outcomes in GIB (overall P < 0.001 for all time points). This relationship persisted consistently throughout both short-term (28-day) and long-term (1-year) follow-up, with a clear trend toward worsening prognosis at higher PTAR values (see Fig. 5 for details).
Association between PTAR and Survival with the RCS function at 28-d (A) and 365-d (B) after admission
Subgroup analyses of PTAR on clinical outcomes in GIB patients
We performed stratified subgroup analyses to assess potential interaction effects between the PTAR biomarker and various prespecified demographic and clinical characteristics, specifically age, sex, race, sepsis status, cirrhosis, diabetes, HF, MI, IHD, and CRRT. The PTAR maintained consistent predictive accuracy across all evaluated subgroups (all interaction P-values > 0.005), reinforcing its validity as a robust prognostic indicator. The complete results of these subgroup comparisons are illustrated in Fig. 6.
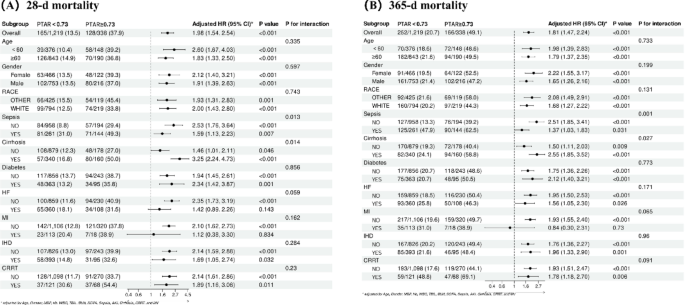
Forest plots of subgroup analysis of the relationship between all-cause mortality and PTAR in patients with GIB admitted 28-d (A) and 365-d (B)
Predictor screening and nomogram model construction
This study aimed to optimize PTAR’s clinical utility by developing a predictive model using the Boruta algorithm, which identified five key prognostic variables: the SOFA score, AG, sepsis status, PTAR, and TBIL. The resulting nomogram provides personalized survival probability estimates at 28 days and 365 days post-evaluation (Fig. 7). The model demonstrated excellent discriminatory performance, with area under the ROC curve (AUC) values of 0.804 (95% CI: 0.776–0.831) for 28-day mortality prediction and 0.791 (95% CI: 0.765–0.816) for 365-day survival (Supplementary Fig. 1). Calibration analysis showed excellent agreement between predicted probabilities and observed outcomes (Supplementary Fig. 2), confirming the nomogram’s accuracy. Decision curve analysis revealed favorable net benefits across clinically relevant thresholds (Supplementary Fig. 3), suggesting potential clinical utility. Internal validation through bootstrap resampling (1000 iterations) yielded a corrected Harrell’s C-index of 0.800, demonstrating robust discrimination while minimizing overfitting. Together, these results support the model’s validity for clinical application.
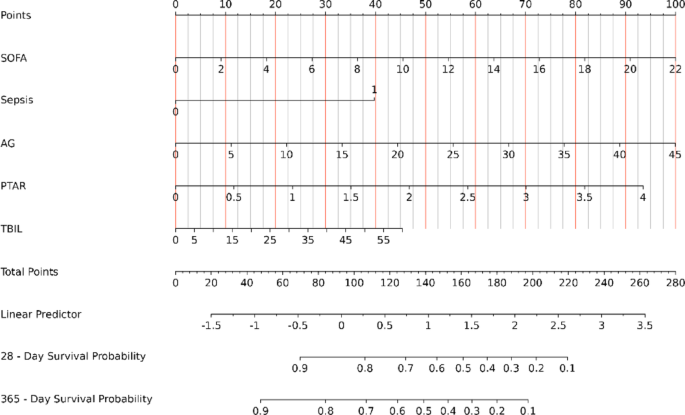
Nomogram for assessing mortality risk in critical gastrointestinal bleeding. SOFA Sequential Organ Failure Assessment, AG Anion Gap, PTAR international normalized ratio-to-albumin ratio, TBIL Total Bilirubin