Bioinformatic analysis of PRMT1 expression and clinical correlation using TCGA data
Publicly available RNA sequencing (RNA-seq) data (Level 3 HTSeq—Counts and Fragments Per Kilobase of transcript per Million mapped reads [FPKM]) and associated clinical information, including overall survival data, for the Head and Neck Squamous Cell Carcinoma (HNSC) cohort were accessed and downloaded from The Cancer Genome Atlas (TCGA) database portal (https://portal.gdc.cancer.gov/). Data processing and normalization pipelines adhered to TCGA standards. For differential expression analyses comparing tumor versus adjacent normal tissues, normalized expression values (e.g., Transcripts Per Million [TPM]) were used. Where appropriate for statistical testing, Log2 transformation (log2[TPM + 1] or log2[FPKM + 1]) was applied to the expression data to approximate a normal distribution.
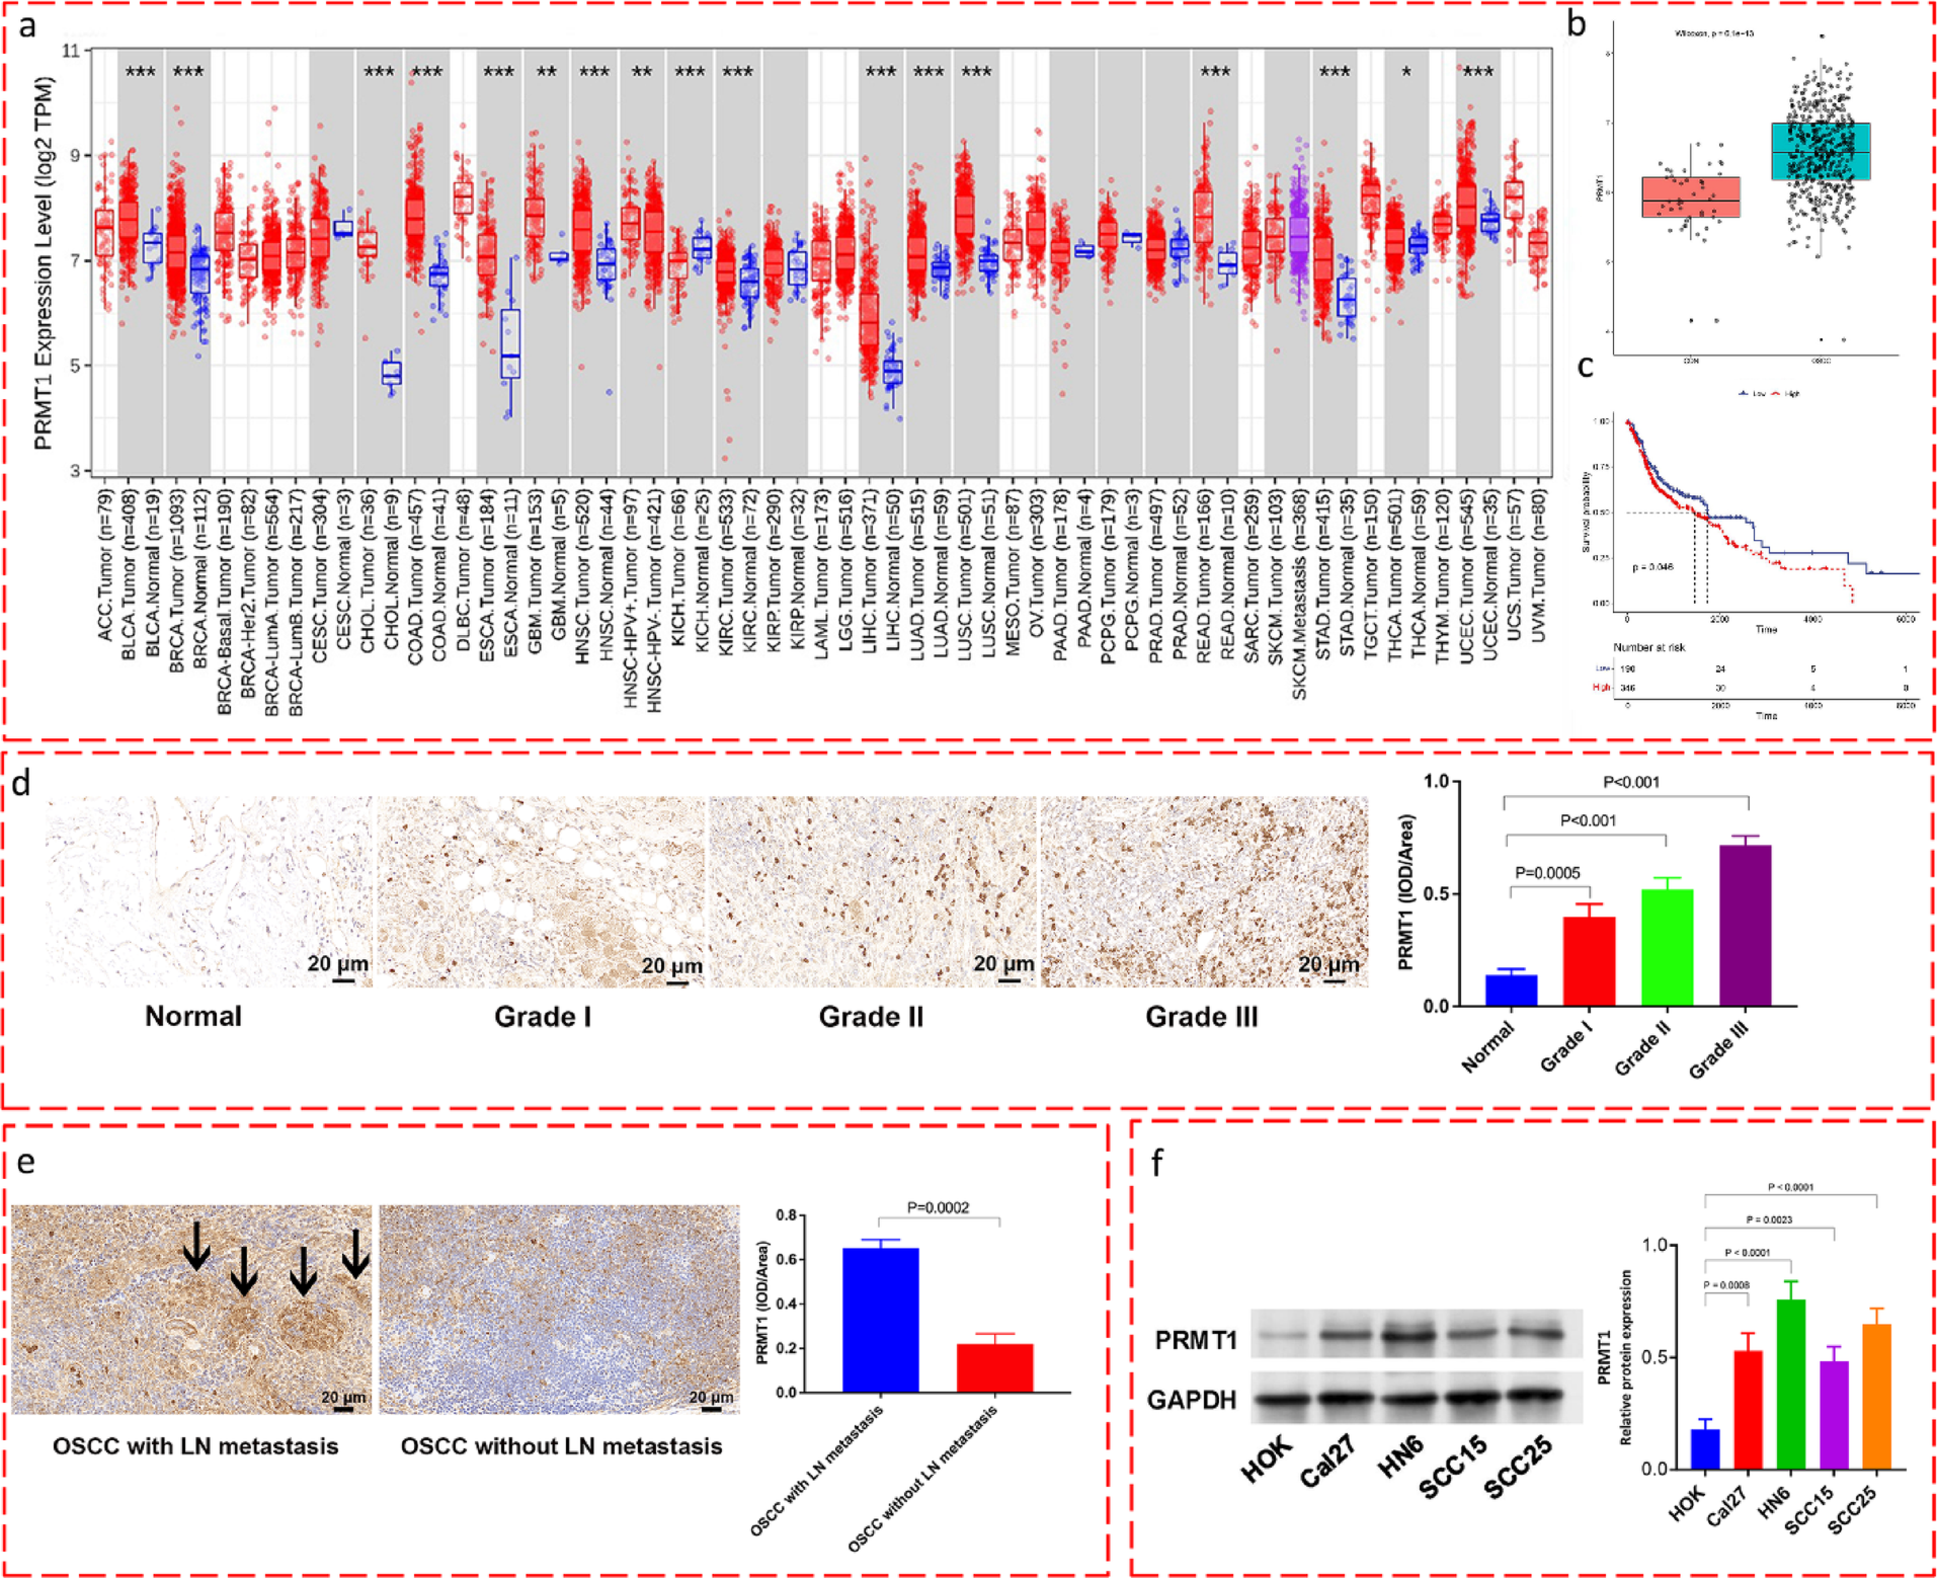
The OSCC subset within of TCGA-HNSC cohort was identified based on primary tumor site annotations (e.g., oral cavity, tongue, floor of mouth) within the clinical data, and only these designated samples were included in the subsequent OSCC-specific analyses. To compare PRMT1 mRNA expression between tumor and adjacent normal tissues, we utilized publicly accessible online tools integrating TCGA data were employed, primarily the Gene Expression Profiling Interactive Analysis (GEPIA) web server (http://gepia.cancer-pku.cn/) and/or the UALCAN portal (http://ualcan.path.uab.edu/).
Survival analysis
To assess the prognostic significance of PRMT1 expression in OSCC, survival analysis was conducted using the clinical follow-up data linked to the RNA-seq profiles of the TCGA-OSCC patient subset. This analysis utilized integrated tools within GEPIA or cBioPortal (http://www.cbioportal.org/), or was performed using custom scripts in R (version 3.6) with the survival and survminer packages. OSCC patients were stratified into “High PRMT1 expression” and “Low PRMT1 expression” groups. The stratification cutoff was determined by the median expression value across the OSCC cohort, though optimal cutoffs determined by the platform was considered. The specific cutoff method used (e.g., median, quartile) was noted from the analysis output. Kaplan–Meier survival curves were generated to visualize the overall survival probability over time for the high- and low-PRMT1 expression groups. The statistical significance of the difference in overall survival between the two groups was assessed using the log-rank (Mantel-Cox) test. A P-value < 0.05 was considered indicative of a statistically significant difference in survival outcomes associated with PRMT1 expression levels. Hazard ratios (HR) and 95% confidence intervals were also recorded from the analysis tools.
Ethical approval and tissue sample collection
This study received approval from the Ethics Committee of Chinese PLA General Hospital (S2025-018–01). The study was conducted according to the guidelines of the Declaration of Helsinki. Written informed consent was obtained from all participating patients prior to sample collection. OSCC tissues, categorized by grade (Grade I, Grade II, Grade III) and lymph node metastasis status (with LN metastasis, without LN metastasis), along with adjacent non-cancerous tissues, were surgically procured from patients undergoing treatment at Chinese PLA General Hospital. Immediately following resection, tissue samples were snap-frozen in liquid nitrogen and stored for subsequent molecular analyses.
Immunohistochemistry (IHC)
Four-micrometer thick sections were prepared from paraffin-embedded blocks human OSCC tumor tissues. The sections were deparaffinized in xylene and rehydrated through a graded ethanol solutions. Heat-mediated antigen retrieval was performed in an appropriate buffer solution. Following blocking of non-specific binding sites, sections were incubated overnight at 4 °C with a primary antibody against PRMT1 (1:500 dilution; ab190892; Abcam, Shanghai, China). After washing, sections were incubated with an appropriate horseradish peroxidase (HRP)-conjugated secondary antibody (ab6721, 1:1000 dilution; Abcam, Shanghai, China) for 2 h at room temperature. Visualization was achieved using a 3,3′-Diaminobenzidine (DAB) substrate kit, followed by counterstaining with hematoxylin. Stained sections were dehydrated, cleared, and mounted. Images were captured using a light microscope (Nikon, Tokyo, Japan). For immunohistochemical analysis of Vimentin and E-cadherin in xenograft tumors, similar procedures were followed using respective primary antibodies after tissue processing.
Cell lines and culture conditions
Human OSCC cell lines HN6, SCC25, Cal27, and SCC15, along with normal human oral keratinocytes (HOK), were obtained from the American Type Culture Collection (ATCC, Manassas, VA, USA). All cell lines were maintained in Dulbecco’s Modified Eagle Medium (DMEM; Gibco, USA) supplemented with 10% fetal bovine serum (FBS; Gibco Laboratories, USA) and 1% penicillin–streptomycin. Cells were cultured in a humidified incubator at 37 °C with an atmosphere containing 5% CO2.
Plasmid construction and cell transfection
Expression vectors based on pcDNA3.1 for overexpressing PRMT1 (OE-PRMT1) and a corresponding empty vector control (OE-NC) were also obtained from GenePharma. For transient transfections, HN6 and SCC25 cells were seeded to reach appropriate confluency. Plasmids were transfected into the cells using Lipofectamine 2000 reagent (Invitrogen, Carlsbad, CA, USA) according to the manufacturer’s protocol. Cells were harvested 48 h post-transfection for subsequent experiments.
Lentiviral shRNA knockdown and generation of stable cell lines
shRNA oligonucleotides targeting human PRMT1 and STAT3 (two independent hairpins per gene) and a non-targeting control (sh-NC) were cloned into pLKO.1-puro. Lentiviruses were produced by co-transfecting HEK293T cells with the shRNA vector and packaging plasmids (pLP1, pLP2, pLP/VSVG; Invitrogen) using Lipofectamine 2000 according to the manufacturer’s instructions. Viral supernatants were collected at 48 and 72 h, clarified by 0.45-µm filtration, supplemented with 4 µg/mL polybrene, and used to infect HN6 or SCC15 cells (two 24-h rounds, MOI ~ 2–5). Forty-eight hours after the final infection, cells were selected in puromycin (2 µg/mL) for 2–3 days to generate stable pooled populations. Knockdown efficiency was assessed by qRT-PCR (Supplementary Fig. S1a–b) and immunoblotting (Fig. 2a). For subsequent experiments we used sh-PRMT1-1 and sh-STAT3-2, which showed the strongest silencing, while results for both hairpins are reported to exclude off-target effects.
Western blot analysis
Total protein was extracted from cultured OSCC cells using RIPA lysis buffer supplemented with protease and phosphatase inhibitors. Protein concentrations were determined using the BCA protein assay kit (Beyotime, Shanghai, China). Equal amounts of protein (20–40 μg) were resolved by 10% sodium dodecyl sulfate–polyacrylamide gel electrophoresis (SDS-PAGE) and subsequently transferred onto polyvinylidene difluoride (PVDF) membranes (Beyotime, Shanghai, China). Membranes were blocked with 5% non-fat dry milk or bovine serum albumin (BSA) in Tris-buffered saline containing 0.1% Tween-20 (TBST) for 1 h at room temperature. Membranes were then incubated overnight at 4 °C with primary antibodies diluted in blocking buffer. The primary antibodies used were: anti-PRMT1 (1:1000; ab190892; Abcam), anti-E-cadherin (1:1000; ab40772; Abcam), anti-N-cadherin (1:5000; ab76011; Abcam), anti-Vimentin (1:1000; ab92547; Abcam), anti-ADMA (Asymmetric dimethylarginine; 1:100; ab413; Abcam), anti-phospho-STAT3 (Tyr705) (p-STAT3; 1:2000; ab76315; Abcam), anti-Lamin B (1 µg/mL; ab232731; Abcam), anti-VEGFA (1 µg/mL; ab46154; Abcam), anti-IL-6 (1:1000; ab9324; Abcam), anti-c-myc (1:1000; ab32072; Abcam), anti-GPX4 (concentration not specified in draft, standard dilutions 1:1000), anti-GAPDH (concentration not specified, 1:5000–1:10,000), and anti-β-actin (1 µg/mL; ab8226; Abcam). After washing with TBST, membranes were incubated with appropriate HRP-conjugated secondary antibodies (e.g., ab7090, 1:2000; Abcam) for 2 h at room temperature. Protein bands were visualized using an enhanced chemiluminescence (ECL) detection kit (Thermo Fisher Scientific, Inc., Waltham, MA, USA) and imaged using a suitable detection system. Band intensities were quantified using ImageJ software (NIH, Bethesda, MD, USA) or similar software, with GAPDH or β-actin serving as loading controls.
Cell viability assay (CCK-8)
Cell viability was assessed using the Cell Counting Kit-8 (CCK-8; Dojindo Laboratories, Kumamoto, Japan). HN6 and SCC25 cells were seeded into 96-well plates at a density of 1000 cells per well. After adherence and appropriate treatments (e.g., varying concentrations of Doxorubicin (DOX) or Cisplatin (CDDP)), 10 μL of CCK-8 solution was added to each well, followed by incubation for 2 h at 37 °C. The absorbance at 450 nm was measured using a microplate spectrophotometer (Thermo Fisher Scientific). Dose–response curves were fitted using a four-parameter logistic regression (4PL) model in GraphPad Prism 9.0, and half-maximal inhibitory concentrations (IC50 values, mean ± SD) were calculated from 3 independent experiments. Statistical significance between IC50 values of sh-NC and sh-PRMT1 groups was assessed using an extra-sum-of-squares F-test.
Colony-formation assay
Cells were trypsinized to single-cell suspensions and seeded in 6-well plates (500–1,000 cells/well) in complete medium. After 10–14 days (with medium changes every 3–4 days), colonies were fixed (4% paraformaldehyde, 15 min) and stained with 0.5% crystal violet (30 min), rinsed, air-dried, and colonies ≥ 50 cells were counted by two blinded observers. For quantification, colony counts per well were averaged across three biological replicates and analyzed by two-sided Student’s t-test (Supplementary Fig. S1c).
Cell proliferation assay (BrdU and EdU)
Cell proliferation was evaluated using Bromodeoxyuridine (BrdU) incorporation. Cells were incubated with BrdU labeling solution for a specified period, 3 h. Subsequently, cells were fixed, permeabilized, and treated with DNase to expose incorporated BrdU. Detection was performed using an anti-BrdU antibody conjugated to a fluorophore, followed by counterstaining with DAPI (4′,6-diamidino-2-phenylindole) to visualize nuclei. Images were acquired using a fluorescence microscope (Leica, Hilden, Germany), and the percentage of BrdU-positive cells relative to the total number of DAPI-stained cells was calculated.
For experiments related to ferroptosis rescue, cell proliferation was assessed using the Cell-Light EdU DNA Cell Proliferation Kit (RiboBio, Guangzhou, China). Briefly, HN6 and SCC25 cells were incubated with 50 μM EdU solution for 2 h. Cells were then fixed with 4% paraformaldehyde and permeabilized with 0.5% Triton X-100. EdU incorporation was detected by click chemistry using an Apollo dye solution according to the manufacturer’s protocol. Nuclei were counterstained with DAPI. EdU-positive cells were visualized and quantified using fluorescence microscopy (Leica, Hilden, Germany).
Transwell invasion assay
Cell invasion capacity was measured using Transwell chambers (8 μm pore size; Corning, NY, USA) coated with Matrigel (BD Biosciences, Franklin Lakes, NJ, USA). HN6 or SCC25 cells (approximately 5 × 10⁴ to 1 × 10⁵ cells) were resuspended in 200 μL of serum-free DMEM and seeded into the upper chamber. The lower chamber was filled with 600 μL of DMEM containing 20% FBS as a chemoattractant. After incubation for 48 h at 37 °C, non-invading cells on the upper surface of the membrane were removed with a cotton swab. Cells that had invaded through the Matrigel and membrane to the lower surface were fixed with 4% paraformaldehyde and stained with 0.1% crystal violet solution. Invaded cells were photographed and counted in several randomly selected fields under a microscope (Olympus Optical Co., Ltd., Tokyo, Japan).
In Vivo xenograft tumor model
All animal experiments were approved by the Animal Ethics Committee of Beijing Viewsolid Biotechnology Co. LTD. All animal experiments were conducted in accordance with the ARRIVE guidelines. Male BALB/c nude mice (4–6 weeks old) were obtained from Vital River Laboratory Animal Technology Co., Ltd. (Beijing, China). For subcutaneous xenografts, 1 × 10⁶ transfected HN6 cells (e.g., sh-NC, sh-PRMT1, STAT3-WT, STAT3-KO) suspended in 100 μL PBS were injected into the right flank of each mouse. Tumor growth was monitored regularly by measuring tumor dimensions with calipers. Tumor volume was calculated using the formula: Volume = (length × width2) / 2. For therapeutic studies, treatments began when tumors reached a palpable size. Treatment groups received intraperitoneal injections of Cisplatin (CDDP; 150 mg/kg, administered twice a week), anti-PD-1 antibody (200 μg per mouse, frequency specified if different), or MS023 (PRMT1 inhibitor; 80 mg/kg, intraperitoneal injection, frequency specified if different), or saline control. After 28 days (or as specified), mice were euthanized by cervical dislocation. Tumors were excised, weighed, photographed, and processed for histological or molecular analysis. For metastasis studies, lung tissues were also collected at necropsy.
Lung metastasis assessment and hematoxylin–eosin (HE) staining
Harvested lung tissues were fixed in 4% paraformaldehyde and embedded in paraffin. Serial Sects. (4 μm thickness) were prepared and stained with Hematoxylin and Eosin (HE) following standard protocols. The number of visible metastatic nodules on the lung surface was counted macroscopically before fixation, and/or microscopically on HE-stained sections. Representative images of lung histology were captured using a microscope (Olympus, Japan).
Co-immunoprecipitation (Co-IP)
To investigate protein interactions, Co-IP assays were performed using a Co-IP kit (Abison Biotechnology Co. Ltd, China). HN6 or SCC25 cells were treated with the proteasome inhibitor MG-132 (10 µM) for several hours before lysis to stabilize protein complexes. Cells were lysed in immunoprecipitation buffer. Cell lysates were clarified by centrifugation, and the supernatants were incubated overnight at 4 °C with primary antibodies against the target protein (e.g., anti-STAT3 for detecting interaction with ADMA-modified proteins, or anti-HA/Flag for tagged proteins, or anti-PRMT1) or control IgG. Protein A/G agarose beads were added and incubated for another 2–4 h to capture antibody-protein complexes. Beads were extensively washed with lysis buffer. Immunoprecipitated proteins were eluted by boiling in SDS loading buffer and analyzed by Western blotting using antibodies against the potential interaction partners (e.g., anti-ADMA, anti-STAT3, anti-PRMT1, anti-HA, anti-Flag). Input lysates were simultaneously analyzed to confirm the expression of target protein.
Flow cytometry analysis of immune cells and ROS
For analysis of immune cell in peripheral blood from treated mice, 100 μL of whole peripheral blood was collected. Red blood cells were lysed, and remaining leukocytes were stained with fluorochrome-conjugated monoclonal antibodies against surface markers: anti-CD3 (ab38483; Abcam), anti-CD8 (ab38483; Abcam). For intracellular staining, cell were fixed, permeabilized, and stained with an antibody against Granzyme B (GranB; ab38483; Abcam). Staining was performed in the dark for 30 min at 4 °C. After washing, cells were analyzed using a flow cytometer to quantify the percentages of CD3 + CD8 + T cells and GranB + cells within the CD8 + population. For the detection of intracellular Reactive Oxygen Species (ROS), cultured cells were incubated with the ROS-sensitive fluorescent probe DCFH-DA (included in kit S0033S, Beyotime, Shanghai, China) according to the manufacturer’s instructions. After incubation, cells were washed, harvested, and resuspended in PBS. Fluorescence intensity, which correlates with ROS levels, was measured using flow cytometry. Data analysis included measuring the mean fluorescence intensity (MFI).
Chromatin immunoprecipitation (ChIP) assay
ChIP assays were conducted using a commercial kit (Beyotime, Beijing, China) following the manufacturer’s instructions. Briefly, 293 T cells (or OSCC cells if applicable) were cross-linked with 1% formaldehyde for 10 min at room temperature. Cross-linking was quenched with glycine. Cells were lysed, and chromatin was sheared into fragments of approximately 200–500 base pairs using sonication. The sheared chromatin was pre-cleared and then incubated overnight at 4 °C with an antibody against STAT3 or a control IgG antibody. Immune complexes were captured using Protein A/G agarose beads. After extensive washing, cross-links were reversed, and DNA was purified. The enrichment of specific GPX4 promoter regions (P1, P2, P3, and P4, defined by primer pairs) in the immunoprecipitated DNA was quantified by quantitative polymerase chain reaction (qPCR) using specific primers for these regions. Results were normalized to input DNA.
Luciferase reporter assay
A putative promoter region of the human GPX4 gene containing predicted STAT3 binding sites (WT2 region: -1136 to -491), alongside a version with the binding sites mutated (MUT2), were cloned into the pGL3-Basic luciferase reporter vector (Promega, Madison, WI, USA). The empty pGL3-Basic vector served as a negative control. 293 T cells were co-transfected with one of these GPX4 promoter-luciferase constructs along with a STAT3 expression vector (or an empty vector control) and a Renilla luciferase vector (pRL-TK) for normalization. At 48 h post-transfection, cells were lysed, and luciferase activities (Firefly and Renilla) were measured using the Dual-Luciferase Reporter Assay System (Promega) according to the manufacturer’s protocol. Firefly luciferase activity was normalized to Renilla luciferase activity to control for transfection efficiency.
Measurement of ferrous iron (Fe2 +) levels
Intracellular labile ferrous iron (Fe2 +) levels were quantified using a commercial Iron Assay Kit (ab83366; Abcam, Shanghai, China) according to the manufacturer’s instructions. Briefly, cell lysates were prepared, and the assay utilizes a chromogen that reacts specifically with Fe2 + to produce a colored product. The absorbance was measured at the recommended wavelength using a microplate reader, and Fe2 + concentrations were calculated based on a standard curve.
Measurement of lipid peroxidation (MDA) and glutathione (GSH)
Levels of malondialdehyde (MDA), an indicator of lipid peroxidation, and glutathione (GSH), a key antioxidant, were measured in cell lysates or tissue homogenates using commercial enzyme-linked immunosorbent assay (ELISA) kits. MDA levels were determined using the MDA assay kit (ab118970; Abcam, Shanghai, China), and GSH levels were measured using the GSH assay kit (ab65322; Abcam, Shanghai, China), strictly following the protocols provided by the manufacturer. Absorbance readings were taken using a microplate reader, and concentrations were determined by comparison to standard curves provided with the kits.
Statistical analysis
All quantitative data are presented as the mean ± standard deviation (SD) from at least three independent experiments or biological replicates. Statistical analyses were performed using GraphPad Prism Software (version 9, GraphPad Software, La Jolla, CA, USA). Comparisons between two groups were made using a two-tailed Student’s t-test. Comparisons among three or more groups were performed using one-way analysis of variance (ANOVA) followed by an appropriate post-hoc test (e.g., Tukey’s test). Correlations were assessed using Pearson’s correlation coefficient. Kaplan–Meier survival curves were compared using the log-rank test. A P-value less than 0.05 (P < 0.05) was considered statistically significant, with specific P-values provided in the figures.