Relationship of E2-hCG levels with pregnancy outcomes under antagonist protocol
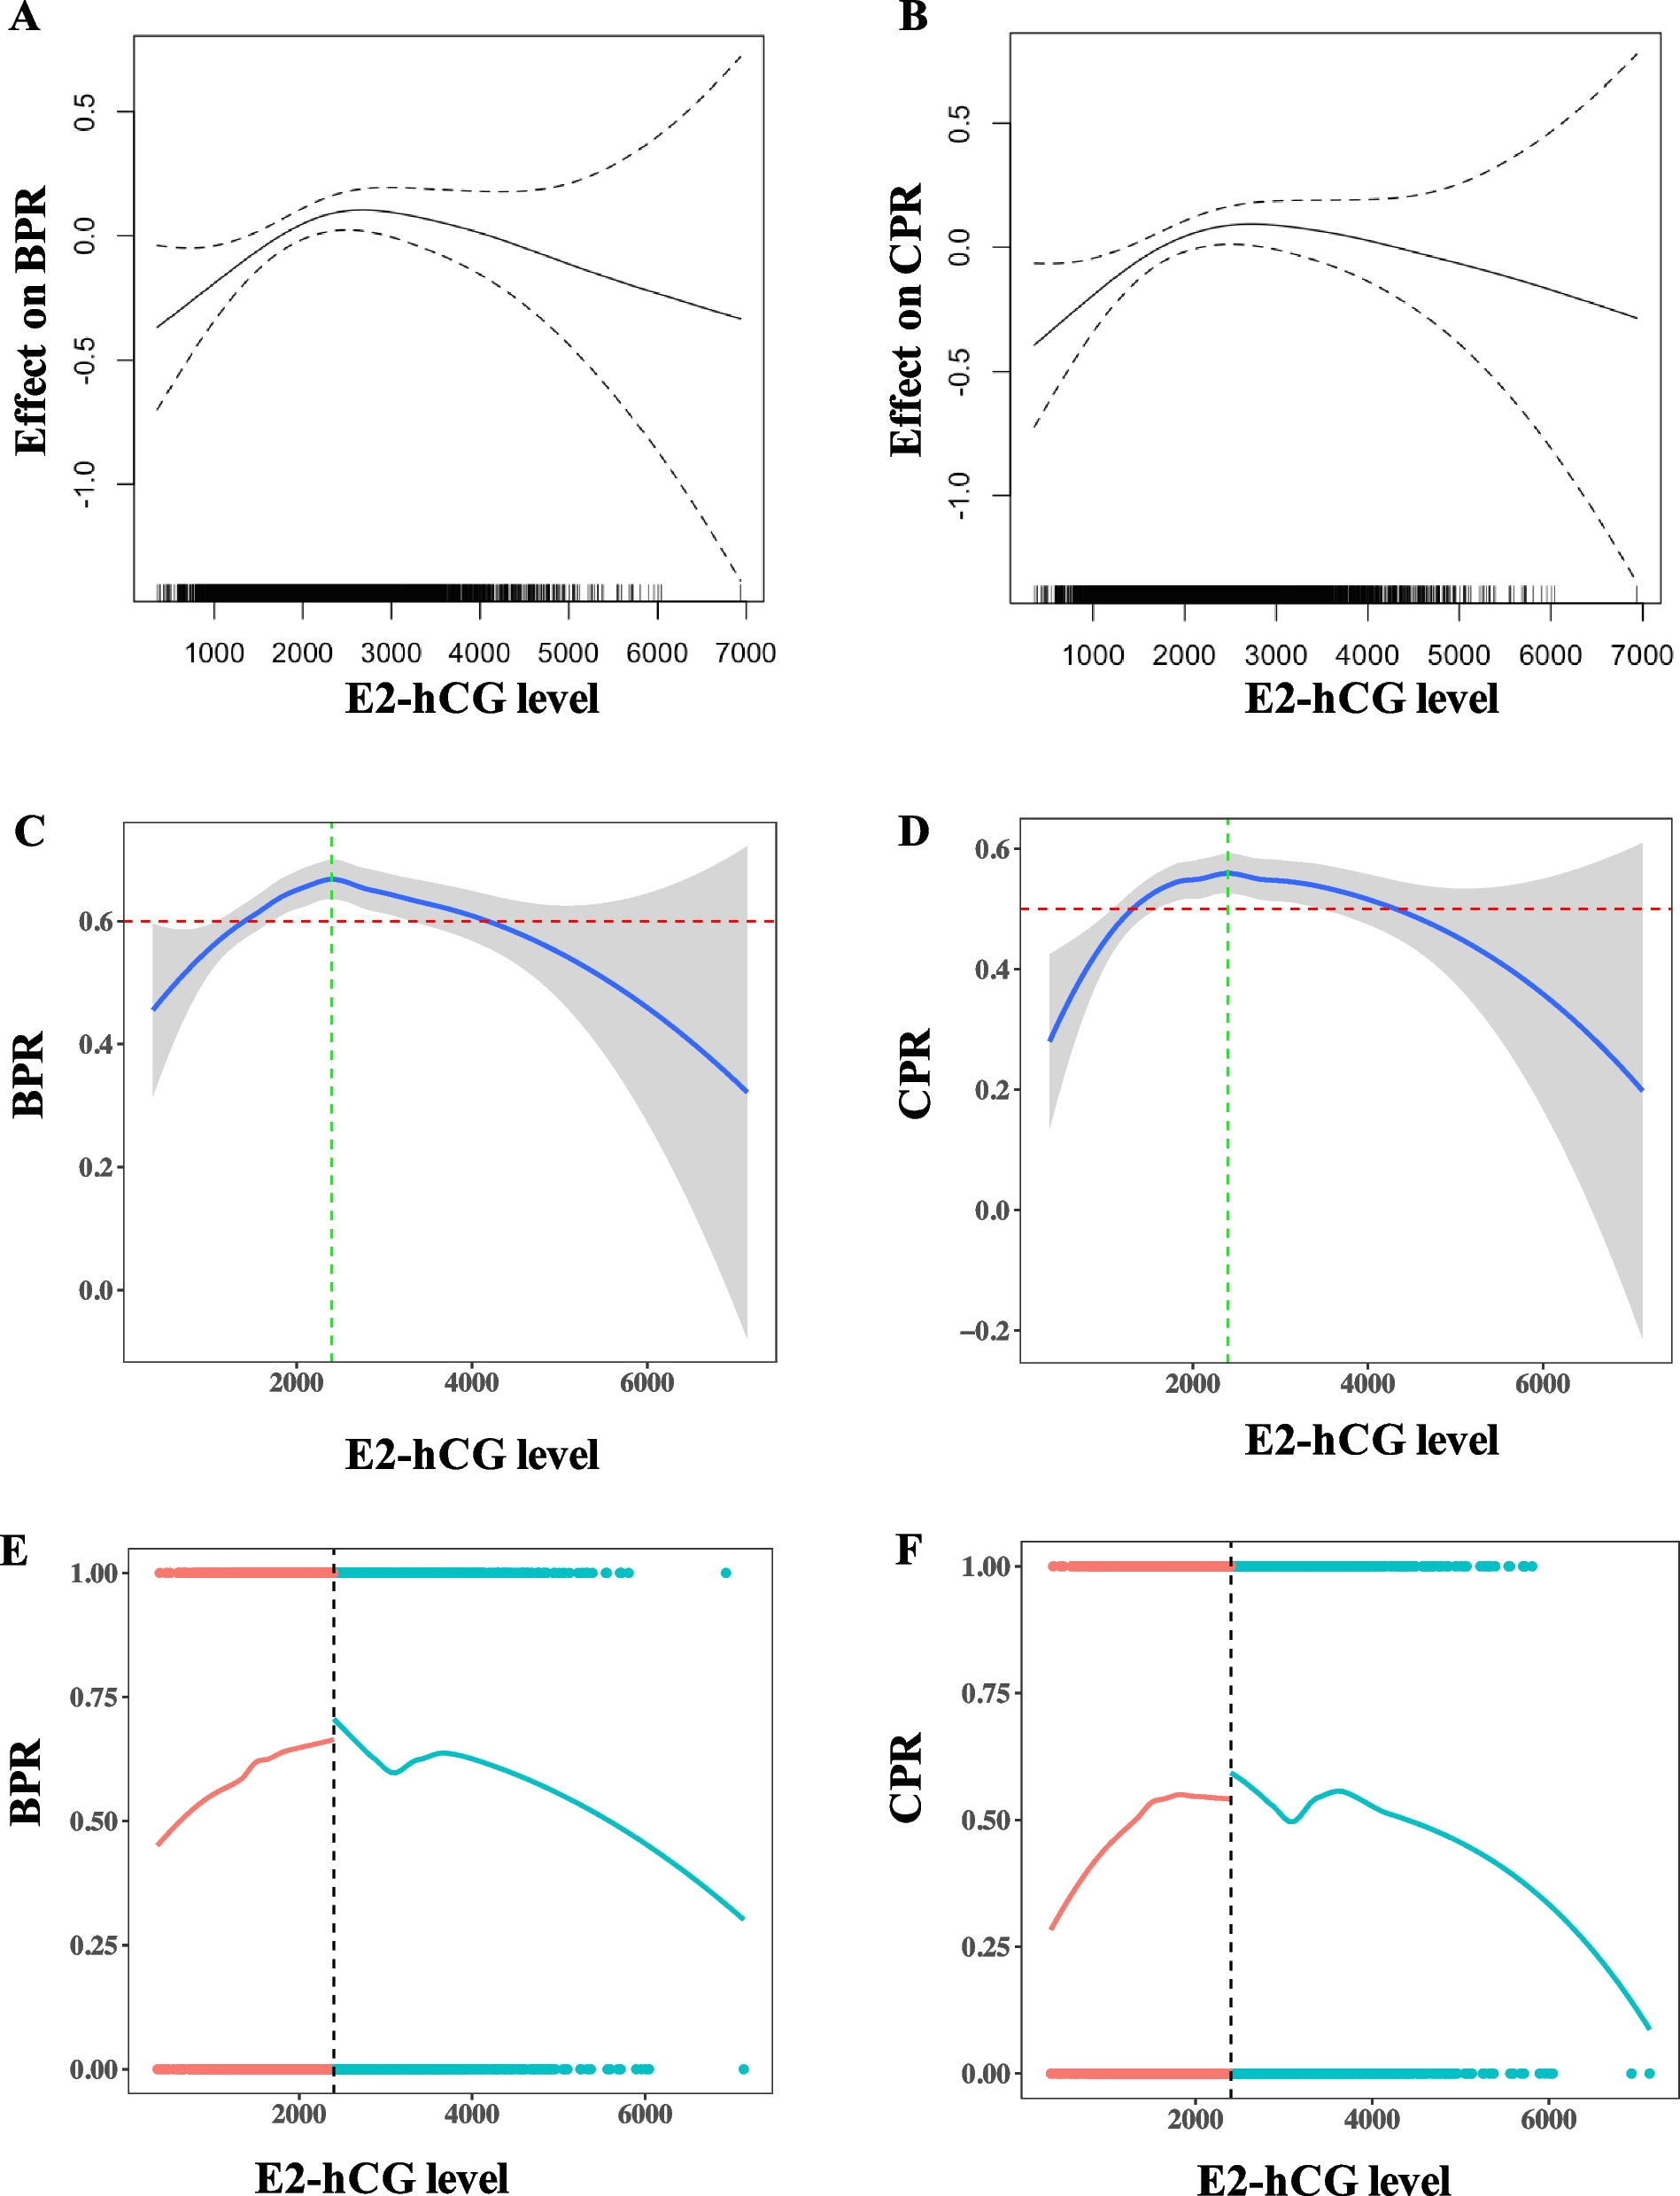
From October 2020 to July 2024, 3192 fresh ET cycles following antagonist protocol were included. The relationship between E2-hCG level with pregnancy outcomes was detected by multivariate regression using the generalized additive models (GAM) adjusted with confounders. The adjusted confounding factors included female age, transferred embryo phase, number of embryos transferred, number of good embryos transferred, endometrial thickness on hCG day, progesterone levels on hCG day, and total dose of GnRH antagonist. GAM and loess smooth line showed that the E2-hCG level has a curved inverted U-shaped relationship with biochemical pregnancy rate (BPR) (Fig. 1A, C) and clinical pregnancy rate (CPR) (Fig. 1B, D). The loess smooth line shows the BPR and CPR changing with E2-hCG levels, with a peaked pregnancy rate at about 2400 pg/mL (Fig. 1C and D, green vertical line). Segmented regression further validated the turning point of E2-hCG to be about 2400 pg/mL (Fig. 1E and F), BPR increased 2% (OR 1.02, 95%CI 1.01 ~ 1.03, p-value < 0.001) and CPR increased 2% (OR 1.02, 95%CI 1.01 ~ 1.03, p-value < 0.001) with every 200 pg/ml of E2-hCG increase when E2-hCG < 2400 pg/ml (Table 1), while BPR decreased 3% (OR 0.97, 95%CI 0.96 ~ 0.99, p-value < 0.001) and CPR decreased 2% (OR 0.98, 95% CI 0.96 ~ 0.99, p-value < 0.001) with every 200 pg/ml of E2-hCG increase when E2-hCG ≥ 2400 pg/ml (Table 1). The above results collectively indicate that the relationship between E2-hCG and pregnancy rates peaked at the turning point of 2400 pg/ml. Below this turning point, the pregnancy rates increase with E2-hCG levels rise. Conversely, above this turning point, the pregnancy rates show a descending trend with E2 levels rising.
Association of E2-hCG level with pregnancy outcomes. A Relationship of E2-hCG level with biochemical pregnancy in fresh ET under antagonist protocol, analyzed with GAM adjusted with confounders. B Relationship of E2-hCG level with clinical pregnancy in fresh ET under antagonist protocol, analyzed with GAM adjusted with confounders. C Loess smooth line showing the BPR changing with E2-hCG levels, green vertical line showing the turning point of 2400 pg/ml, red horizontal line showing the expected BPR of 60%. D Loess smooth line showing the CPR changing with E2-hCG levels, green vertical line showing the turning point of 2400 pg/ml, red horizontal line showing the expected CPR of 50%. E Segmented smooth line showing the BPR pre- and post-segment. Red line denotes E2-hCG < 2400 pg/ml, blue line denotes E2-hCG ≥ 2400 pg/ml. F Segmented smooth line showing the CPR pre- and post-segment. Red line denotes E2-hCG < 2400 pg/ml, blue line denotes E2-hCG ≥ 2400 pg/ml
Characteristics and pregnancy outcomes across different E2-hCG range groups
Based on the loess smooth curves and expected pregnancy rates depicted in our above figures (Fig. 1C, red horizontal line, the expected BPR is set as 60%, and Fig. 1D, red horizontal line, the expected BPR is set as 50%), E2-hCG levels have been categorized into three groups: E2-hCG < 1500 pg/mL, 1500 ≤ E2-hCG ≤ 4000 pg/mL, and E2-hCG > 4000 pg/mL. Among the 3192 fresh ET cycles, 736 cycles had an E2-hCG level of < 1500, 2261 cycles had a level of 1500–4000, and 195 cycles had a level of > 4000. The baseline characteristics stratified by groups of different E2-hCG levels are shown in Table 2. The female age, BMI, AMH, infertile type, Gn start dose, Gn total dose, Gn total day, number of oocytes, number of MII oocytes, number of ET, P4 on hCG day, embryo phase, and number of good embryos, and total dose of GnRH antagonist were significantly different between the groups. The endometrial thickness on hCG day and infertile year were not significantly different between the three groups. The biochemical pregnancy rates and clinical pregnancy rates for each group are presented in Table 3. The BPR in the E2-hCG < 1500 pg/ml, 1500 ≤ E2-hCG ≤ 4000 pg/mL, and E2-hCG > 4000 pg/ml groups was 57.20%, 64.26%, and 57.95%, the BPR in 1500 ≤ E2-hCG ≤ 4000 pg/mL group is significantly higher than that in the < 1500 pg/ml group (64.26% vs 57.20%, p-value = 0.001), the BPR in 1500 ≤ E2-hCG ≤ 4000 pg/mL group was higher than that of E2-hCG > 4000 group with marginal significance (64.26% vs 57.95%, p-value = 0.09), the BPR was not statistically different between the other two groups. The CPR in the E2-hCG < 1500 pg/ml, 1500 ≤ E2-hCG ≤ 4000 pg/mL, and E2-hCG > 4000 pg/ml groups was 47.42%, 54.71%, and 47.18%, the CPR in 1500 ≤ E2-hCG ≤ 4000 pg/mL group is significantly higher than that in the < 1500 pg/ml group (54.71% vs 47.42%, p-value = 0.001), the CPR in 1500 ≤ E2-hCG ≤ 4000 pg/mL group was significantly higher than that of E2-hCG > 4000 group (54.71% vs 47.18%, p-value = 0.05), the CPR was not statistically different between the other two groups. The miscarriage rates between the three groups were not significantly different.
Independent relationship between different E2-hCG ranges with pregnancy outcomes
As Table 2 shows some baseline characteristics between the three groups were significantly different. We further investigate the independent relationship between different E2-hCG ranges with pregnancy outcomes by multi-regression models adjusted with confounding factors. The results showed that 1500 ≤ E2-hCG ≤ 4000 pg/mL significantly increased 30% BPR (OR 1.30, 95%CI 1.07 ~ 1.56, p-value = 0.007) (Table 4) and 28% CPR (OR 1.28, 95%CI 1.07 ~ 1.54, p-value = 0.008) (Table 5) compared to E2-hCG < 1500 pg/mL. However, E2-hCG > 4000 pg/mL did not significantly increase BPR (OR 1.13, 95%CI 0.80 ~ 1.60, p-value = 0.50) (Table 4) and CPR (OR 1.07, 95%CI 0.76 ~ 1.50 p-value = 0.71) compared to E2-hCG < 1500 pg/mL. In the multi-regression regression, female age was transformed into two groups of < 33 years and ≥ 33 years, because BPR and CPR start to decline after 33 years old, the GAM model founding the turning point of female age on pregnancy outcomes to be 33 (Supplementary Fig. 1).
Subgroup analysis
In consideration of confounding factors such as female age and embryo phase on pregnancy outcomes, we further performed subgroup analysis based on female age and embryo phases. We divided female age into two subgroups including age <33 and age ≥33 years. In subgroup of female age <33 years, the BPR in the E2-hCG<1500 pg/ml, 1500≤E2-hCG≤4000pg/mL, and E2-hCG>4000 pg/ml groups was 63.40%, 67.76%, and 58.70%, the BPR in 1500≤E2-hCG≤4000pg/mL group is higher than that in the >4000 pg/ml group with statistical significance (67.76% vs 58.70%, p-value=0.04), the BPR was not statistically different between the other two comparisons. The CPR in the E2-hCG<1500 pg/ml, 1500≤E2-hCG≤4000pg/mL, and E2-hCG>4000 pg/ml groups was 53.58%, 59.00%, and 49.28%, the CPR in 1500≤E2-hCG≤4000pg/mL group is significantly higher than that in the >4000 pg/ml group (59.00% vs 49.28%, p-value=0.03), the CPR in 1500≤E2-hCG≤4000pg/mL group was higher than that in the E2-hCG<1500 pg/ml group with marginal significance (59.00% vs 53.58%, p-value=0.07), the CPR was not statistically different between the E2-hCG<1500 pg/ml and E2-hCG>4000 pg/ml groups. In subgroup of female age ≥33 years, the BPR in the E2-hCG<1500 pg/ml, 1500≤E2-hCG≤4000pg/mL, and E2-hCG>4000 pg/ml groups was 50.70%, 58.53%, and 56.14%, the BPR in 1500≤E2-hCG≤4000pg/mL group is significantly higher than that in the <1500 pg/ml group (58.53% vs 50.70%, p-value=0.01), the BPR was not statistically different between the other two comparisons. The CPR in the E2-hCG<1500 pg/ml, 1500≤E2-hCG≤4000pg/mL, and E2-hCG>4000 pg/ml groups was 40.95%, 47.66%, and 42.11%, the CPR in 1500≤E2-hCG≤4000pg/mL group is significantly higher than that in the <1500 pg/ml group (47.66% vs 40.95%, p-value=0.04), the CPR was not statistically different between the other two comparisons. The results indicate that pregnancy rates were lower in the elder group. In the younger population (female age <33 years), pregnancy outcomes were more likely to be impacted in the higher E2-hCG group (>4000 pg/ml). In elder population (female age ≥33 years), pregnancy outcomes were more likely to be impacted in the lower E2-hCG group (<1500 pg/ml) (Table 6).
More than 95% of patients transferred with cleavages, therefore, we performed subgroup analysis in patients transferred with cleavages only, a subgroup of blastocyst was not analyzed due to a very small sample size. In subgroup of patients transferred with cleavages, the BPR in E2-hCG < 1500 pg/ml, 1500 ≤ E2-hCG ≤ 4000 pg/mL, and E2-hCG > 4000 pg/ml groups was 57.30%, 64.59%, 57.46%, the BPR in the 1500 ≤ E2-hCG ≤ 4000 pg/mL group is higher than that in the < 1500 pg/ml group with statistical significance (64.59% vs 57.30%, p-value = 0.001), the BPR in 1500 ≤ E2-hCG ≤ 4000 pg/mL group is higher than that in the > 4000 pg/ml group with marginal significance (64.59% vs 57.46%, p-value = 0.07), the BPR was not statistically different between the E2-hCG < 1500 pg/ml and E2-hCG > 4000 pg/ml groups. The CPR in E2-hCG < 1500 pg/ml, 1500 ≤ E2-hCG ≤ 4000 pg/mL, and E2-hCG > 4000 pg/ml groups was 47.47%, 55.03%, 47.51%, the CPR in the 1500 ≤ E2-hCG ≤ 4000 pg/mL group is higher than that in the < 1500 pg/ml group with statistical significance (55.03% vs 47.47%, p-value = 0.001), the CPR in 1500 ≤ E2-hCG ≤ 4000 pg/mL group is higher than that in the > 4000 pg/ml group with marginal significance (55.03% vs 47.51%, p-value = 0.07), the BPR was not statistically different between the E2-hCG < 1500 pg/ml and E2-hCG > 4000 pg/ml groups. The miscarriage rate was not significantly different between the three groups in each subgroup. The baseline characteristics between the three groups in each subgroup were shown in supplementary tables.