Mayflies
Larvae of E. lateralis were collected from the Domini creek (Northern Hungary, N 47°40′6.898″ E 18°58′0.109″) and were kept in the laboratory in an aerated aquarium. Biofilm on field-collected stones provided food for the larvae, which emerged in 1–3 weeks after collection. The aquarium was placed in a cage, which prevented the emerged adults from escaping.
ERG recordings
Mayflies were prepared on a piece of plexiglas. In the case of adults, the abdomen and partly the thorax with the wings were fastened to the plexiglas with adhesive tape, while the head and the forelegs were fixed to the plexiglas using melted paraffin wax. Abdomen of larvae was also attached to the plexiglas with adhesive tape, and a water droplet was injected around the gills beneath the tape. For fixing the larval mandibles, the same adhesive tape was used. Tungsten electrodes etched in saturated KNO2 solution were used for recording. The recording and reference electrodes were inserted to the right eye and the abdomen, respectively. Photoreceptor responses were amplified with a Model 3000 AC/DC Differential Amplifier (A-M Systems, Carlsborg, Washington, USA) and were recorded with a USB sound card (C-Media CM6206 chipset) modified for DC measurements. Recordings were made with Audacity 2.2.1 audio recording software (https://www.audacityteam.org) in 16-bit WAV format. The linearity of the sound card inputs was checked and verified within the ± 1 V range, therefore the output of the amplifier was kept far within this range. The left and right channels, respectively, were used for recording the amplified photoreceptor responses and a square wave reference signal indicating the presence of the light stimulus. The reference signal facilitated the detection of photoreceptor responses in the data and enabled us to calibrate the voltage level of the left channel.
Spectral sensitivity
Spectral sensitivity of E. lateralis compound eyes was measured with the flash method12. Quasi-monochromatic light stimuli of different wavelengths and intensities were created with a custom-built LED-based light source17. The following wavelengths (± half bandwidth of LED) were used in the measurements: 346 nm (± 5.0 nm), 376 nm (± 4.8 nm), 402 nm (± 5.5 nm), 421 nm (± 6.4 nm), 442 nm (± 8.5 nm), 467 nm (± 10.4 nm), 496 nm (± 13.5 nm), 516 nm (± 14.5 nm), 552 nm (± 17.7 nm), 598 nm (± 6.9 nm), 623 nm (± 7.7 nm), 641 nm (± 8.6 nm). A Moritex SOHC4S3.5-1500S quartz light guide was used for delivering the light stimuli to the eye preparation.
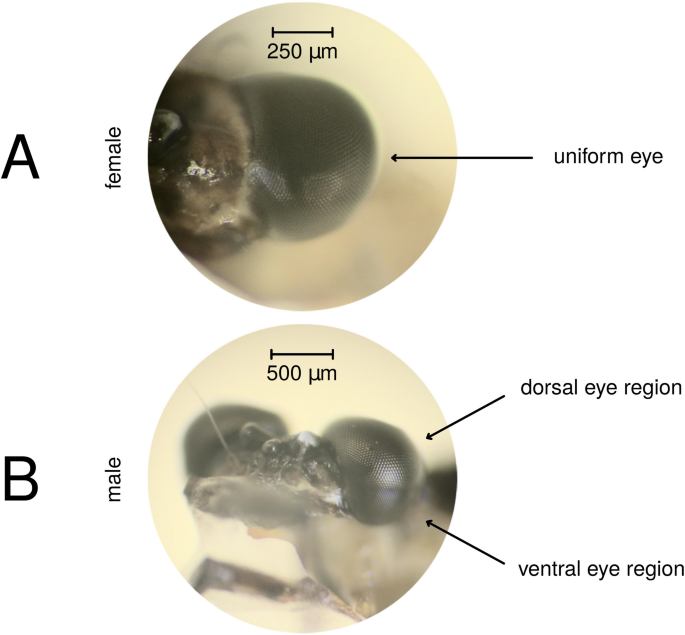
Spectral sensitivity of adult female compound eyes and male ventral eye regions were performed on compound eyes adapted to darkness, to the light of a green (562 nm ± 23.8 nm; peak wavelength ± half bandwidth) and UV (377 nm ± 8.9 nm) LED. The dorsal eye region of males was measured only dark-adapted. Spectral sensitivity of female and male larvae was measured on dark- and green-adapted individuals. Dark-adaptation was at least 40 min long. Although in the case of larvae no eye regions could be distinguished visually, recording electrodes were inserted to the lower eye region. Photon flux of the adapting light was 1.4 × 10¹⁴ photons cm−2 s−1 and the optical axis of the light guide encompassed approximately 20° with the light stimulation. Chromatic adaptation was 15 min long and was often applied on previously dark-adapted eye preparations, the spectral sensitivity of which was just measured. Numbers of measurement types are summarised in Table 1.
Measurement of a given eye preparation consisted of the repetition of the same stimulus sequence during which the applied wavelengths were in increasing then in decreasing order. In the case of a given wavelength the photon flux of the stimuli was logarithmically increasing (step ≈ 0.5 log unit). The light stimuli were 500 ms long separated with 6-s-long dark inter-stimulus periods. When wavelength was switched, 12-s-long interstimulus period was applied. The stimulus sequence was repeated typically 3 times. Photon flux of the applied stimuli ranged between 2.0 × 10¹² and 2.1 × 10¹⁶ photons cm−2 s−1. Recordings were checked and those were excluded from further analysis in which the overall appearance of the repetitions differed.
For each light stimulus the amplitude of the photoreceptor response was considered as the magnitude of the negative jump in potential in the first 150 ms of the stimulus (Fig. 2). For each wavelength the response amplitudes were plotted against log stimulus photon flux, Naka-Ruhston function18,19 was fitted on the points and the stimulus intensity needed for eliciting a critical response amplitude (20% of the maximal response amplitude measured for the given preparation) was calculated. The reciprocals of these critical stimulus intensities resulted in the spectral sensitivity curve, which was finally normalized with the value at 516 nm. In the case of male dorsal eye regions, the value at 346 nm was used for normalization. Relative spectral sensitivities were modeled by fitting the sum of two Govardovskii templates20, except for the male dorsal preparations for which a single template was fitted. All curve fittings were performed using the Levenberg–Marquardt Nonlinear Least-Squares Algorithm (minpack.lm R package)21.
Example photoreceptor responses elicited by 442 nm light stimuli of logarithmically increasing photon flux (2.1 × 10¹² photons cm−2 s−1 < I < 2.1 × 10¹⁶ photons cm−2 s−1; step ≈ 0.5 log unit). Rectangular pulses above each graph show the presence of light stimulus. Pairs of vertical dotted lines show the first 150 ms of the stimulus in which the response amplitude was determined. (A) Responses of a female larva. (B) Responses of a female adult.
Relative spectral sensitivity of dark-adapted female and male ventral eye preparations were compared wavelength-by-wavelength with Wilcoxon Rank Sum tests. As Govardovskii templates were fitted to the normalized spectral sensitivity of every single preparation, fitted sensitivity peaks of the assumed UV and green receptors were also compared with Wilcoxon Rank Sum tests for female and male ventral eyes. In the case of female eyes and male ventral eye regions, relative spectral sensitivity of the UV- and green-adapted preparations were compared with Wilcoxon Rank Sum tests. Spectral sensitivity of dark-adapted female and male larval eyes, and female dark- and green-adapted eyes were also compared wavelength-by-wavelength with Wilcoxon Rank Sum tests, as well as the relative spectral sensitivity of dark-adapted adults and larvae with pooled female and male data.
Flicker fusion frequency
Flicker fusion frequency (FFF) is the critical frequency for which the photoreceptor responses elicited by distinct flashes of light become merged into a single continuous response22. FFF of E. lateralis female eyes and both eye regions of males was measured by determining the highest frequency at which unambiguous modulation of the photoreceptor response could still be elicited by stroboscopic light stimuli. Arduino-controlled LEDs were used for creating flickering stimuli. Because spectral sensitivity measurements performed on chromatic-adapted preparations revealed no more than two distinct photoreceptor classes, FFF measurements were made at two wavelengths, 520 nm (green) and 372 nm (UV). Since male dorsal eyes were only UV–sensitive, only UV stimulation was applied to these preparations. For a given wavelength, stimuli of 25 frequencies were applied. These frequencies were logarithmically spaced between 5 and 150 Hz. Stimuli were 2 s long separated by 10-s-long dark inter-stimulus periods. First, green, then UV stimuli were applied, then the whole sequence was repeated 3 times, thus a total number of 3 stimuli were performed for a given wavelength and frequency. Mean light intensity of the UV and green flickering stimuli were 1.2 × 10¹⁵ and 2.0 × 10¹⁵ photons cm−2 s−1, respectively. During FFF recordings the filters of the amplifier were set to pass frequencies between 1 Hz and 3 kHz and the 50 Hz notch filter was switched off.
To determine the FFF for a given preparation, we performed the following steps. Before each recording, the preparation was dark-adapted for 40 min. In the case of a given wavelength, for each stimulating frequency ({f}_{stim}) the recorded photoreceptor response during the 2-s-long stimulus (Fig. 3A) was Fourier transformed, and the amplitude spectrum was further analyzed (Fig. 3B). The amplitude spectrum was adjusted by subtracting its median-filtered variant (window width = 50 Hz), which resulted in a flat baseline around zero (Fig. 3B). Next, the presence of the stimulating frequency in the recorded signal was tested by searching for a peak in the amplitude spectrum at the stimulating frequency (Fig. 3C). This was achieved by defining the noise level in the amplitude spectrum around the stimulating frequency within a 25 Hz radius. The noise level (epsilon) was the absolute value of the most negative value within the ± 25 Hz neighbourhood of ({f}_{stim}) (Fig. 3C). If the value of the amplitude spectrum at ({f}_{stim}) was greater than (2epsilon), a clear response was confirmed, thus the stimulation was considered as being sensed by the eye. Finally, for all responses, amplitude spectrum values at the corresponding stimulating frequency were plotted against ({f}_{stim}) and exponential decay function was fitted to the points for which a clear response was confirmed (Fig. 3D). In other words, the modulation amplitude in the responses caused by the stroboscopic stimuli were plotted as a function of stimulating frequency. At last, FFF was obtained by taking the frequency where the fitted exponential curve intersected the median noise level (Fig. 3D). The median noise level was obtained by calculating the median of (epsilon) values originating from the stimuli for which a clear photoreceptor response was confirmed.
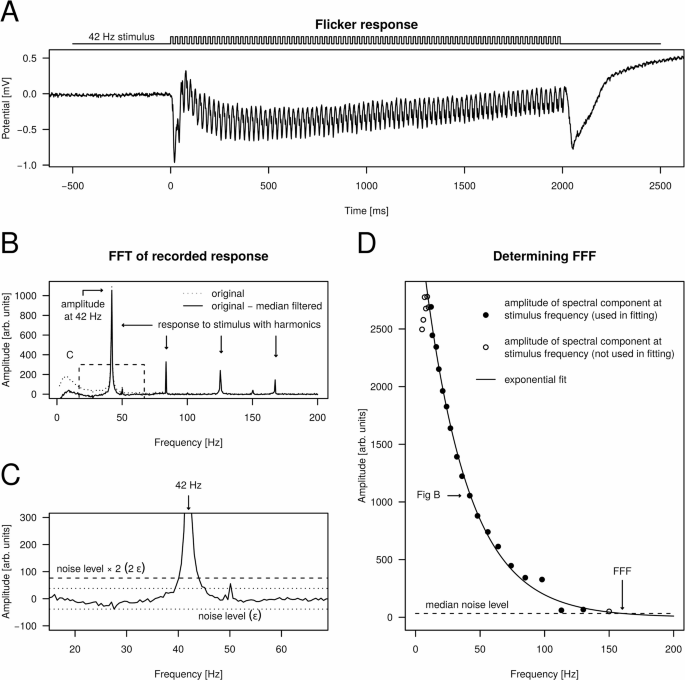
Calculation of the flicker fusion frequency. (A) Example photoreceptor response to a 42 Hz stroboscopic stimulus (λ = 372 nm) recorded from the dorsal eye region of a male E. lateralis. (B) Amplitude spectrum of the recorded response obtained by calculating the fast Fourier transform of the signal shown in A. Dotted curve: original amplitude spectrum; solid curve: median-filtered variant (window width = 50 Hz) subtracted from the original spectrum. The dashed rectangle shows the ± 25 Hz neighbourhood of the stimulating 42 Hz. (C) Enlarged view of the ± 25 Hz neighbourhood of the stimulating 42 Hz in the amplitude spectrum (dashed rectangle in B) for deciding whether the stimulating frequency elicited a clear response. (D) Amplitude spectrum values at stimulating frequencies plotted for all applied stimulus frequencies with the fitted decaying exponential. Solid points: stimulation elicited clear response (amplitude > 2ϵ); empty points: stimulation did not elicit a clear response (amplitude ≤ 2ϵ) or manual exclusion (for very low stimulating frequencies). The horizontal dashed line represents the median noise level obtained by calculating the median of noise levels for all stimulating frequencies (graphs like C) that elicited a response (solid points in D). The intersection of the exponential and the median noise level provided the FFF estimating the frequency for which the response was lost in the noise.
Since three repetitions of the stimulus sequence were performed for both tested wavelengths, three FFF values were acquired per wavelength. The final FFF value corresponding to a specific wavelength was calculated by averaging these 3 values. A total number of 6 female, 9 male ventral and 9 male dorsal eye preparations were tested.
FFF of female compound eyes obtained for the green and UV stimulation were compared with Wilcoxon Rank Sum test. We used pairwise Wilcoxon Rank Sum tests with Bonferroni’s correction to reveal FFF differences between the green- and UV–stimulated ventral eye and the UV–stimulated dorsal eye.