Data source
We used data from the Stockholm Creatinine Measurements (SCREAM) project, which contains healthcare utilization data from all residents of the region of Stockholm, Sweden [13]. A single healthcare provider in the Stockholm region provides universal and tax-funded healthcare to 20–25% of the population of Sweden. SCREAM contains complete information on demographics, healthcare utilization, laboratory tests, dispensed drugs, diagnoses (captured by International Classification of Diseases 10th Revision (ICD-10) codes from primary care, specialist care and inpatient care records) and vital status [13].
Study population
We included adults aged ≥ 18 years residing and accessing health care in Stockholm during 2016 to 2021 (last date available currently in SCREAM), with a diagnosis of HF and available subsequent hemoglobin tests. We excluded hemoglobin tests taken during an inpatient stay, or hemoglobin tests performed within 30 days after a bleeding event or a transfusion code and hemoglobin tests within 30 days from a hospitalization discharge, which could relate to the monitoring and/or resolution of an event. After these exclusions, we selected the date of the first hemoglobin test per patient as the index date for our study and the timepoint where baseline covariates were assessed, and follow-up began. At this point we further excluded patients who had conditions affecting the interpretation of hemoglobin values or of potential incident anemia-related outcomes, including recent pregnancy (within 2 years prior), ongoing or recent history of cancer (a clinical diagnosis of cancer in the previous 3 years, excluding diagnoses of melanomas), a hematologic disease, and chronic infections (e.g., hepatitis, tuberculosis, and human immunodeficiency virus) (Additional file 1: Table S1).
Once the study population had been defined, we identified and excluded individuals with anemia at the index date (i.e. prevalent anemia cases, defined by having a low hemoglobin value according to the World Health Organization (WHO) definition: < 12 g/dL for females or < 13 g/dL for males), or having received an anemia diagnosis (ICD-10 codes D50–D64) in the year prior to the index date or having received anemia treatment (erythropoietin stimulating agents (ESA) or iron) in the year prior to the index date (Additional file 1: Table S1). The resulting cohort was then a cohort of prevalent HF cases free from (recent) anemia and with a baseline hemoglobin value.
Incidence of anemia and processes of care
This study comprised two analyses. The first analysis aimed to quantify the population with HF developing anemia and the processes of care around that anemia event. The primary outcome was thus the first-detected anemia event in each patient, defined as a new onset of low hemoglobin measurement (< 12 g/dL for females or < 13 g/dL for males) followed by a diagnosis of anemia, or initiation of anemia treatment (ESA or iron) within 3 months, or a subsequent hemoglobin measurement with similar magnitude between 3 and 6 months apart (i.e., anemia sustained for at least 3 months) (Additional file 1: Table S2). The event date was the date of the first low-detected hemoglobin. Anemia events were categorized by their severity: severe anemia was defined as hemoglobin < 10 g/dL regardless of sex followed by a diagnosis of anemia, treatment initiation, or a second hemoglobin measurement < 10 g/dL; mild/moderate anemia was defined as a hemoglobin measurement < 12 g/dL for females or < 13 g/dL for males but ≥ 10 g/dL, followed by a diagnosis of anemia, treatment initiation, or a second hemoglobin measurement of similar magnitude. Outcomes based on anemia severity were not mutually exclusive, and a given patient may have developed more than one anemia event of varying severity during follow-up.
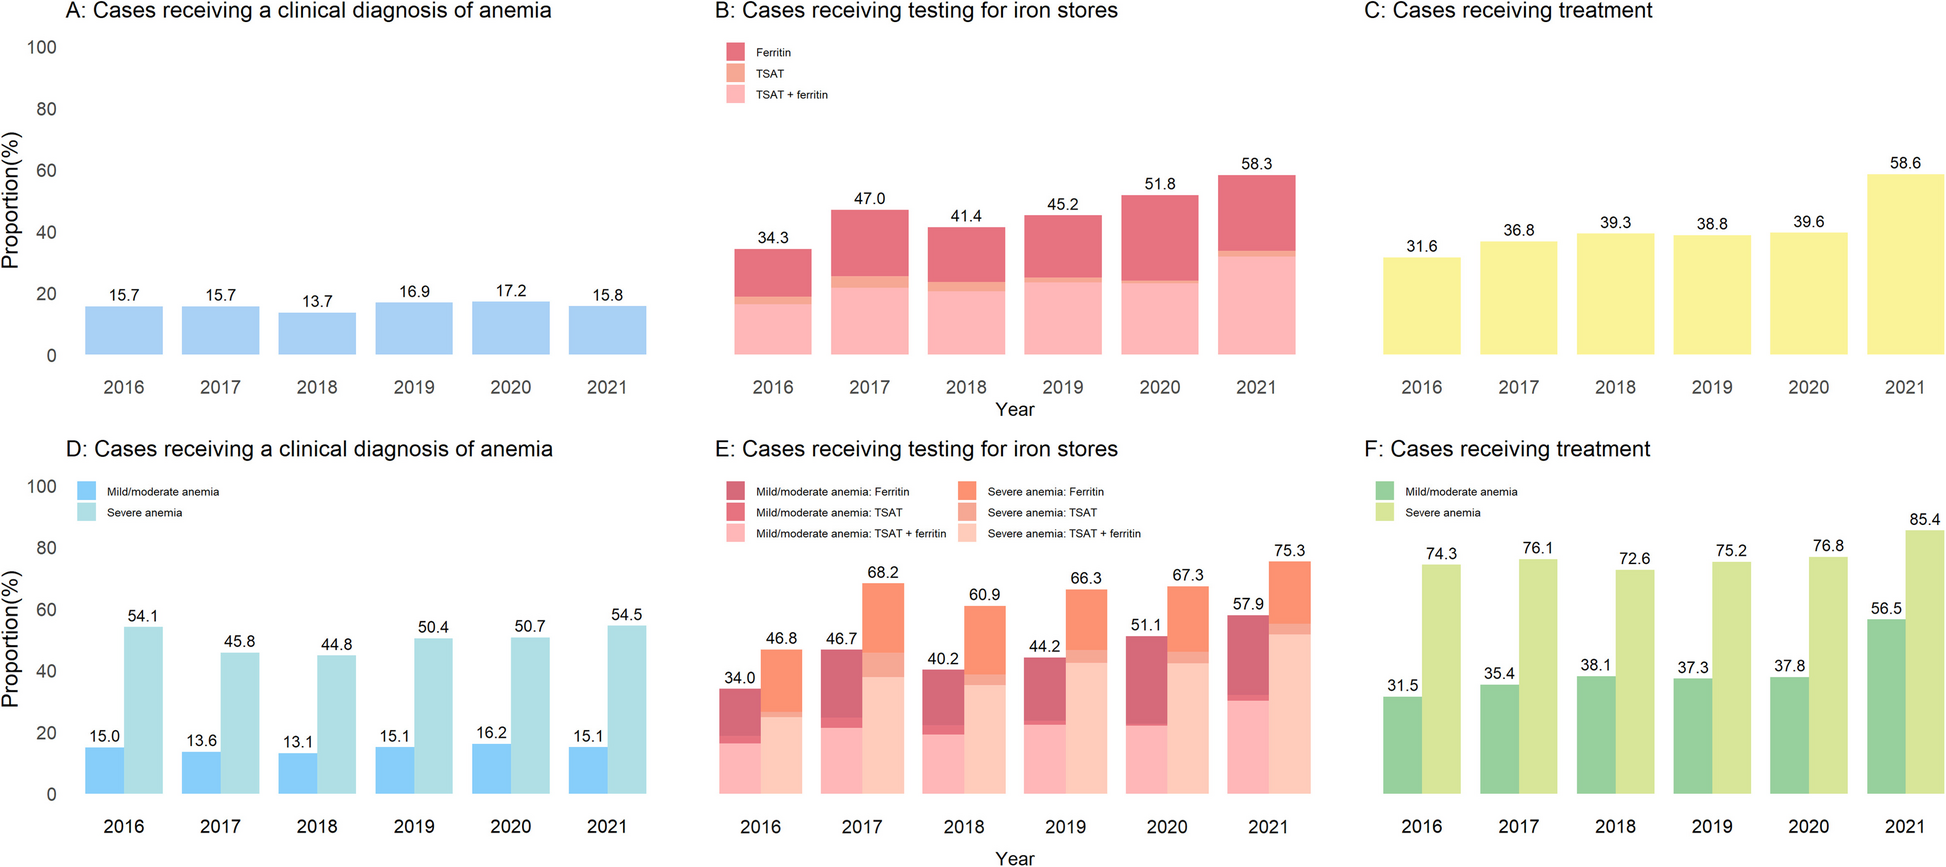
The clinical work-up of anemia was evaluated in terms of (i) anemia recognition, defined by the establishment of a clinical diagnosis of anemia within 6 months from the anemia event; (ii) testing for iron stores, defined by the presence of at least one laboratory test of ferritin or TSAT within 6 months from the anemia event; (iii) other laboratory testing, including liver enzymes (alanine aminotransferase (ALT) and aspartate aminotransferase (AST), kidney function (serum/plasma creatinine) and inflammation (C-reactive protein (CRP)); (iv) procedures for ruling out bleeding or cancer, including colonoscopy, urinalysis, cystoscopy, and esophagogastroduodenoscopy; (v) initiation of treatments, including recorded blood transfusions, infusions of intravenous iron, and filled prescriptions of oral iron or ESAs within 6 months from the anemia event (definitions detailed in Additional file 1: Table S3).
Clinical outcomes associated with incident anemia
The second analysis aimed to investigate the association between developing anemia and the subsequent risk of all-cause death, major adverse cardiovascular events (MACE) and hospitalization for HF, and new-onset cancer. Here, anemia was considered a time-varying exposure. Deaths were ascertained by linkage with the Swedish population register, which has no losses to follow up [14]. MACE was defined as the composite of stroke, myocardial infarction, and cardiovascular death. Cancer was defined as any new diagnosis falling under the International Classification of Diseases 10th Revision (ICD-10) C category (Additional file 1: Table S2).
Study covariates and stratifiers
Study covariates were derived at index date and updated again at the time of anemia occurrence. Covariates were selected on the basis of biological plausibility and included demographic information (age, sex, highest level of education attained and calendar year); HF type, categorized as HF with preserved ejection fraction (HFpEF:EF ≥ 50%) or reduced ejection fraction (HFrEF: EF < 50%) by using a prediction model derived in a Swedish cohort and validated in a Dutch cohort [15] (Additional file 1: Method S1); history of comorbidities (diabetes mellitus, hypertension, ischemic heart disease, cerebrovascular disease (CVD), peripheral vascular disease, atrial fibrillation, valve disease, chronic obstructive pulmonary disease, rheumatoid diseases, dementia, liver disease, peptic ulcer disease and melanoma); laboratory tests (hemoglobin and estimated glomerular filtration rate (eGFR) [16]; and use of implantable cardioverter defibrillator or cardiac resynchronization therapy, use of CVD-related medications (renin–angiotensin system (RAS) inhibitors (angiotensin-converting enzyme (ACE) inhibitors/angiotensin II receptor blockers (ARBs)), beta-blockers, calcium channel blockers, loop diuretics, mineralocorticoid receptor antagonists (MRA), digoxin, statins, immunosuppressants, platelet aggregation inhibitors, anticoagulants except heparin, non-steroidal anti-inflammatory drugs, and other blood pressure medications. Detailed definitions of these covariates are presented in Additional file 1: Table S4.
We stratified our analyses by the presence/absence of iron deficiency and the type of care identifying the event (setting). Iron deficiency was defined as ferritin < 100 µg/L, or ferritin between 100 µg/L and 299 µg/L if TSAT was < 20% [17]. We considered that anemia was detected and managed in primary care if the hemoglobin test that defined the event was ordered by a primary care unit and there were no records of a cardiology department visit within 6 months; we considered that anemia was detected and managed in cardiology care if the hemoglobin test that defined the event was ordered by a cardiology department or if there was a recorded visit in a cardiology department within 6 months. For cases not fitting these definitions, we considered that anemia was detected and managed in other sources of care.
Statistical analysis
Continuous variables with normal distribution are presented as mean and standard deviation (SD), whereas those with non-normal distribution are expressed as median and interquartile range (IQR). Categorical variables are presented as counts and proportions (%).
Incidence of anemia and baseline predictors
We first calculated anemia incidence rates by dividing the number of events by the person-time, following patients until the first anemia event detected. Then, we assessed time to anemia event, identifying baseline predictors (all those listed in Additional file 1: Table S5), through multivariable Cox regression models, reported as hazard ratios (HRs) and 95% confidence intervals (CIs). For these analyses, patients were followed until the occurrence of anemia, emigration from Stockholm, death, or end of follow-up, whichever occurred first. Continuous variables were standardized as per SD increase, and the relative importance of each predictor was assessed by the estimated explained variance of the outcomes (R2) and the proportion of overall explainable log-likelihood (Χ2) attributable to each predictor in the analysis of variance.
Clinical work-up of anemia
We described the clinical reactions upon anemia occurrence overall, stratified by anemia severity, by the absence/presence of iron deficiency, and by setting of management. Furthermore, we modelled these processes of care across calendar years to evaluate time trends since the instauration of the ESC guidelines in 2016. In addition, we reevaluated the clinical work-up of anemia after excluding patients who died within the first 6 to 12 months after incident anemia to account for the possibility that some of these patients may have been under palliative care, thereby limiting further diagnostic investigations and anemia treatment.
Adverse outcomes following incident anemia
Finally, we estimated the associations between developing anemia and subsequent outcomes through multivariable-adjusted time-dependent Cox proportional hazards regression. Patients were followed from the index date until the occurrence of adverse outcomes, emigration from Stockholm, or the end of follow-up, whichever occurred first.
To evaluate the consistency of our findings, we performed subgroup analyses by sex, HF type, and diabetes status. To evaluate the robustness of our findings, we performed various sensitivity analyses. First, we reanalyzed associations with all-cause death, MACE, hospitalized HF, and cancer after excluding events within the first 180 days after incident anemia to assess the impact of reverse causation bias (e.g., that anemia may have been identified during the workout and/or clinical investigations following another complication). Second, we reevaluated the associations between developing anemia and subsequent risk of MACE, hospitalized HF, and cancer, considering all-cause death as a competing risk.
Missing data approaches
There were no missing data for covariates except for educational level and baseline eGFR, with a missing rate of 3.4% and 1.9%, respectively (Additional file 1: Table S4). Multiple imputation by chained equations using classification and regression trees was employed to impute complete data sets. The imputation model included the exposure variable, all covariates, the event indicator for the outcome, and the Nelson-Aalen estimate of the baseline cumulative hazard.
Statistical analyses were performed using R Version 4.2.1 (R Foundation for Statistical Computing). Two-sided P < 0.05 was considered statistically significant.