Genome re-sequencing and comparison between two sequencing methods
We successfully extracted DNA from 258 adult female individuals collected from 25 field populations across China (Fig. 1a, Supplementary Data 1–2). Subsequently, we individually amplified the entire genome using the REPLI-g Ultrafast Mini WGA kit (QIAGEN) and performed re-sequencing of these whole-genome amplicons on the BGI MGISEQ-2000 platform. Sequencing depth ranged from 13.6 to 74.3 X, with an average depth of 42.1 X. We also integrated 64 re-sequencing reference data from Africa, Asia, Europe, and America (Supplementary Data 3), generated by pool sequencing of hundreds to thousands of female offspring from iso-female or inbred lines. The sequencing depths of these reference genomes ranged from 36.0 to 401.6 X, with an average depth of 78.4 X.
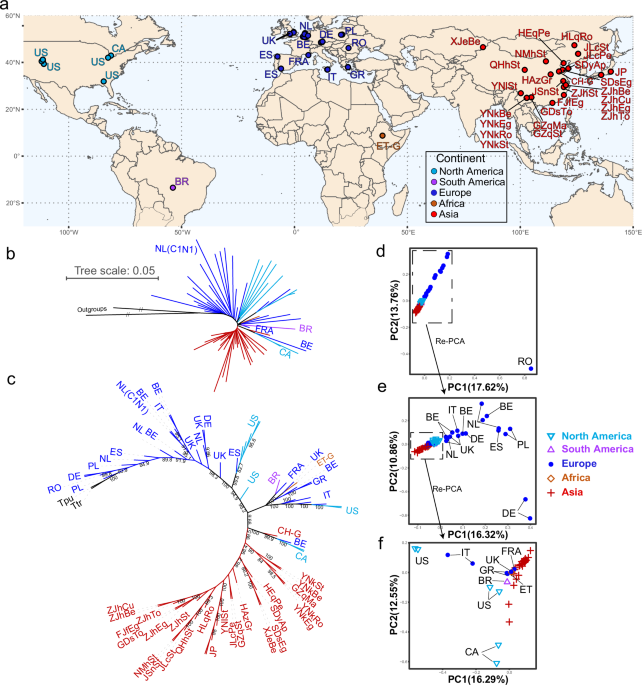
a Geographic sampling locations of T. urticae used in this study. b Rooted neighbor-joining (NJ) phylogenetic tree of 70 representative T. urticae samples based on genome-wide SNP data. Two closely related species T. truncatus and T. pueraricola were used as outgroups. c Rooted NJ consensus tree constructed using 1000 bootstrap replicates. Node labels represent bootstrap values, which indicate the confidence levels of the corresponding branches. T. truncatus and T. pueraricola were included as outgroups. d Principal component analysis (PCA) of representative T. urticae individuals (Supplementary Data 5). e, f PCA analyses of the selected individuals. The NJ tree and PCA analyses were conducted using 304,709 nuclear biallelic SNPs with a sequencing depth of more than 10 X that were present in all samples.
Unlike the reference re-sequencing data from non-Chinese populations, which were directly sequenced from DNA extracted from pooled individuals, our methodology included an additional whole-genome amplification step for the DNA of each single individual. Therefore, we compared the outcomes between the two sequencing methods. We constructed two iso-female lines for each of the two populations reared in laboratory (Supplementary Data 4). The female founders underwent DNA extraction and genome amplification immediately after the populations were established. Their offspring, which were derived from mother-son mating, were expanded for 2 months (~4 generations) to a population size of approximately 400 individuals and then pooled for DNA extraction. We found that the two sequencing methods yielded similar sequencing coverage when calculated at sequencing depths of >1 X and >4 X (Supplementary Fig. 1a, b). After initial filtering, we obtained 2,001,150 SNPs from the 8 samples. The SNP missing rates were slightly higher for the whole-genome amplification samples (mean = 5.98%) compared to the pool sequencing samples (mean = 4.08%, Supplementary Data 4). The heterozygosity rates of the single female samples were slightly higher than those of the offspring pool sequencing samples, both at SNPs with allele depth >4 X (n = 715,484) and >10 X (n = 595,080, Supplementary Data 4). The SNP similarities between each pair of samples from the two sequencing methods ranged from 97.94% to 99.17% (mean = 98.73%) and from 98.46% to 99.66% (mean = 99.26%) at SNPs with allele depth >4 X and >10 X, respectively (Supplementary Fig. 1c, d). In conclusion, the two sequencing methods yielded relatively consistent results, with only slight differences in some indices.
The genetic relationships among worldwide T. urticae
Before investigating resistance evolution, we initially characterized the global population structure of T. urticae. As the reference whole-genome re-sequencing samples mostly originate from one individual per sampling location, we avoided potential bias by initially selecting only one individual with the highest sequencing depth from each population for these global population genetic structure analyses (Supplementary Data 5). The Neighbor-Joining (NJ) tree based on the total 304,709 nuclear SNPs across 70 samples showed that the European samples occupied a basal position in the tree and exhibited high genetic divergence when rooted with T. truncatus and T. pueraricola, suggesting that T. urticae might have originated within Europe (Fig. 1b, c). The Asian samples generally formed a monophyletic lineage, occupying a terminal position in the tree with robust support, suggesting a more recent divergence from other populations (Fig. 1b, c). Samples from the American continent (Canada, USA, Brazil) and Africa (Ethiopia) were interspersed within the European lineages roughly at the transition between the Asian and European lineages in the NJ tree.
Similar results were obtained by a principal component analysis (PCA) based on the 304,709 nuclear SNPs across 70 samples. However, it showed that the Romanian sample, which was located at the basal clade in the NJ tree, was quite distinct from the others (Fig. 1d). This sample was found to possess a considerable proportion of the T. turkestani genome in a previous study, likely due to interspecific hybridization36. The other samples were clustered in a line, in which the non-European samples and six samples from Italy, Greece, France, and England were tightly clustered at the lower part of the panel (Fig. 1d, e). Although tentative, these clustering patterns further pointed to Europe as the origin of T. urticae. In addition, PCA analysis using a subset of samples clustered together revealed that the Chinese samples had a much closer relationship with the samples from Greece, France, England, and Ethiopia, suggesting these areas may be a source of the Chinese invasive populations (Fig. 1f).
We also constructed a mitochondrial SNP network by encompassing all samples (n = 322, Supplementary Data 2, 3) using 1827 SNPs (Fig. 2). In line with the nuclear findings, the mitochondrial network revealed that European lines possess highly divergent haplotypes. In contrast, Chinese samples exhibited extremely similar haplotypes, and most of which were shared by the samples close to Chinese samples on the nuclear SNPs. Within the Chinese samples, we found two low-divergence haplogroups (HGI and HGII). The two haplogroups differ by 11 SNPs, including two non-synonymous substitutions, which are located in COXIII and ND4.
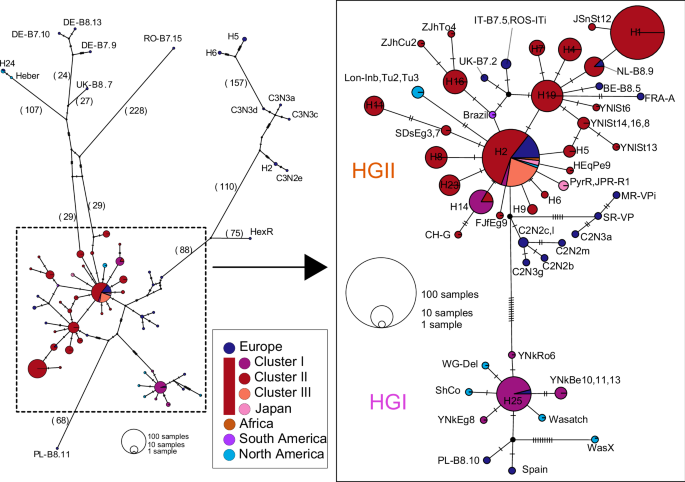
Haplotype network was constructed using 1827 mitochondrial SNPs. The pie size is proportional to the number of individuals sharing each haplotype, and the colors represent their geographic distribution. The values in parentheses and dashes between haplotypes indicate the number of mutational steps. The haplotypes of Asian individuals, along with adjacent haplotypes, were enlarged and categorized into two groups, HGI and HGII. The two haplogroups differ by 11 SNPs, including two non-synonymous substitutions, which are located in COXIII and ND4.
Compared to the European lines as a group, the Chinese individuals collectively displayed a serious decrease in the number of SNPs (Supplementary Fig. 2a, b), particularly for SNPs with low minor allele frequency (MAF) (e.g., approximately 50% decrease for SNPs with MAF < 0.2, Supplementary Fig. 2b). The level of heterozygosity in Chinese populations was lower than in European populations (P = 0.0014, Supplementary Fig. 2c). This diversity pattern indicates that the Chinese populations have experienced a strong founder effect.
The Chinese populations can be categorized into two genetic groups with gene flow
To further characterize the structure of Chinese populations, we generated a dataset comprising 258 individuals exclusively from China. This dataset consisted of 19,480 SNPs that were unlinked (r2 < 0.2) and present in all Chinese individuals. Population pairwise FST of the Chinese populations ranged from −0.009 to 0.407, with a mean of 0.167 (Supplementary Fig. 3a). A Mantel test detected a significant correlation between genetic and geographic distances (R = 0.330, P < 0.001; Supplementary Fig. 3b), indicating a role of geographical isolation in shaping population structure.
The PCA analysis clearly delineated Chinese individuals into three main groups with some association to geographic distribution (Fig. 3a). Group I was consisted of five Southwestern populations (YNkBe, YNkEg, YNkRo, YNkSt, and GZqMa) and one individual from JSnSt, which separated from others along PC1 (explaining 10.36% variance). The remaining samples were further separated into two groups (II and III) along PC2 (explaining 8.87% variance), with individuals from the XJeBe population forming Group III. To quantify the genetic differentiation between these groups, we calculated FST and Dxy (the absolute nucleotide divergence) between the three groups. The FST values between Group I and II were much lower (0.096) than the other two comparisons (Group I vs. Group III: 0.288; Group II vs. Group III: 0.222; Fig. 3a). However, Dxy values were comparable among pairwise comparisons of the three groups, ranging from 0.164 to 0.188, with slightly higher values observed between Group I and II (Fig. 3a). This discrepancy is likely attributed to within-population diversity, as FST is more sensitive to such variations than Dxy40. Reduced within-population diversity observed in the XJeBe population (Supplementary Fig. 4) likely contributed to the higher FST values between Group III and the other two groups.
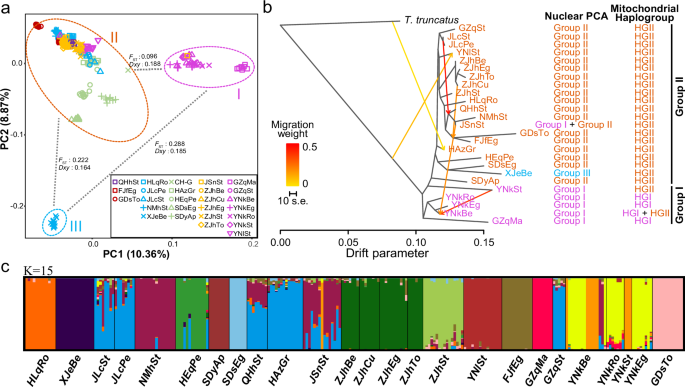
a PCA plot of all Chinese individuals (258 individuals from 25 populations in Supplementary Data 1) based on nuclear SNPs. b Relationships and gene flow events among Chinese populations inferred by the maximum-likelihood method implemented in TreeMix. The ‘Nuclear PCA’ column indicates the group, as defined in the PCA plot (Fig. 3a), to which each population was assigned. The ‘Mitochondrial haplogroup’ column indicates the mitochondrial haplogroup, as defined in the mitochondrial haplotype network (Fig. 2), found in each population. c Admixture analysis of genetic structure and individual ancestry. The optimal number of ancestral clusters chosen based on cross-validation error was 15. Each individual is represented by a vertical bar displaying membership coefficients to each of the 15 genetic clusters in (c). The above three analyses were all based on 19,480 SNPs that were unlinked (r2 < 0.2) and present in all Chinese individuals.
We explored these relationships further using TreeMix, which builds a maximum-likelihood (ML) tree from population allele frequencies. We ran TreeMix on the 25 Chinese populations with a T. truncatus population (Supplementary Data 6) used as the outgroup. The ML tree showed that the Chinese populations could be grouped into two clades (Fig. 3b). These clades generally corresponded to Group I and II observed in the PCA plot (Fig. 3a), although exceptions were noted for the YNkSt and XJeBe populations. Specifically, the YNkSt population was placed within Group I in the PCA plot but within Clade II in the ML tree. Similarly, the XJeBe population formed a distinct Group III in the PCA plot but clustered within Clade II in the ML tree. Treemix also identified gene flow from Clade I (JSnSt and YNkSt) to Clade II (YNkBe) and between populations within Clade I. In support of the existence of two genetic groups in our Chinese populations, two mitochondrial haplogroups were observed (Fig. 2). However, a portion of individuals with the nuclear background of Group II possessed mitochondrial haplotypes belonging to the Group I mitochondrial haplogroup, suggesting hybridization between the two clades may have occurred. In addition, an apparent introgression event was also detected from T. truncatus into the HAzGr population of T. urticae.
ADMIXTURE analysis partitioned genetic variation into 15 genetic groups (i.e., optimal K = 15, Supplementary Fig. 5), where samples were clustered according to their collection sites (Fig. 3c). This relatively strong population structure might reflect elevated levels of inbreeding or relatedness within populations. Admixture of genetic ancestries was also observed in certain populations: JLcSt, JLcPe, QHhSt, HAzGr, JSnSt, NMhSt, and GZqSt shared similar coefficients in inferred genetic ancestry, indicating some degree of inter-population gene flow, which aligns with those gene flow events identified by TreeMix. Notably, both ADMIXTURE and TreeMix suggested significant gene flow among four populations collected from strawberry (JLcSt, QHhSt, JSnSt, and GZqSt), despite distances of hundreds to thousands of kilometers between the sampling locations, suggesting potential anthropogenic factors such as stolon transfer influencing T. urticae dispersal in China.
Collectively, the Chinese populations exhibit moderate differentiation with substantial gene flow among them, particularly noticeable among populations collected from strawberries. It appears that Chinese populations consist of two genetic groups with similar levels of genetic diversity. These two groups exhibit marked differences in nuclear and mitochondrial variation, implying two potential invasion origins. A smaller group comprising four populations (Group I in the PCA plot) is confined to southwestern China, whereas the larger group (Groups II + III) is more widely distributed across China. The XJeBe population (constituting Group III) likely originated from a single colonization event, descending from a subpopulation within Group II.
Spread of target-site resistance mutations in Chinese and European populations
In the Chinese populations, 18 out of 30 target-site mutations were detected in 10 genes associated with pesticide resistance (Fig. 4). We adopted the common nomenclature for numbering resistant mutations in acetylcholinesterase (AChE), voltage-gated sodium channel (VGSC) and the PSST homologue of complex I (PSST), based on the sequences of Torpedo californica, Musca domestica, and Yarrowia lipolytica respectively. The corresponding numbering information in T. urticae is also accessible in Supplementary Data 7. The mutation F331W/Y/C in AChE, known to confer resistance to carbamates and organophosphates, was the most prevalent, occurring in 95.3% of the Chinese samples. This prevalence likely reflects extensive historical use of these compounds since the 1940s36,41. In contrast, the frequency of F331W/Y/C was lower in the European populations (65.6%), likely due to the more limited use of organophosphates in Europe in the last 10 years.
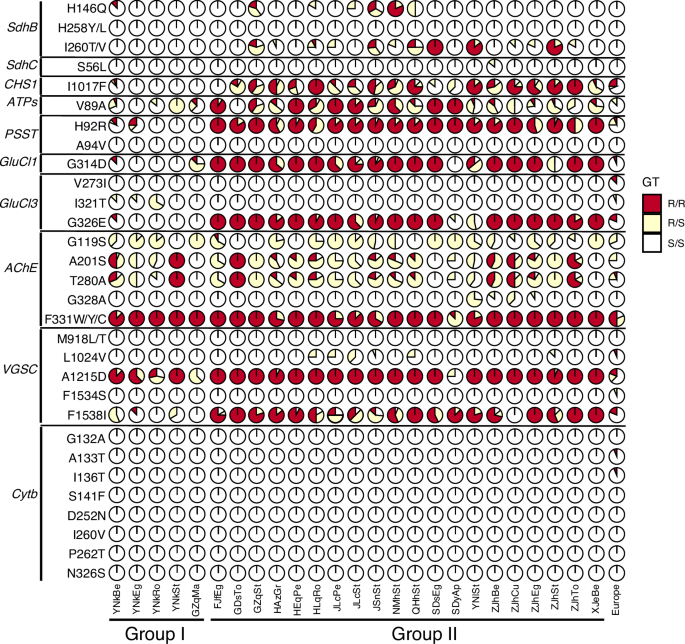
‘GT’ represents genotype, ‘R/R’ represents resistance mutation homozygote, ‘R/S’ represents resistance mutation heterozygote, S/S, susceptible homozygote. SdhB dehydrogenase B, SdhC dehydrogenase C, CHS1 chitin synthase 1, ATPs ATP synthase subunit C, PSST PSST homologue of complex I, GluCl1 glutamate-gated chloride channel subunit 1, GluCl3, glutamate-gated chloride channel subunit 3, AChE acetylcholinesterase; VGSC voltage-gated sodium channel, Cytb, mitochondrial cytochrome b. The amino acid substitutions in AChE, VGSC and PSST follow the numbering conventions of commonly used reference species, while substitutions in the other genes follow the T. urticae numbering. For the Chinese samples, 258 individuals from 25 field populations were surveyed. The two genetic groups (Group I and II) are defined according to the population genetic structure results based on nuclear and mitochondrial variation (Fig. 3). European samples included 19 T. urticae lines from 9 countries.
The second most frequent target-site resistance mutation in our Chinese collection of populations was A1215D in VGSC (92.4%), which alone does not confer resistance to pyrethroids but always appears with F1538I42. F1538I can confer high resistance and it occurs at a frequency of 69.1%. In contrast, L1024V in VGSC, which alone can cause exceptionally strong resistance to pyrethroids (bifenthrin, fenpropathrin, and fluvalinate)42 was at low frequencies (2.5%) and always in heterozygous state at the individual level. The well-established knockdown resistance (kdr) mutation L1014H was absence in our samples. In addition, the super-kdr mutation M918L/T described in insects and the spider mite T. evansi43 was also not found.
A higher frequency was also detected at H92R in PSST (78.9%), which confers resistance to the acaricides of mitochondrial complex I inhibitors (METI-I acaricides)44, and is also widely distributed in Europe45. Similarly, G314D and G326E in glutamate-gated chloride channel subunit 1 (GluCl1) and glutamate-gated chloride channel subunit 3 (GluCl3), respectively, also occurred at high frequencies (74.0% and 75.9%), which are major factors contributing to abamectin and diphenylcarbinol acaricide resistance by a synergistic manner in T. urticae46. Notably, these two mutations were also strongly linked (D’ = 0.844) in the Chinese individuals despite being over 16 Mb apart on Chromosome 2. Relatively lower frequencies were observed at H146Q (11.7%), I260T/V (21.2%) in succinate dehydrogenase B (SdhB), and at S56L (0.2%) in succinate dehydrogenase C (SdhC), which confer resistance to newly developed mitochondrial complex II inhibitors (METI-II acaricides). No resistance mutation in mitochondrial cytochrome b (Cytb) was found in the Chinese populations.
We found different resistance profiles between the two genetic groups we defined, with populations in Group I exhibiting much lower frequencies of resistance mutations compared to those in Group II (Fig. 4). Interestingly, I321T in GluC13, which contributes to abamectin resistance and mainly occurs in the red morph of T. urticae11,36,47, was only detected in Group I. This mutation was also previously detected in samples from France and Ethiopia36. This result provides additional support for the genetic divergence between the two genetic groups.
Evolutionary origins of the target-site resistance mutations in the Chinese T. urticae
To reveal the evolutionary modes of the resistance mutations, we phased the SNPs within the 8 nuclear resistance genes into haplotypes and constructed a haplotype network for each resistance allele using all available global samples (n = 322). Notably, SdhC was excluded from this analysis because only a single resistant heterozygote was detected for this gene. Haplotype networks showed that only G314D in GluCl1 and V89A in ATPs occurred on the same or near-identical haplotypes (Fig. 5a and Supplementary Fig. 6a), strongly pointing to a single origin. The H146Q in SdhB arose dominantly from a group of closely related haplotypes and also to some extent from distantly related haplotypes (Supplementary Fig. 7a), likely resulting from recombination between haplotypes. The rest of the 15 resistance mutations arose from multiple origins as they occurred on extremely distinct haplotypes (Fig. 6a and Supplementary Fig. 8a–10a). This pattern persisted when analyzing the European and invasive Chinese populations separately.
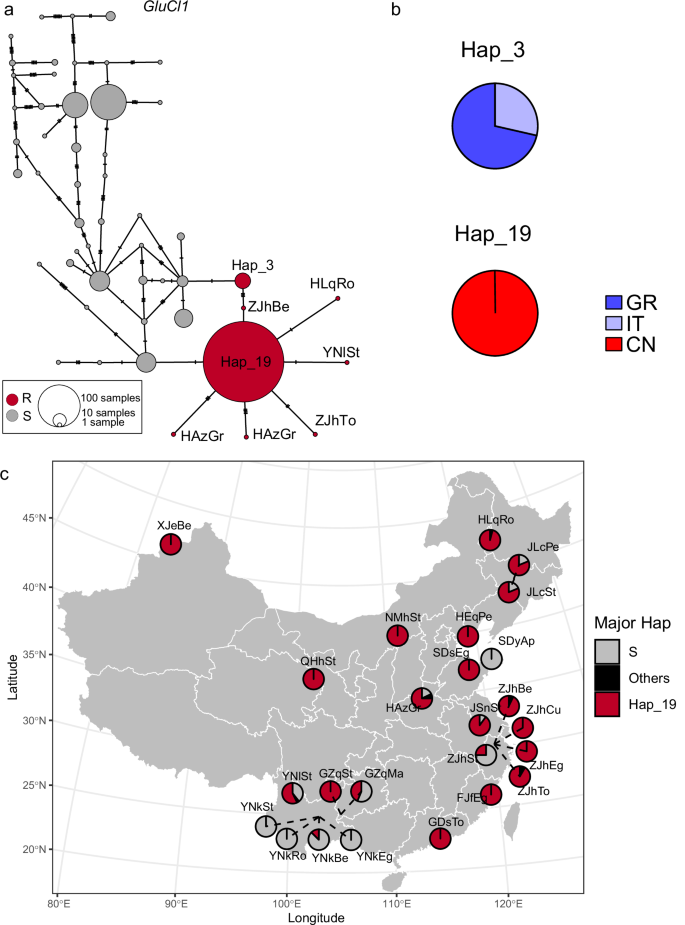
a Haplotype network for global samples (n = 322, 40 populations). Each pie represents a unique haplotype, with its size being proportional to the number of individuals sharing that haplotype. Dashes in the connections between haplotypes represent mutational steps. Red pies represent resistant haplotypes, which carry the G314D resistance mutation. Grey pies represent susceptible haplotypes, which do not carry the G314D resistance mutation. b Occurrence of major resistant haplotypes in different countries (Supplementary Data 8). Hap_3 and Hap_19 are the two major resistant haplotypes. The colors of pie chart represent the proportion of haplotypes from different countries. GR Greece, IT Italy, CN China. c Geographic distribution of major resistant haplotypes in Chinese populations (n = 258, 25 populations as listed in Supplementary Data 1). “S” represents haplotypes carrying the susceptible allele. “Others” refers to other resistant haplotypes occurring at low frequencies. “Hap_19” denotes the predominant haplotype carrying the G314D resistance mutation.
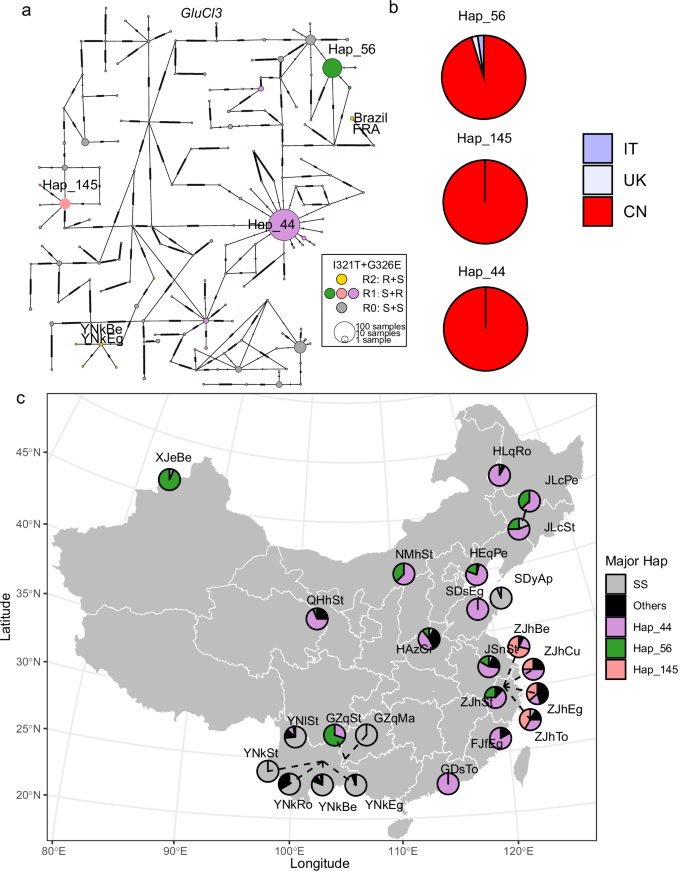
a Haplotype network for global samples (n = 322, 40 populations). Each pie represents a unique haplotype, with its size being proportional to the number of individuals sharing that haplotype. Dashes in the connections between haplotypes represent mutational steps. The colors of the pie charts represent different genetic profiles, categorized based on the alleles at the two target sites, I321T and G326E, in GluCl3. The two letters in “RS”, “SR”, and “SS” correspond to I321T and G326E, with “R” and “S” representing resistance and susceptible alleles respectively. b Occurrence of three predominant resistant haplotypes across different countries (Supplementary Data 8). Hap_44, Hap_46 and Hap_145 are three predominant haplotypes carrying the G326E resistance mutation. The colors of pie chart represent occurrence in different countries. IT Italy, UK United Kingdom, CN China. c Geographic distribution of predominant resistant haplotypes in Chinese populations (n = 258, 25 populations as listed in Supplementary Data 1). “SS” represents haplotypes carrying susceptible alleles at both target sites, and “Others” represents other resistant haplotypes occurring at low frequencies.
An interesting pattern was observed for A1215D and F1538I in VGSC. Each of the two mutations occurred on distantly related haplotypes, but their combination mainly occurred in a group of closely related haplotypes (Fig. 7a). This pattern indicates the two mutations arose independently and from multiple origins. A1215D alone does not confer resistance to pyrethroids42 but F1538I can48,49. The two mutations simultaneously occurred on multiple distantly related haplotypes but were most frequent in a group of closely related haplotypes (Hap_36 related, Fig. 7a, c), which were widely shared by different populations in China. The occurrence of major resistance haplotypes is listed in Supplementary Data 8.
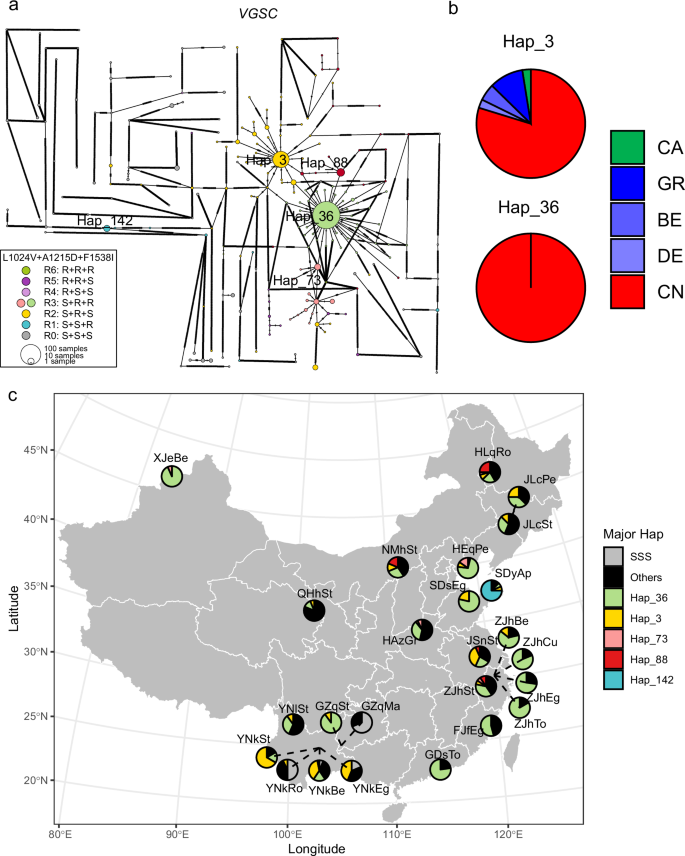
a Haplotype network for global samples (n = 322, 40 populations). Each pie chart represents a unique haplotype, with its size being proportional to the number of individuals sharing that haplotype. Dashes in the connections between haplotypes represent mutational steps. The colors of the pie charts represent different genetic profiles, categorized based on the alleles at the three target sites, L1024V, A1215D, and F1538I. The three letters in “RRR”, “RRS”, and “RSS” etc. correspond to L1024V, A1215D, and F1538I, with “R” and “S” representing resistance and susceptible alleles, respectively. b Occurrence of two major resistant haplotypes across different countries (Supplementary Data 8). Hap_3 and Hap_36 are two major haplotypes carrying target-site resistance mutations. CA Canada, GR Greece, BE Belgium, DE Germany, CN China. c Geographic distribution of predominant resistant haplotypes in Chinese populations (n = 258, 25 populations as listed in Supplementary Data 1). “SSS” represents haplotypes carrying susceptible alleles at the three target sites, and “Others” represents other resistant haplotypes occurring at low frequencies.
To validate the haplotype network results, we conducted PCA analyses using SNPs within the target-site genes but excluding the target-site resistance mutation sites. Our reasoning was that if a resistance mutation originated from a single source and spread through gene flow, then the resistant homozygotes would cluster together in the PCA plots based on SNPs within the target-site gene regardless of the field population from which they were collected. In support of the haplotype network results, the PCA analyses also revealed that only the homozygotes for the mutations G314D in GluCl1, V89A in ATPs, and H146Q in SdhB were closely clustered together (Supplementary Fig. 11a, c and e). In addition, the homozygotes of the A1215D + F1538I combination in VGSC occurred at a high frequency and largely formed a single main cluster, though some were spread apart (Supplementary Fig. 11h).
Widespread gene flow among T. urticae populations promotes the spread of resistance
Certain resistant haplotypes of GluCl1, GluCl3, VGSC, ATPs, PSST, and CHS1 were shared by individuals from different countries (Figs. 5b−7b, Supplementary Figs. 6b, 8b and 9b), reflecting a global spread of resistance mutations by gene flow. Of note, the Chinese populations shared resistant haplotypes with the European populations in GluCl3, VGSC, ATPs, PSST, and CHS1, suggesting invasions of these resistance alleles. Geographic distributions of the major resistant haplotypes in the Chinese populations showed strong resistance gene flow among populations, regardless of whether the mutations arose from a single or multiple independent origins (Figs. 5c−7c, Supplementary Figs. 6c−9c). We noticed that a major haplotype carrying H146Q in SdhB (Hap_26) was largely associated with the populations collected from strawberries (JLcSt, QHhSt, JSnSt, NMhSt, and GZqSt, Supplementary Fig. 7c). This agreed with the strong gene flow among strawberry populations as inferred using genome-wide SNPs, further pointing to a potential anthropogenic factor in spreading of resistance mutations.
Selection pressure on the Chinese populations of T. urticae
To explore whether T. urticae has undergone adaptive evolution after its invasion into China, we employed the Composite Likelihood Ratio (CLR) statistic for genome-wide selection analysis50. The CLR test compares the likelihood of observed genetic data under a model of selection to that under a neutral model, effectively identifying genomic regions that have undergone positive selection. This method is particularly useful for detecting selective sweeps, where advantageous alleles rapidly increase in frequency, leaving distinct signatures in the genome. We used the field-collected Chinese samples (n = 258) for the selection analyses.
We considered genomic regions with the top 1‰ CLR values to be under significant selective sweeps. Above this threshold, 9 peaks (P1-P9) were identified (Fig. 8, Supplementary Data 9–17). The most prominent peak (P5) was located at 25.00−25.79 Mb on chromosome 2, containing 196 genes, of which 11 are gustatory receptor genes (Fig. 8b, Supplementary Data 13). Recent studies have found that chemosensory protein receptor genes can be associated with resistance and host plant acceptance and exploitation24,51,52. This raised the possibility that selection pressures could be associated with pesticide use. To test this possibility, we superimposed the 9 nuclear resistance-related genes onto the CLR results. We found two selection signal peaks (P6 and P9) strongly associated with VGSC and GluCl1 (Fig. 8), in which resistance mutations or haplotypes were inferred to be single origin and with high frequencies. The regions near the two genes showed reduced nucleotide diversity and notably low negative Tajima’s D values, indicative of hard sweeps. To validate that the detected selection signals are indeed associated with resistance, we separately selected homozygous resistant and susceptible individuals, based on the G314D mutation in GluCl1. We performed CLR analyses and calculated nucleotide diversity (PI) across the genome for each group. The results showed that the signal near GluCl1 was completely absent in the susceptible individuals, while it became stronger in the resistant individuals (Supplementary Fig. 12). This further supports the association between the observed signals and resistance. Additionally, we found significantly lower PI values in the resistant individuals compared to the susceptible ones in the GluCl1 region (Supplementary Fig. 12), which further supports the single origin of the G314D mutation.
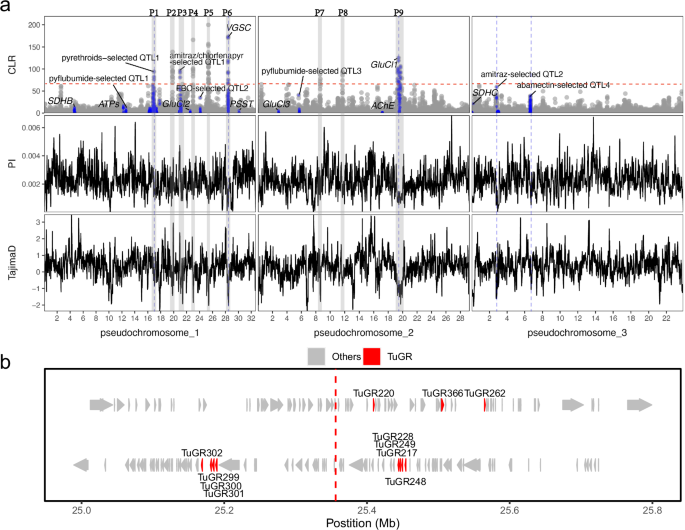
a panels display CLR values, nucleotide diversity (PI), and Tajima’s D values across the 3 chromosomes of T. urticae individuals from China (n = 258, 25 populations listed in Supplementary Data 1). Blue points in the CLR panel denote regions that overlap with known pesticide resistance-related genes or QTLs. Tajima’s D, and nucleotide diversity (PI) were estimated across the entire genome using a sliding window approach, with a window size of 50 kb and a step size of 5 kb. Blue dashed lines mark the peaks of CLR signals, where adjacent regions show significantly reduced nucleotide diversity and Tajima’s D values. The dashed red line shows the threshold of significant CLR values (1‰ CLR values). b Genes within the most prominent peak (P5). Vertical dotted lines represent the midpoint of the top genomic window. TuGR: gustatory chemosensory receptor.
We also projected 9 quantitative trait locus (QTL), which were previously demonstrated to be associated with resistance by BSA analyses, onto the CLR result (Supplementary Data 18, Fig. 8). We found that P1 and P3 coincided with a pyrethroid (bifenthrin)-resistance QTL and a shared QTL associated with amitraz and chlorfenapyr resistance, respectively. The pyrethroid (bifenthrin)-resistance QTL located on Chromosome 1 has a broad range (16.1–17.4 Mb) and spans a region of more than 250 genes, including 3 Glutathione S-transferases and 4 ABC transporters previously reported to be involved in the detoxification process39. The shared QTL associated with amitraz and chlorfenapyr resistance was located at 20.85–21.08 Mb on Chromosome 1, which involves 13 cytochrome P450 genes of the CYP392A family, a carboxyl/cholinesterase (CCE20, tetur03g00310), a short-chain reductase (tetur03g00300), and a cluster of four nuclear hormone receptors53. In addition, a second amitraz-resistance QTL and an abamectin-resistance QTL also exhibited signals of selective sweep. The second amitraz-resistance QTL was located at ∼3.008 Mb on Chromosome 3, in which multiple genes coding for cytochrome P450 enzymes of the CYP392A family were present, with CYP392A10v2 (tetur02g14400) being the most centrally located in the peak53. The abamectin-resistance QTL was located at ~6.6 Mb on Chromosome 3, which involved two genes encoding degenerin/Epithelial Na + channels (ENaCs), 19 genes encoding chemosensory receptors, and a gene encoding an inositol monophosphatase-like enzyme (tetur02g06900)54.
In the remaining selective peaks, detoxification, excretion and chemoreception-related genes were also found, including carboxyl/cholinesterase (at P2, P8; Supplementary Data 10, 16), cytochrome P450 (at P2; Supplementary Data 10), ABC-transporter (at P2; Supplementary Data 10), solute carriers (at P4; Supplementary Data 12), major facilitator superfamily (at P2; Supplementary Data 10), intradiol ring-cleavage dioxygenase (at P8; Supplementary Data 16), gustatory receptor (at P7, P8; Supplementary Data 15, 16). Notably, these genes are not clearly associated with pesticide use.