DLGEPID
vs DLGion
As shown in Table 1, the DLG values measured by EPID (DLGEPID) were generally lower than those measured by the ionization chamber (DLGion). At the isocenter, DLGEPID was 0.95 mm, which is 0.27 mm lower than DLGion. At positions ±3 cm∥ and ±5 cm∥, DLGEPID consistently measured around 0.95 mm, while DLGion was approximately 1.30 mm and 1.40 mm, respectively. For the perpendicular positions at ±3 cm⊥ and ±5 cm⊥, DLGion values were 1.08 mm, 1.20 mm, and 1.21 mm for both, whereas the DLGEPID values were 0.65 mm, 0.58 mm and 0.71 mm, 0.61 mm.
DLGion values at the −3 cm⊥ and –5 cm⊥ remained consistent, with a maximum difference of 0.62 mm at the –3 cm⊥ position and a minimum difference of 0.27 mm at the isocenter. As the distance from the detection point to isocenter increased, the difference also increased. DLGEPID at the isocenter and at ±3 cm∥, ±5 cm∥remained nearly constant, while DLGion values varied. The points at ±3 cm∥ and ±5 cm∥ were consistently higher than at the isocenter. Notably, both DLGEPID and DLGion values at these perpendicular detection points were lower than those in the parallel orientation, except at the +3 cm⊥ position.
Sliding window MLC gap plan
The original plan and the 2D DLG-based adjusted plan for the sliding window MLC gap plan were measured using the EPID device. A comparison between the measured results and the TPS calculated dose was made. Table 2 shows the GPR results with absolute dose criteria of 3%/2 mm and 2%/2 mm, a dose threshold of 10%. For the criterion of 3%/2 mm, the fields with small gaps (2 mm, 4 mm, 6 mm, 10 mm), GPR of Planadj improved by 12.2%, 17.6%, 25.4%, and 58.2%, respectively, compared to Planorg; the larger dynamic gap fields (14 mm, 16 mm, 20 mm), the GPR improvements were even more substantial, with increases of 83.6%, 84.3% and 82%, respectively. As to the criterion of 2%/2 mm, GPR improvements were consistently smaller than those with the criterion of 3%/2 mm across all gap fields, though the same improvement trend was maintained. For the fields with small gap (2 mm, 4 mm, 6 mm, 10 mm), GPR improvements were 8.5%, 11.6%, 17.6%, 33.2% respectively. In contrast, larger fields (14 mm, 16 mm, 20 mm) showed larger improvements of 59.5%, 70.3%, 78.9%.
As the gap increased from 2 to 10 mm, the GPR improvement accordingly increased for both criterion of 3%/2 mm and 2%/2 mm. Beyond a gap of 10 mm, the GPR improvement stabilized with minimal fluctuations for 3%/2 mm and stay increased for 2%/2 mm. (a) For the criterion of 3%/2 mm, both the GPRs for the planorg and planadj were notably low for small gap fields, indicating a significant difference between the measured and predicted planar dose. In contrast, for large gap fields, GPR for the planorg remained low, whereas the planadj showed a significant improvement, with values exceeding 90%. (b) For the criterion of 2%/2 mm, the GPRs of the original plans remained the same as those of 3%/2 mm for fields with gap ranges of 2 mm to 10 mm. However, the GPRs of the adjusted plans were lower for all gap fields. Notably, the GPR improvement values of 2%/2 mm continued to increase across all fields, including the larger gap fields, which differs from the trend observed under 3%/2 mm criterion. As a result, the 2D DLG correction had a substantial impact on GPR for the constant gap dynamic MLC plan.
Patient plan
The DLGTuner exhibited excellent performance in the plan adjustment process. The time of generating the adjusted plan was within 10 to 15 seconds, which depends on the complexity of original plans. Ten consecutive generating processes were performed without any instability for DLGTuner, with complete consistency observed across all generated plans. Besides, DLGTuner demonstrated strong effectiveness in clinic practice. The original plan exported from TPS was modified using DLGTuner, and the resulting plan could be delivered directly on the LINAC after specific patient quality assurance. Therefore, these results confirm the DLGTuner’s reliability and suggest strong potential for clinical implementation.
Both planorg and planadj were measured with EPID. Measured results were compared with the calculated dose of TPS. Absolute dose criteria of 3%/2 mm and 2%/2 mm, global dose normalization, and a dose threshold of 10% were used to calculate the GPR.
Figures. 4 and 5 were the comparisons of distribution and profile between the delivered fluence measured by EPID and patient plans calculated by TPS for both planorg and planadj. The two figures display a multiple target patient with 14 targets and 5.4cc volumes that passed 3%/2 mm criteria at 67.1% for planorg and 99% for planadj. As shown in the figures, the measured dose was higher than the calculated dose for both planorg and planadj in both X and Y directions, especially in the tumor region. For both planorg and planadj, measured dose was aligned with calculated in the low dose region. Compared with the planorg, the dose differences between the measured and calculated were decreased, and the alignment was increased, especially in the Y direction for the planadj. For both planorg and planadj, in the Y direction, the dose fluctuated due to the MLC inter and intra dose variation. Fig. 6a displays the 3%/2 mm GPR for all clinical multi-target VMAT plan fields in relation to the level of modulation, indicated by the MCS. The figure shows that GPR improvements were consistently positive, with GPR for the planadj higher than that for planorg across all cases. The most significant improvements in GPR occurred in highly modulated plans (with low MCS score), with the largest improvement exceeding 35% and the smallest around 5%. This suggests that the 2D DLG correction enhances deliverability and accuracy, especially for highly modulated plans, resulting in better alignment between calculated and delivered doses.
The comparison between the measured and calculated dose for Planorg. (a) dose distribution calculated by TPS. (b) dose distribution measured by EPID. (c) dose profile comparison between measured and calculated in X direction. (d) dose profile comparison between measured and calculated in Y direction.
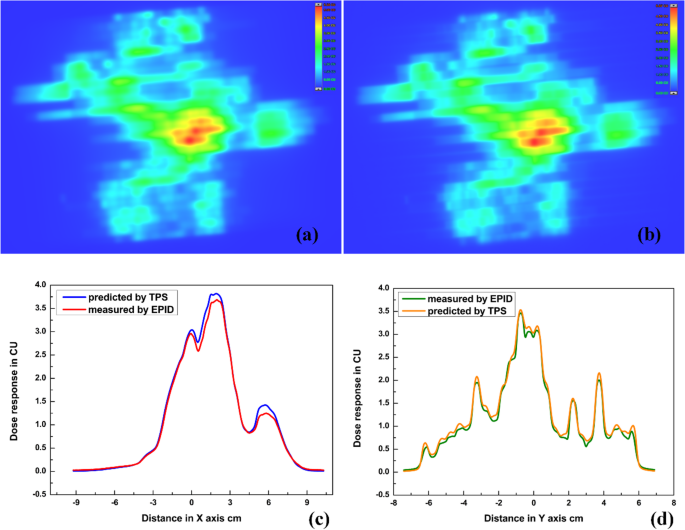
The comparison between the measured and calculated dose for Plannew. (a) dose distribution calculated by TPS. (b) dose distribution measured by EPID. (c) dose profile comparison between measured and calculated in X direction. (d) dose profile comparison between measured and calculated in Y direction.
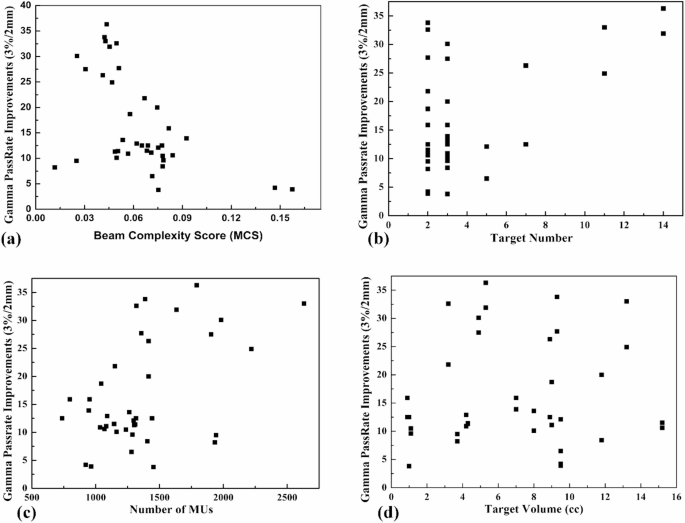
The relationship between the GPR improvements and (a) MCS, (b) target number, (c) number of MUs and (d) target volumes for the multiple targets brain metastasis.
Fig. 6b illustrates the relationship between GPR improvement and the number of targets. It is evident that when the target number increases, the GPR improvement becomes more pronounced. For cases with 2 or 4 targets, GPR improvements varied significantly, likely due to additional influencing factors, which is discussed in the following section.
The number of MUs shows a slight correlation with GPR improvement. Plans with a higher number of MUs were prone to show greater GPR improvement (Fig. 6c). However, no significant relationship was observed between GPR improvement and target volume (Fig. 6d).
As shown in Table 3, the mean GPRs of the original plans were 82.8% and 78.7% for multiple targets, 97.2% and 96.5% for single target under the 3%/2 mm and 2%/2 mm criterion, respectively. After applying the 2D DLG correction, the GPR for both multiple and single targets improved to nearly 100% under the 3%/2 mm criterion. However, under the stricter 2%/2 mm criterion, the GPRs were slightly lower for both multiple and single targets. The average GPR improvements for single target plans were 2.59% and 3.07% (standard deviation: 4.29% and 3.21%), while for multi-target plans, the average GPR improvements were 16.52% and 19.77% (standard deviation: 9.37% and 9.71%), under the 3%/2 mm and 2%/2 mm criteria, respectively. Notably, the GPR improvements under the 2%/2 mm criterion were greater than that under the 3%/2 mm criterion for both single and multiple targets, suggesting that the 2D DLG correction is more impactful under stricter evaluation criterion. Furthermore, the GPR improvements for multi-target plans were significantly larger than that for single-target plans for both 3%/2 mm and 2%/2 mm, indicating that the 2D DLG correction has a more substantial impact on dose delivery for patients with multiple targets compared to those with a single target.