We present here a comprehensive single-embryo transcriptomic and metabolomic dataset that offers an unprecedented, single-embryo, continuous, dynamic view of the transcriptional and metabolic processes underlying early Drosophila embryogenesis. Generated using a simple workflow (Fig. 1a), the dataset covers development up to cellular blastoderm (0–3 h).
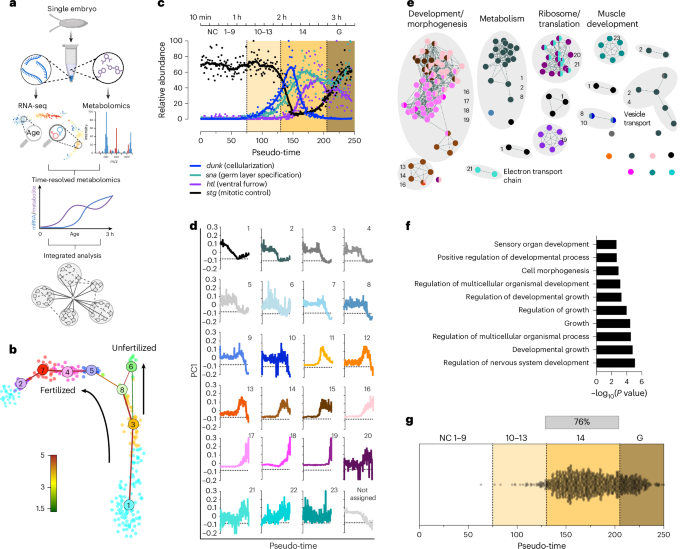
a, Schematic representation of the method: single eggs are collected, and metabolites and RNA are isolated from the same sample45. Metabolites are used for metabolomics, and RNA is processed for sequencing using a modified CEL-Seq2 protocol. RNA-seq data are analysed to determine embryo age and sex (see Methods for details). b, t-distributed stochastic neighbour embedding (t-SNE) map visualization of RNA-seq of embryos (10 min to 3 h) and unfertilized eggs. k-medoids clusters are indicated by different colours, and the intercluster links are indicated by straight lines; the colour indicates the significance of the link, from red as the strongest to green as the weakest. c, Normalized gene expression of dunk (disrupted underground network), sna (snail), htl (heartless) and stg (string) plotted along our pseudo-time order. Estimated time and NC or onset of gastrulation (G) are indicated at the top. d, First principal component (PC1) or eigengene of each module generated by WGCNA plotted along our pseudo-time order. Graphs represent the gene expression profile of all transcripts in a given module. e, Network map of overrepresented pathways in modules; pathways are linked according to gene-set overlap. Overrepresentation analysis using g:Profiler (significance threshold g:SCS = 0.1) was used as input into Cytoscape for network visualization. f, Ten most enriched pathways by adjusted P value, using g:Profiler (Fisher’s exact test with significance threshold, g:SCS = 0.1) of zygotically expressed genes. g, Activation pseudo-time for each of the zygotically expressed genes. The grey bar indicates NC 14, during which 76% of all genes start expression.
Source data
Determining embryo age using a high-resolution transcriptome dataset
The single-embryo transcriptome dataset presented herein establishes the expression patterns for 7,367 different transcripts (minimum number of five unique reads in at least five individual embryos) in 245 single embryos and 22 unfertilized eggs (>150,000 unique transcripts per embryo, average of 760,000 reads per embryo). This results in a resolution of ~1.4 embryos per minute (twice that of our previous study12). Figure 1b shows a t-distributed stochastic neighbour embedding map with the inferred differentiation trajectory for embryos and unfertilized eggs. Ordering individual embryos along the transcriptomic pseudo-time trajectory is consistent with expectations from manually staged embryos (Extended Data Fig. 1a), indicating that transcription and trajectory inference is a suitable proxy for manual staging. Of note, our analysis did not reveal any obvious batch effects (Extended Data Fig. 1b). Differentiation trajectories derived from single-cell transcriptomics often reflect a loss of transcriptional entropy as cells commit to specific fates13, and we observe a similar decrease in entropy across our single-embryo dataset (Extended Data Fig. 1c), providing independent validation of the pseudo-temporal ordering.
Analysing raw read counts along the pseudo-time trajectory showed a change in the number of transcripts over time, with older embryos containing fewer transcripts than younger embryos (Extended Data Fig. 1d). To account for this difference in transcript levels, we used the remove unwanted variation using control genes (RUVg) tool and normalized transcript data for downstream analysis (see Methods for details).
Unlike manual staging based on discrete morphological categories, the pseudo-time framework captures gradual (and nearly continuous) transcriptional changes across individual embryos. This enables us to identify developmental sub-stages that are otherwise morphologically indistinct. We used the expression of known marker genes14,15, such as dunk (cellularization), sna (germ layer specification), htl (ventral furrow formation) and stg (mitotic control), to anchor our pseudo-time trajectory according to developmental stage. Using this approach, we place nuclear cycle (NC) 1–9 from pseudo-time 0–75; NC 10–13 spans pseudo-time 76–130; NC 14 extends from pseudo-time 130–205; and the transition to the blastoderm phase occurs after pseudo-time 205 (Fig. 1c). We are also able to identify male and female embryos after ZGA using their transcriptome (Extended Data Fig. 1e,f and Supplementary Table 1) and determine sex-specific differences in gene expression (Supplementary Table 2).
Continuous transcriptome analysis reveals dedicated expression modules for metabolic pathways
Understanding how metabolism and gene regulation are coordinated is critical to understanding how the embryo transitions from maternal control to zygotic autonomy. We therefore used weighted gene co-expression network analysis (WGCNA)16,17 to reveal the temporal coordination of metabolic and developmental pathways during early embryogenesis. After merging modules with high topological overlap, we identified 23 modules with more than 20 genes that had distinct temporal patterns (Fig. 1d and Extended Data Fig. 1g,h). Approximately 58% of all detected transcripts were assigned to modules 1–10, which all share an overall pattern of maternal deposition followed by gradual degradation but differ in the timing and dynamics of transcript decay as resolved by WGCNA. Only 23% of detected transcripts are assigned to modules dominated by zygotic transcription. These data may also explain why older embryos had fewer transcripts than younger embryos. The remaining transcripts (n = 1,418 out of 7,367) were not assigned to any WGCNA module (Supplementary Table 3).
Using the identified modules as input, we performed overrepresentation analysis of Gene Ontology, KEGG and Wikipathway terms using g:Profiler (significance threshold, g:SCS = 0.1)18,19,20,21,22. Modules 4, 5, 6, 7, 9, 11 and 12 showed no significant pathway enrichment. We used the Cytoscape compound spring embedder layout function to create a network map for the remaining modules, with nodes coloured according to the module in which they are enriched (Fig. 1e and Extended Data Fig. 1i). This network of co-expressed genes and associated pathways provides a framework for the field to explore how distinct gene groups contribute to specific biological processes during early embryogenesis. To better interpret the structure of the pathway enrichment network, we used AutoAnnotate (v.1.3.3)23 to cluster tightly connected nodes based on their similarity. This analysis reveals several sub-networks that are dominated by specific modules. A completely annotated network and a list of pathway enrichments can be found in Extended Data Fig. 1i and Supplementary Table 4. A subset is discussed here and displayed in Fig. 1e. For example, we found a large web of development or morphogenesis-related pathway terms dominated by modules 16, 17, 18 and 19 that display patterns of zygotic gene expression. The remaining sub-networks show enrichments in pathways that are not classically associated with early development. This includes a sub-network related to metabolism dominated by modules that exhibit distinct patterns of maternal degradation (modules 1, 2 and 8). Interestingly, module 2, which is enriched for lipid metabolic pathways, also shows enrichment for vesicle transport, suggesting a potential transcriptional link between lipid metabolism and vesicle-mediated nutrient sorting during early embryogenesis, as recently proposed24. By contrast, genes associated with the electron transport chain (module 21) display a highly variable pattern dominated by zygotic expression. This suggests that transcriptional control of energy metabolism is uncoupled from that of biosynthetic pathways. A similar pattern is observed for genes related to ribosome biogenesis and translation (modules 21 and 22). These findings suggest that the transcriptional regulation of metabolism is modular and temporally distinct from that of developmental gene networks, indicating independent control of biosynthesis, energy production and cell fate specification.
Revealing the onset of transcription using allele-specific analysis
Although the transcriptional modules in Fig. 1d reflect patterns of transcript abundance, maternal mRNA decay in early embryos can hide the true onset of gene transcription. To more accurately assess the timing of zygotic transcriptional activation for individual genes, we performed allele-specific expression analysis using two genetically distinct Drosophila Genetic Reference Panel (DGRP) lines (males, DGRP_352; females, DGRP_737) with known single-nucleotide polymorphisms (SNPs)25,26. Variant calling was carried out using a modified GATK RNA sequencing (RNA-seq) workflow, retaining only known, biallelic SNPs that map unambiguously to a single gene25. We detected a total of 2,358 genes with SNPs in our dataset. We excluded all transcripts with paternal reads present in unfertilized eggs (≥2 in any unfertilized egg, n = 395) from downstream analysis, which are probably a result of mapping artefacts, given that unfertilized eggs should only contain maternal transcripts and none from the paternal allele.
It is only when the zygote assumes control over its genome that transcripts from both parental alleles become detectable. Using a conservative threshold (≥3 paternal reads in ≥10 embryos), we identified 1,459 genes that are expressed from the paternal allele at one point during the 3 h developmental window. This is consistent with prior estimates that a sizeable fraction of genes remain inactive early in development27. Overrepresentation analysis showed that the zygotically expressed genes are enriched in pathways related to growth and development (Fig. 1f). Additionally, we compared our zygotically transcribed genes identified by our SNPs analysis to previously published datasets3,4,5,28. This analysis uncovered 170 genes that have not been previously reported to be part of the major ZGA (Supplementary Table 5).
To determine the transcriptional onset of individual genes, we tracked the first appearance of paternal allelic reads using SNPs across the pseudo-time trajectory. Given that pseudo-time ordering is based on global transcriptome similarity rather than morphology, our approach minimizes staging ambiguity and reduces the risk of contamination by older transcripts, which is a known issue in allele-specific studies relying on pooled samples28,29. We applied generalized additive models (GAMs) to infer, with 95% confidence, the earliest pseudo-time point at which mean read counts from the paternal allele reached one. This analysis revealed that 1,105 of 1,459 zygotically transcribed genes initiate expression during NC 14, within an approximately 50 min window of development (pseudo-time 130–204; Fig. 1g and Supplementary Table 5). Based on their temporal ordering, genes fell into three distinct waves of activation (Extended Data Fig. 1j): the first and second waves correspond to the canonical minor and major phases of the ZGA, while the third wave (occurring immediately after NC 14) is a previously unrecognized transcriptional programme that includes 398 genes distinct from those in the earlier ZGA phases and reflects the transition into cellular blastoderm and tissue-specific gene expression.
In summary, although consistent with previous studies3,4,5,28, our analysis refines the timing of genome activation, identifies early transcribed genes and reveals a third, temporally discrete wave of zygotic transcription. This provides a substantial advancement over the traditional two-phase model of ZGA and offers a framework for understanding the temporal regulation of early embryonic development.
Single-embryo metabolomics reveals time-resolved metabolite profiles
Having established the transcriptomic framework, we next turned to the metabolite component of our single-embryo study (outlined in Fig. 1a) to explore how metabolite abundance changes during early development. Here, we present the application of targeted single-embryo metabolomics, demonstrating its utility for developmental time-course analysis. Given that individual Drosophila embryos are small, metabolite abundances in samples are low and difficult to measure reproducibly. To address this problem, we first performed a dilution series liquid chromatography–mass spectrometry (LC–MS) experiment on metabolite extracts corresponding to the equivalent of ten, five and one embryo and selected a panel of 155 well-resolved polar metabolites for our targeted metabolomics approach. We focused on polar metabolites because of their central roles in energy production, biosynthetic pathways and redox regulation, which are pathways especially relevant to early development. The use of this limited, well-characterized panel enabled higher dwell time per compound, improving detection sensitivity in low-input, single-embryo samples.
We next performed targeted metabolomics on metabolite extracts from the same single embryos used for transcriptome pseudo-time analysis (245 single embryos and 22 unfertilized eggs; Fig. 1b). An overview of the LC–MS data processing workflow is shown in Fig. 2a. We reproducibly detected a stable signal for 81 metabolites (statTarget30 coefficient of variation, 20; see Methods) (Extended Data Fig. 2a and Supplementary Tables 6 and 7). Figure 2b–e shows the results for asparagine as an example. Ion chromatograms for two transitions (131.04 → 112.9, 131.04 → 69.9) for asparagine from representative embryos at distinct pseudo-times and a solvent blank injection demonstrate clear above-background signals (Fig. 2b). Following initial data processing, samples were arranged along the transcriptome-derived pseudo-time trajectory to reveal changes in metabolite abundance across early development. Figure 2c shows this analysis for asparagine, which increases steadily along the trajectory, a trend not driven by batch effects (Extended Data Fig. 2b). To remove residual noise caused by analytical and technical variation, we applied GAMs for smoothing and outlier detection, using a 99.7% prediction interval31 (Fig. 2d). Given the complex and often nonlinear nature of metabolite trajectories, GAMs provided a flexible, data-driven framework for capturing developmental dynamics, including inflection points and phase transitions. Outliers were excluded and GAMs re-run to define the final metabolite-specific trajectories (Fig. 2e). We thus derive continuous, high-resolution profiles of metabolite abundance during the first 3 h of embryogenesis. GAMs have previously been applied to transcriptomic data; however, their use for dynamic modelling of single-embryo LC–MS metabolomics represents, to our knowledge, a novel analytical application with potential future relevance for other low-input or single-cell metabolomics workflows.
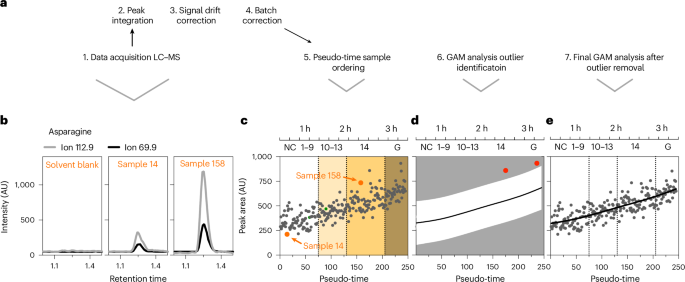
a, Method overview. b, Ion chromatograms for two transitions (131.04→112.9, 131.04→69.9) of asparagine for a solvent blank, sample 14 and sample 158. c, Asparagine abundance (in arbitrary units (AU)) plotted along the RNA-seq pseudo-time order. Arrows indicate samples 14 and 158 plotted in b, with low or high relative asparagine abundance, respectively. Estimated time and NC or onset of gastrulation are indicated at the top. d, A GAM using the pseudo-time-aligned metabolite data identifies outliers (red data points) based on 99.7% prediction intervals (white area). e, After outlier removal, the GAM is applied again to determine the predicted values for each metabolite (black line).
Source data
In summary, our multi-omics approach reveals dynamic metabolite behaviours, providing a powerful proof of concept for temporally resolved metabolomics in single organisms. This framework sets the stage for future applications in single-cell systems in which transcriptome-guided trajectories could compensate for low input and reproducibility.
Revealing developmental changes in metabolite abundance
Our results show a gradual, pseudo-time-dependent increase in asparagine abundance across early development (Fig. 2e). To improve clarity of visual data representation, we present scaled (relative) abundance values in Fig. 3a and all subsequent metabolite graphs (also included in Supplementary Table 8). To further validate the metabolite trajectories, we analysed pooled embryo samples with higher metabolite concentrations. Importantly, pooling was guided by each embryo’s transcriptome-derived pseudo-time, rather than by morphology or time since egg laying (as is common practice), allowing us to retain precise developmental alignment. We did not observe sex-specific differences for metabolites (Extended Data Fig. 3a), so we did not stratify pools by sex. We then performed LC–MS on pools of ten embryos to boost signal intensity and minimize technical variability. The pooled samples showed trends in asparagine abundance consistent with those from single embryos (Fig. 3b), demonstrating the robustness of our approach. To test whether the observed changes in metabolite abundance are statistically significant, we selected three equally sized and spaced time windows (shaded areas in Fig. 3a,b), each containing four consecutive pooled samples. This analysis confirmed a significant increase in asparagine abundance across all three intervals (Fig. 3c). Remarkably, a similar trend was also observed in unfertilized eggs (Supplementary Fig. 3b), suggesting that this metabolic trajectory is not triggered by fertilization but rather reflects a maternally programmed process. This represents direct evidence that metabolic remodelling, like transcript degradation, can occur independently of fertilization, thus expanding our understanding of early developmental metabolism.
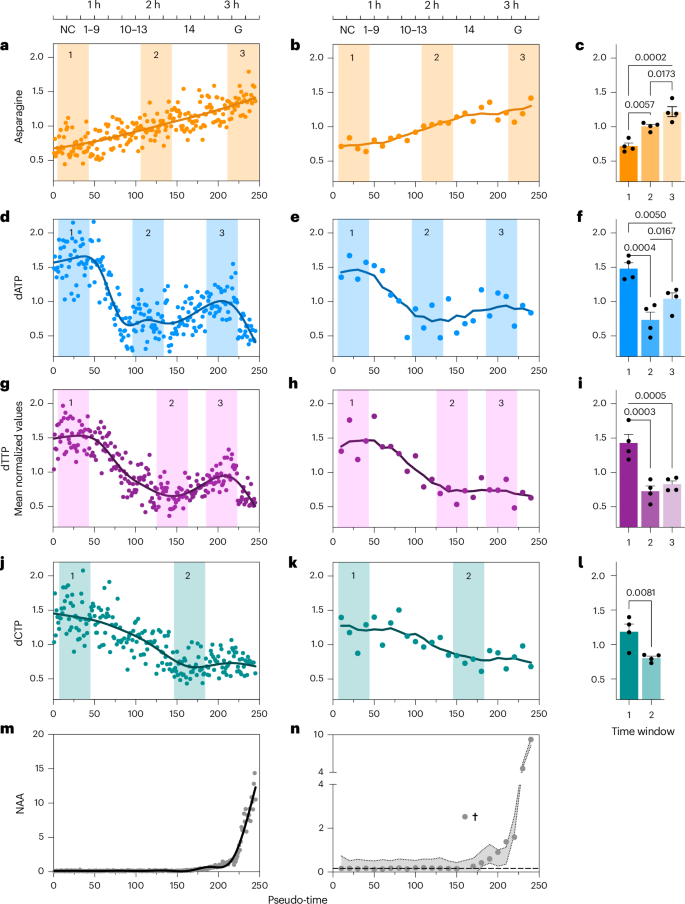
a,d,g,j,m, Metabolite relative abundance from single embryos plotted along the pseudo-time order. b,e,h,k,n, Metabolite relative abundance from pooled embryos (n = 10 per sample) plotted along the pseudo-time order. The location of minima and maxima in the pseudo-time order is indicated by numbered coloured areas. Estimated time and NC or onset of gastrulation are indicated at the top. c,f,i,l, Selected pooled samples for comparison (n = 10 embryos per sample, four samples per group) based on abundance minima and maxima of the single-embryo pseudo-time order. Data are means; error bars, s.e.m. Group means were compared by ordinary one-way ANOVA in c, f and i and by one-tailed unpaired t-test in l. Shaded areas in n indicate 95% confidence intervals determined by GAM; † marks a point excluded from analysis as it lay outside the GAM’s 95% confidence interval. The dashed line at 0.1642 represents the average baseline abundance calculated from the first 15 pseudo-time-ordered embryos and serves as the threshold for reliable detection of NAA. dCTP, deoxycytidine triphosphate.
Source data
We also analysed nucleotide metabolism, the only metabolic pathways previously investigated in detail during early Drosophila development, primarily focusing on deoxynucleotide triphosphates (dNTPs) and their role in rapid genome replication32,33. These prior studies, based on pooled embryos collected in 1 h-long windows or staged by morphology, reported a gradual decline in dNTP levels but lacked the resolution needed to capture metabolic dynamics during the exceptionally rapid early cell cycles of Drosophila development, in which divisions occur every 8 min before progressively slowing to 18 min by NC 13 (ref. 34). These fast early divisions impose extreme demands on nucleotide supply, yet their metabolic dynamics remained poorly resolved. Using our high-resolution single-embryo metabolomics framework, we revisited dNTP dynamics to both validate our approach against prior observations and uncover new insights into the regulation of nucleotide metabolism during early embryogenesis.
Plotting single-embryo metabolomic data against transcription pseudo-time showed high initial levels of free deoxyadenosine triphosphate (dATP) and deoxythymidine triphosphate (dTTP), which dropped sharply around pseudo-time 50 (NC 8; Fig. 3d–i). This drop corresponds with the period of fastest mitotic divisions and maximal nucleotide demand and supports the idea that early genome replication is sustained almost entirely by maternally supplied nucleotides. dATP and dTTP levels stabilized and increased during cellularization (pseudo-time ~200), when the cell cycles pause for ~30 min34, which is consistent with reduced replication demand and de novo (zygotic) dNTP synthesis. After NC 14 (when mitosis resumes), dATP and dTTP levels again decreased. Deoxycytidine triphosphate showed a similar but more gradual pattern (Fig. 3j–l). All dNTP signals were validated with chemical standards (Supplementary Fig. 1a), and patterns were preserved in pseudo-time-pooled samples, with statistically significant differences observed between peak and trough time windows (Fig. 3e,h,k). Deoxyguanosine triphosphate was not detected, probably because of low endogenous levels and poor ionization efficiency. Interestingly, although major transcriptional activity is underway starting in NC 14, ribonucleotide triphosphate levels remain relatively stable (Extended Data Fig. 3c–j), suggesting that ribonucleotide triphosphate biosynthesis is buffered or maintained separately from dNTP demand. Together, these findings demonstrate that dNTP dynamics are precisely timed to the embryo’s cell cycle progression and metabolic state, showing discrete shifts aligned with known developmental landmarks rather than a gradual depletion as suggested by current models and literature. This refines the classic view of nucleotide metabolism during early development and provides a high-resolution framework to connect metabolic state with genome activation and cell cycle control.
Another example of unexpected biology relates to N-acetyl-l-aspartate (NAA), shown in Fig. 3m,n. NAA is predominantly found in mature neurons and is widely used as a clinical biomarker for neuronal integrity in vertebrates35. In mammals, NAA is synthesized in neuronal mitochondria, where it supports myelination, osmoregulation and acetate delivery to glial cells35,36. Although there is some evidence that Drosophila produces NAA10,11,37,38, its biosynthesis and function in insects remain unclear, and its detection has been controversial owing to the presumed absence of the necessary enzymatic pathways. Using our high-resolution single-embryo metabolomics approach, however, we not only confirmed the presence of NAA in Drosophila embryos but also uncovered a biphasic pattern of de novo NAA synthesis (Fig. 3m; validation standard in Supplementary Fig. 1b). NAA levels initially rise during NC 13 (around pseudo-time 175), followed by a sharp increase during NC 14. This pattern was consistent across single-embryo and pseudo-time pooled samples (Fig. 3n). Notably, the onset of NAA accumulation precedes neuroectoderm specification, which begins only after NC 14 (refs. 39,40). The early onset of NAA biosynthesis reveals that aspects of neuronal metabolic programming may be initiated well before terminal differentiation. This observation is important, given that NAA is generally considered a hallmark of post-mitotic neurons.
Collectively, these examples demonstrate the power of the single-embryo transcriptomic and metabolomic framework to resolve biologically meaningful changes in metabolite abundance across early embryogenesis and provide a blueprint for future investigations into metabolite function and timing in low-input systems.
Early embryonic metabolite–transcript correlations highlight selective metabolic regulation
Next, we tested whether metabolites correlate with each other or with gene expression patterns (as defined by the WGCNA co-expression modules in Fig. 1d) using Pearson correlations. This approach takes the dynamic nature of our dataset into account and provides high-confidence, agnostic associations, revealing a detailed view of the interconnectedness of metabolic processes during early development. In total, we identified 220 correlations (false discovery rate of <0.05 and Pearson R2 > 0.25), which included most transcriptional modules (22 out of 23) but less than half of the metabolites (37 out of 81) (Extended Data Fig. 4a–c). Notably, only a limited subset of metabolites (14 out of 37) correlated with transcriptional modules (Extended Data Fig. 4a), while the remaining correlated only with other metabolites (Extended Data Fig. 4c). Given the small number of metabolite–transcript correlations (n = 68) compared to transcript–transcript correlations (n = 114), we reason that these few metabolites—including several amino acids, nucleotide-related metabolites, NAA and GlcNAc-1-P—are central to embryonic development. For dNTPs, analysis revealed positive correlations (red connecting lines) between dNTPs and modules 1 and 2, and negative correlations (blue connecting lines) with deoxyinosine, asparagine and module 11 (Fig. 4a). Overrepresentation analysis for modules 1 and 2 showed DNA replication and glycerolipid and phospholipid metabolic processes as the top enriched pathways consistent with dNTP demands during rapid nuclear divisions and concurrent membrane remodelling (Fig. 4b,c). Collectively, these data suggest that specific amino acids, nucleotide metabolites, NAA and GlcNAc-1-P are particularly important for early embryonic development and demonstrate why transcript abundance is not a reliable proxy for metabolite abundance.
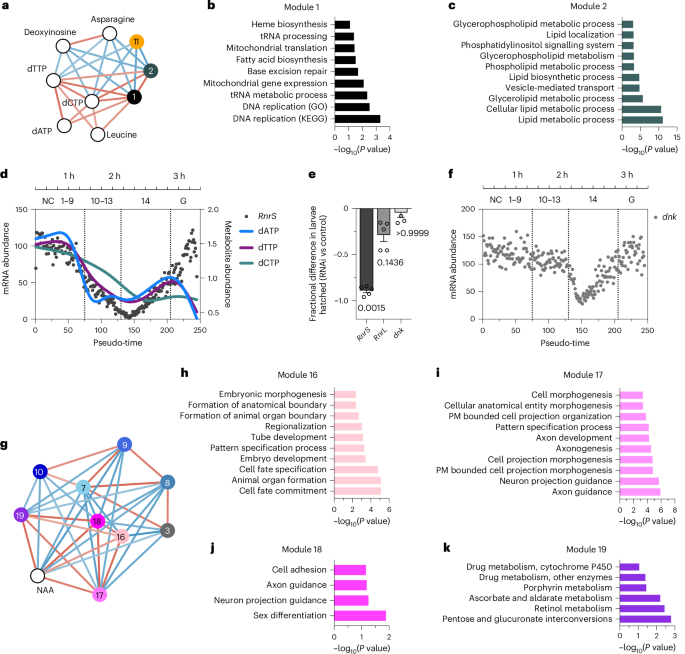
a, Network map of dNTPs and neighbour metabolites (white circles) and WCGNA transcript modules (coloured circles) using network visualization with Cytoscape. Red or blue connecting lines indicate positive or negative correlations, respectively (FDR < 0.05 and Pearson R2 > 0.25). b,c, Overrepresentation analysis for transcript in module 1 (b) and module 2 (c) using g:Profiler (Fisher’s exact test with significance threshold g:SCS = 0.1). d, Normalized gene expression of ribonucleoside diphosphate reductase small subunit (RnrS) and metabolite relative abundance of dNTPs plotted along our pseudo-time order. Estimated time and NC or onset of gastrulation are indicated at the top. e, Fractional difference (relative to control) in larvae hatched from embryos (n = 80 embryos per sample, five samples per group) after oocyte-specific depletion of RnrS, RnrL or dnk by RNAi. Data are means; error bars, s.e.m. Group medians were compared to the control using a Kruskal–Wallis test, followed by Dunn’s post hoc test for multiple comparisons. f, Normalized gene expression of dnk plotted along our pseudo-time order. g, Network map of NAA and its neighbours using network visualization with Cytoscape. Red or blue connecting lines indicate positive or negative correlations, respectively (FDR < 0.05 and Pearson R2 > 0.25). h–k, Overrepresentation analysis for transcript in modules 16 (h), 17 (i), 18 (j) and 19 (k) using g:Profiler (significance threshold, g:SCS = 0.1). PM, plasma membrane; FDR, false discovery rate.
Source data
The biosynthesis of dNTPs is tightly regulated during development, primarily through the activity of ribonucleotide reductase (RNR), the rate-limiting enzyme that catalyses the conversion of ribonucleotides to deoxynucleotides. Previous studies have shown that RNR activity is essential in early Drosophila embryos, despite maternal deposition of dNTPs, and that chemical inhibition of RNR impairs development32,33. However, the dynamics and transcriptional regulation of RNR subunits during embryogenesis are not well characterized. The RNR small and large subunits (RnrS and RnrL) are members of WGCNA modules 1 and 2, respectively, and these modules are positively correlated with dNTP levels (Fig. 4a and Supplementary Table 3). Using the single-embryo trajectory reveals that the initial drop in dNTP abundance coincides with the degradation of the maternally deposited RnrS and RnrL transcript, and it reaches its minimum at the onset of cellularization (NC 13, pseudo-time 150; Fig. 4d and Extended Data Fig. 4d). Shortly thereafter, RnrS and RnrL are expressed zygotically, coinciding with an increase in dATP and dTTP abundance. These high-resolution data suggest that zygotic dNTP production is regulated by RNR transcript abundance in addition to allosteric control by dNTPs41 (previously reviewed in a development context42).
To test whether early development requires RnrS and RnrL, we used oocyte-specific transcript depletion43. We found that depletion of maternally deposited RnrL transcripts resulted in decreased larval hatching rate, and depleting RnrS completely arrested development. Therefore, early embryogenesis requires maternally deposited RnrS and RnrL transcripts (Fig. 4e). The single-embryo transcriptomic data also reveal that deoxyribonucleoside kinase (dnk) transcript, the rate-limiting enzyme for dNTP salvage, follows a temporal pattern similar to RrnS, albeit shifted to later time points (Fig. 4f). However, oocyte-specific depletion of dnk had no measurable effect on embryo survival (Fig. 4e), validating previously indirect assessments of the salvage pathway during early development33. Thus, the transcriptional regulation of RNR subunits has a substantial role in fine-tuning nucleotide supply during the onset of ZGA.
Interestingly, NAA was significantly correlated with WGCNA transcript modules 16–19 (Fig. 4g). These modules are enriched for pathways associated with neuronal development as well as pentose and glucuronate interconversions (Fig. 4h–k). This correlation suggests that the early accumulation of NAA may be functionally linked to the transcriptional priming of neuronal differentiation. Collectively, these data support the hypothesis that the correlation network nodes reflect metabolite–gene relationships that are central to early embryonic development.