Unlock the Editor’s Digest for free
Roula Khalaf, Editor of the FT, selects her favourite stories in this weekly newsletter.
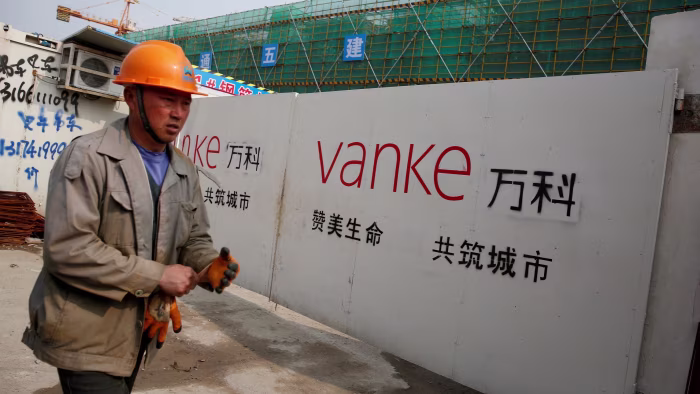
China Vanke shares and bonds plunged on Thursday after it became the first state-backed property developer to request a delay on a bond payment, reigniting fears around the Chinese real estate sector’s financial health.
Vanke, whose majority shareholder is Shenzhen Metro, disclosed late on Wednesday it had asked holders of a Rmb2bn ($280mn) onshore bond for a delay in a payment of principal due next month.
The exchange filing sent its Shenzhen-listed shares down 7.1 per cent on Thursday to Rmb5.47, their lowest level in nearly two decades. An onshore renminbi bond maturing in 2027 with Rmb1.1bn outstanding dropped to 40 cents on the dollar on Wednesday, having traded at 86 cents at the start of the week.
Vanke’s attempt to extend the payment deadline intensified market concerns that even developers with strong government ties could no longer count on unlimited official support.
China has endured a years-long property slowdown that began with the default of Evergrande in 2021. A sector-wide cash crunch soon engulfed other developers including Country Garden and Vanke.
Vanke received support in February, when Shenzhen Metro extended a Rmb2.8bn loan that had grown to Rmb33.8bn by the end of September. The state-owned shareholder also parachuted its own chair, Xin Jie, as Vanke’s chair.
The steps helped international bonds recover from distressed levels of below 40 cents on the dollar, but the respite was short lived. Its shares are down nearly 90 per cent from their peak in early 2018, wiping out more than Rmb380bn in market capitalisation.
Two dollar bonds — $7.1bn of notes due 2027 and $2.1bn due 2029 — trade at deeply distressed levels, with the 2027 issue quoted around 34.8 cents, down more than 50 per cent since the end of October.
“Vanke’s situation today is significantly worse than at the start of the year,” said Pei Wu, founder of Shanghai-based Credit Castle Research. “With sales still in freefall, who will still be confident to bear the additional cost of continued support?”
Vanke reported a Rmb28.2bn net loss in the first nine months of 2025, with sales plunging 43 per cent year on year to Rmb114.6bn.
Shenzhen Metro booked a Rmb12bn investment loss in 2024 and a further Rmb7.3bn loss in the first three-quarters of 2025, explicitly citing its stake in Vanke. In October, Xin abruptly resigned from the Vanke chair position, citing “personal reasons”.
“The sell-off in Vanke bonds highlights at least two uncertainties: a deteriorating fundamental outlook and an evolving policy stance on bailouts,” Pei said. “Any rescue involves a constant rebalancing of costs against benefits.”
Vanke and Shenzhen Metro did not immediately respond to requests for comment.
Additional contributions by Cheng Leng in Beijing