The development of these purpose-built police specials involved police officers themselves, who worked together with engineers in Mladá Boleslav and drew on extensive experience from the first-generation Kodiaq police fleet. Power now comes from the sporty RS variant and consists of a 2.0 TSI turbocharged petrol engine delivering 195 kW, all-wheel drive, and a DSG automatic transmission. The car is also equipped with specially tuned DCC+ adaptive dampers.
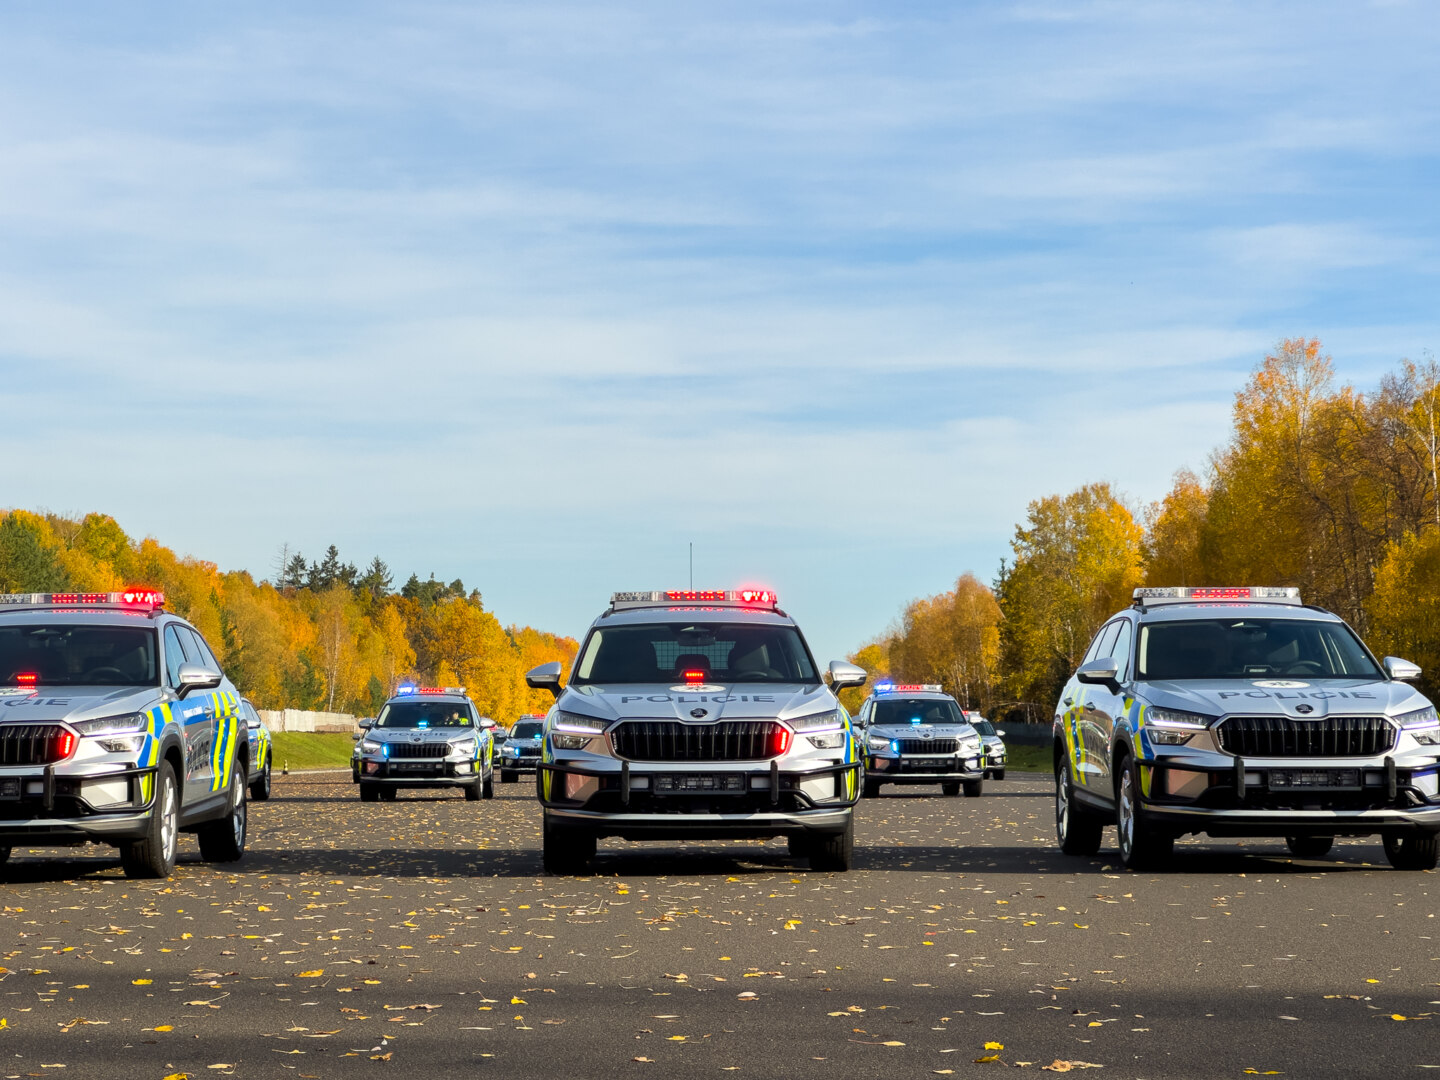
The Škoda Kodiaq will serve both patrol and traffic police units. A new feature is the introduction of 18-inch alloy wheels, replacing the original steel rims with plastic covers. These allow for better cooling of the upgraded more robust braking system, which comes from the seven-seat version of the SUV. Another interesting upgrade is the ability to quickly switch the drivetrain and chassis into sport mode, giving the driver immediate access to full vehicle performance.