Open field test (OFT)
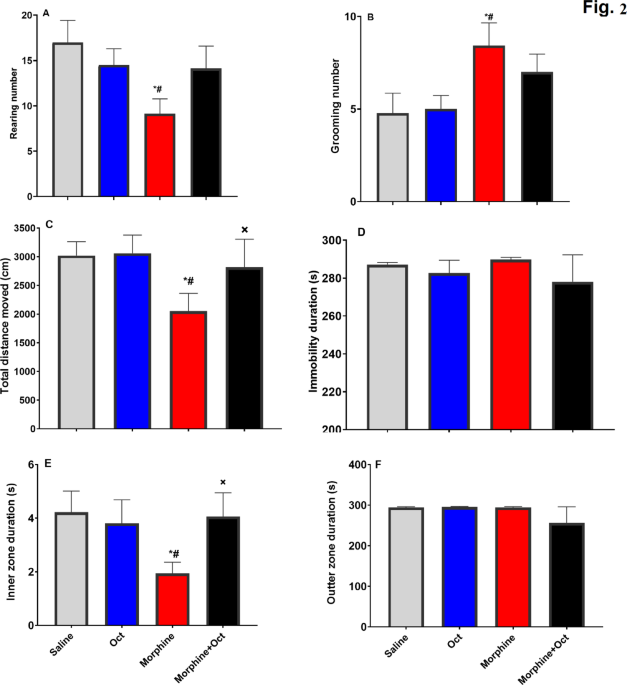
In the OFT, the morphine group exhibited a significantly lower number of rearing events compared to the saline and OCT-treated groups (F (3, 28) = 6.24, p = 0.01, Fig. 1A). Moreover, the morphine group exhibited significantly higher grooming events compared to other groups (F (3, 28) = 2.85, p = 0.048, Fig. 1B). These findings suggest that OCT administration in morphine-treated rats resulted in normalizing the number of rearing and grooming events to a level comparable to control groups. Evaluation of the total distance moved within the open field apparatus demonstrated that the morphine group traveled a significantly lower distance when compared to that seen in the other groups. However, the morphine + OCT group moved a distance that did not differ from that exhibited by both saline and OCT groups (F (3, 28) = 3.14, p = 0.05, Fig. 1C), suggesting that OCT administration in morphine-treated animals enhanced exploratory activity. Furthermore, our findings showed a significantly lower time spent in the inner zone in the morphine group, while the morphine + OCT group did not show any difference with the control groups (F (3, 28) = 3.26, p = 0.041, Fig. 1E). There were no significant differences in immobility duration (F (3, 28) = 0.46, p = 0.7, Fig. 1D) and time spent in the outer zone (F (3, 28) = 1.08, p = 0.37, Fig. 1F) between the groups.
Characterization of exploratory activity in the open-field test. (A) rearing number, (B) number of grooming events, (C) total distance moved, (D) duration of immobility, and (E) the time spent in inner and (F) time spent in outer zones of the test arena. Data are expressed as the mean ± SEM. (* in comparison to the Saline group, # in comparison to the OCT group, × in comparison to the Morphine group.
Elevated plus maze
Findings of the elevated plus maze test did not show any significant differences between the groups in the time spent in the open arm (F (3, 28) = 1.06, p = 0.38, Fig. 2A) and closed arm (F (3, 28) = 0.025, p = 0.99, Fig. 2B).
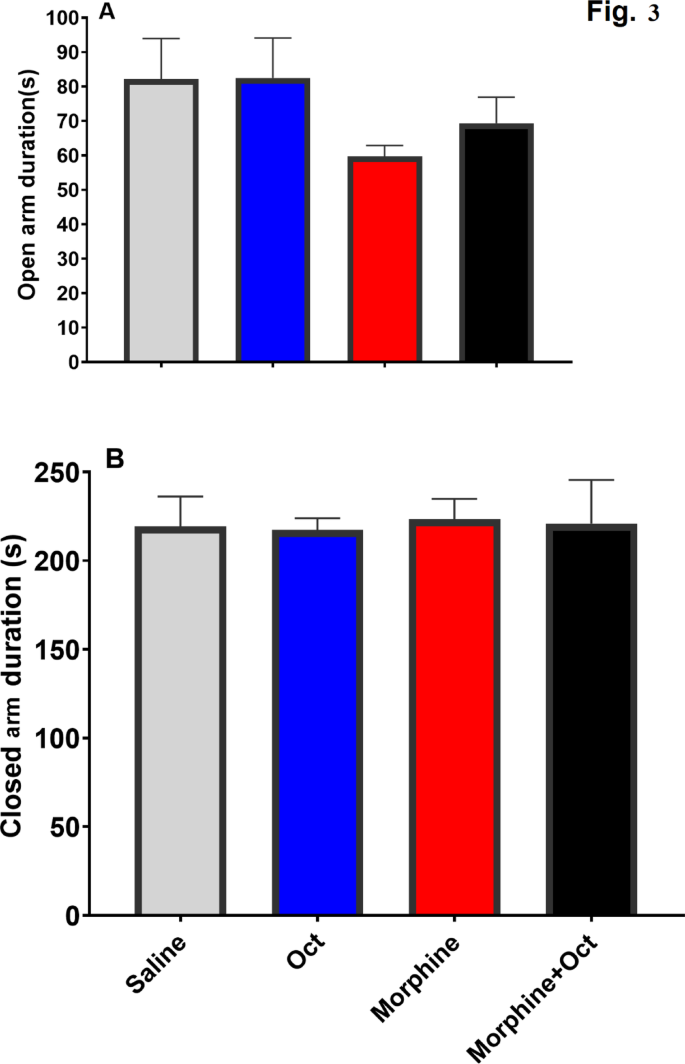
The plus-maze test included the duration of time that was spent in the closed and open arms for the four groups measured in seconds.
Passive avoidance learning and memory
Findings of the passive avoidance test (PAT) demonstrated that the shock number did not differ significantly between the study groups (F (3, 28) = 0.35, p = 0.78, Fig. 3A). However, the morphine group demonstrated a significantly lower STL compared to other groups, suggesting an impaired passive avoidance memory. Notably, the step through latency (STL) was normalized in the morphine + OCT group, highlighting the beneficial effects of OCT in ameliorating the morphine-induced deficits in passive avoidance memory (F (3, 28) = 1.56, p = 0.22, Fig. 3B).
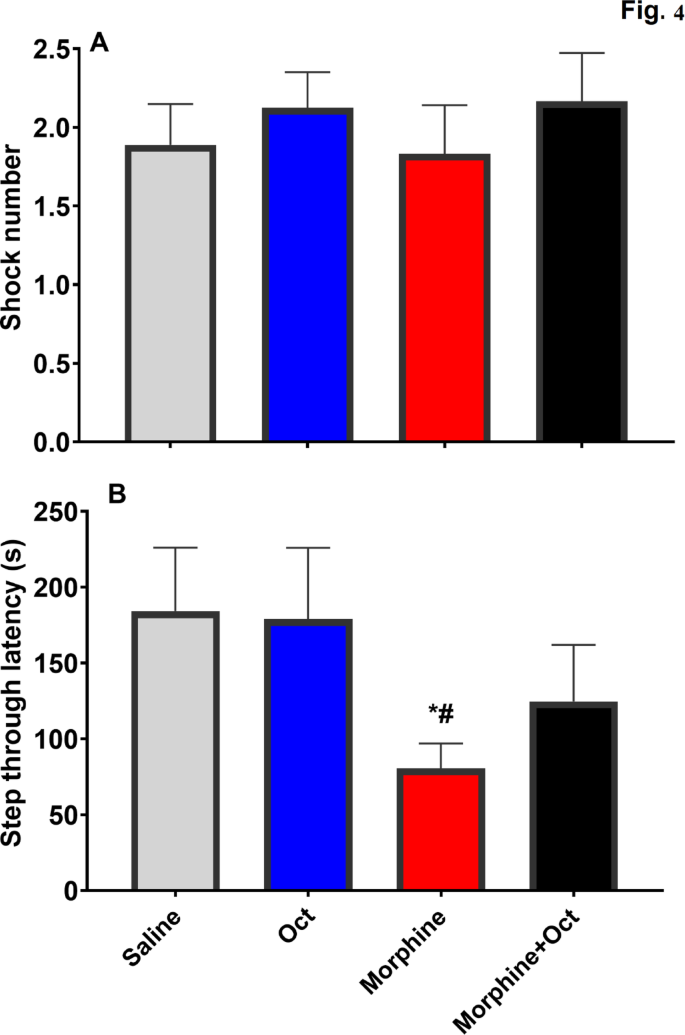
The passive avoidance latency test (PAT) included the shock number and step-through latency (s) of the four experimental groups. Data are expressed as the mean ± SEM (*P < 0.05) compared to the control group, and (#P < 0.05) in comparison to the OCT group.
OCT reverses morphine preference in rats during the conditioned place preference test
On the first day of the test, all groups spent nearly the same amount of time in the non-preferred chamber. While the duration of time for both the saline and OCT groups remained consistent, the time the morphine group spent in this chamber increased significantly over the course of two weeks (Fig. 4A). However, the morphine + OCT group exhibited a preference for morphine in day 13, which was comparable to saline and OCT groups. Pretest data indicates that neither group exhibited a strong preference for either compartment prior to conditioning. Post-saline and OCT groups, while thetest results demonstrate that the morphine-exposed group developed a significantly higher CPP score compared to the saline and OCT groups, while the conditioned place preference (CPP) of the morphine + OCT group was notably reduced. A two-way repeated-measures ANOVA revealed significant main effects of group (F (3, 56) = 9.9, P = 0.04, Fig. 4B) and conditioning (F (3, 56) = 41.1, P < 0.001), along with a significant interaction effect (F (1, 56) = 5.1, P = 0.02, Fig. 4B). These findings suggest that OCT administration can reverse the morphine preference behavior in morphine-exposed rats.
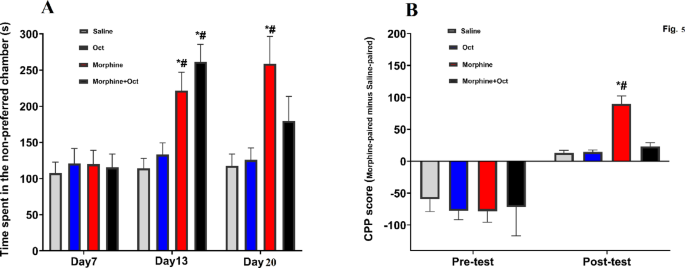
Impact of OCT administration on morphine preference behavior in rats exposed to morphine. (A) Duration of time that each group spent in the non-preferred chamber (s) on the 7th, 13th, and 20th days. (B) A two-way repeated-measures ANOVA of the Posttest results reveals that the morphine-exposed group exhibited a significantly higher CPP score compared to the saline and OCT groups, whereas the CPP score in the morphine + OCT group was significantly reduced. Data are expressed as the mean ± SEM (*P < 0.05) compared to control group and (#P < 0.05) other groups.
PCR
The qRT-PCR analysis of TLR4, BDNF, SIRT1, and mTOR gene expression, as illustrated in Figs. 5 and 6, revealed significant differences in gene expression patterns across different brain regions and experimental groups.
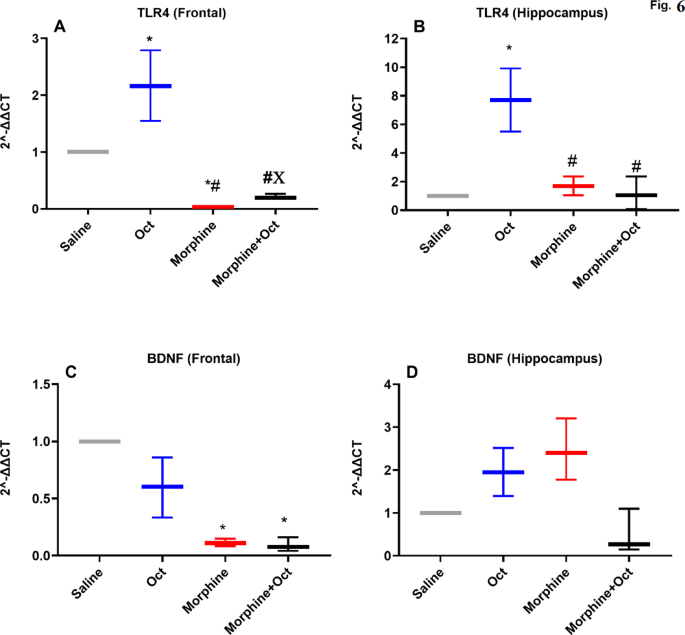
The expression of TLR4 and BDNF genes in frontal and hippocampus regions in four experimental groups. Data are expressed as the mean ± SEM (*P < 0.05). *The significance compared to the saline group, #The significance compared to the OCT group, XThe significance compared to the morphine group. Expression of mTOR was significantly higher in the morphine + OCT group than that in the morphine group.
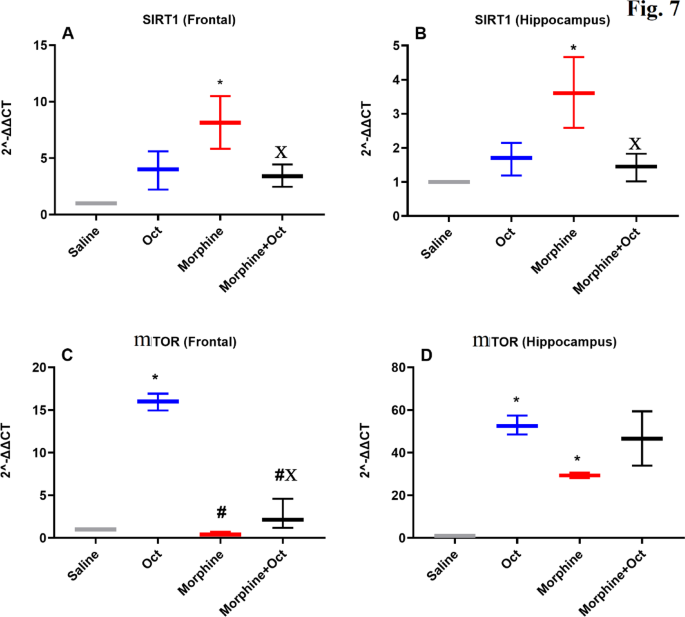
The expression of SIRT1 and MTOR genes in PFC and hippocampus regions in the four experimental groups. Data are expressed as the mean ± SEM (*P < 0.05). *The significance compared to the saline group, #The significance compared to the OCT group, XThe significance compared to the morphine group.
TLR4 gene expression
In the PFC, TLR4 was expressed differentially among the groups [H (3) = 10.5, P < 0.001, Fig. 5A]. The OCT and morphine groups exhibited significantly, higher and lower TLR4 expression, respectively, compared to the saline group (Fig. 5A, p < 0.05). Additionally, expression in the morphine and morphine + OCT groups was significantly lower in the PFC compared to the OCT group (p < 0.05). Moreover, TLR4 was expressed significantly higher in the morphine + OCT group compared to the morphine group in the PFC (p < 0.05). In the hippocampal area, TLR4 was also expressed differentially among the groups [H (3) = 8.05, P < 0.05, Fig. 5B]. In the OCT group, TLR4 was expressed significantly higher when compared to expression in the saline group (Fig. 5B, p < 0.05). Additionally, TLR4 in the morphine and morphine + OCT groups were expressed significantly lower in the hippocampus compared to that seen in the OCT group (p < 0.05).
BDNF gene expression
In the PFC, BDNF was expressed differentially among the groups [H (3) = 9.5, P < 0.01, Fig. 5C]. In the morphine and morphine + OCT groups, BDNF were expressed significantly lower in the PFC when compared to that seen in the saline group (Fig. 5C, p < 0.05). However, in the hippocampus, there was no significant difference among groups [H (3) = 8.6, P < 0.01, Fig. 5D].
SIRT1 gene expression
In the PFC, SIRT1 expression varied significantly among the groups [H (3) = 9.4, P < 0.01, Fig. 6A]. SIRT1 levels were significantly higher in the morphine group compared to the saline group (Fig. 6A, p < 0.05). Conversely, SIRT1 was expressed significantly lower in the morphine + OCT group compared to the morphine group (p < 0.05). In the hippocampus, SIRT1 was also expressed differentially among various groups [H (3) = 9.6, P < 0.01, Fig. 6B]. SIRT1 expressed significantly higher in the morphine group compared to expression in the saline group (Fig. 6B, p < 0.05). However, SIRT1 was expressed significantly lower in the morphine + OCT group when compared to expression in the morphine group (p < 0.05).
mTOR gene expression
In the PFC, expression of mTOR varied significantly among the groups [H (3) = 10.53, P < 0.001, Fig. 6C]. In the OCT group, a significantly higher mTOR expression was seen compared to that in the saline group Fig. 6C). In contrast, both the morphine and morphine + OCT groups showed considerably lower mTOR expression than that in the OCT group. In the hippocampus, mTOR expression was significantly higher in the OCT and morphine groups compared to the saline group [H (3) = 9.5, P < 0.01, Fig. 6D].
Histological examination
Histological analysis of H&E stained PFC and hippocampal tissue slices revealed differences in structural integrity between the experimental groups. In the PFC (Fig. 7, Top panel), (prefrontal saline (PS)) displayed healthy, definitions between groups (F (3, 8) = 11.2, p < 0.001). Quantitative analysis revealed significantly more intact neurons in the saline group when compared to the other groups (one-way ANOVA, p < 0.001). Indicative of damage by morphine, the most prominent neurodegeneration was seen in the morphine group (prefrontal morphine (PM); n = 50), with darkly stained, fragmented cells occupying over 60% of the observed field. Neurons in the OCT treatment group (n = 30) mainly resembled controls, though some mild phenotypic changes were noted in approximately 25% of cells. Notably, co-administration of OCT with morphine (prefrontal OCT + morphine (POM); n = 40) was associated with predominantly normal neuronal morphology, with crisp borders and nuclei. Quantification revealed the combination of OCT and morphine was associated with significantly more healthy neurons in the PFC than that seen in the group treated with morphine (Post-hoc Tukey, p < 0.001), and the numbers of healthy neurons was not statistically different than the numbers seen in the groups treated with saline or OCT, supporting the conclusion that OCT exhibits neuroprotection against morphine-induced neuronal damage in the PFC.
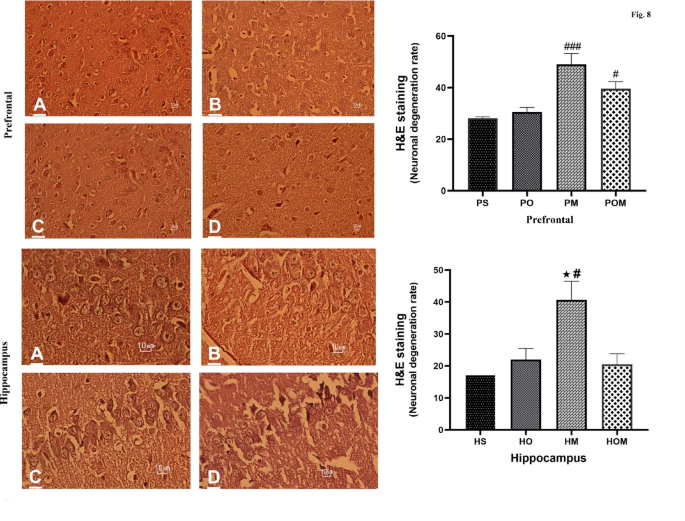
Micrographs showing histopathological results in the PFC (UP panel). (A) Saline group, (B) OCT group, (C) morphine group, (D) morphine + OCT group. Histopathological micrographs of hippocampal tissue slices (Down panel). Quantitative measures of PFC and hippocampal tissues among different histopathological study groups. Data are expressed as the mean ± SEM (#P < 0.05, ### P < 0.001). #: The significance compared to the saline group, *: The significance compared to the morphine + OCT group. HS, hippocampal saline group; HO, hippocampal OCT group; HOM, hippocampal morphine + OCT group; HM, hippocampal morphine group; PS, prefrontal saline group; PO, prefrontal OCT group; POM, prefrontal morphine + OCT group; PM, prefrontal morphine group.
A similar pattern was observed in the hippocampus (Figs. 7A–D, lower panel). As expected, neuronal integrity was high in the saline group (n = 18), whereas indicators of compromised cell health were seen in over 50% of cells in the morphine group (n = 50). Neurons in the group treated with OCT (n = 23) exhibited profiles similar to those seen in the saline group however, mild changes were noted in approximately 30% of neurons. Importantly, the combination of OCT and morphine (n = 21) was associated with neuronal profiles predominantly indicating intact neuronal morphology which resembled that seen in the saline group. Quantification of neuronal degeneration showed that the treatment with OCT + morphine resulted in significantly more healthy neurons than that seen in the morphine treated group (one-way ANOVA with Tukey, p < 0.01). This provides further indication of the potential for OCT to blunt morphine-mediated neurodegeneration. Taken together, these histological findings provide evidence of OCT’s neuroprotective capabilities in two neuronal regions important in addiction and shown to be affected by morphine exposure.
Docking
In the TLR4 docking study, OCT demonstrated a docking score of − 10.2, indicating strong binding affinity to the TLR4 receptor. The analysis revealed specific interactions between OCT and key amino acid residues in TLR4. The amine group of D-Phe in OCT formed an ionic bond with Asp208, demonstrating a robust electrostatic interaction. Additionally, this amine group engaged in both ionic and hydrogen bonding interactions with Asp180, contributing to the stabilization of the ligand within the TLR4 binding pocket. The amide nitrogen of Cys2 in OCT formed a hydrogen bond with Asp180, further strengthening the ligand-receptor interaction. Furthermore, the carbonyl group of Cys2 formed a hydrogen bond with Asn155, enhancing the overall binding affinity. The D-Trp residue in OCT formed a hydrogen bond with Ser85 via the nitrogen atom within the heterocyclic ring, adding to the stability of the ligand-receptor complex. Moreover, the amine group of the lysine side chain in OCT played a crucial role in the binding interaction as it formed hydrogen bonds and ionic interactions with Asp59 and Asp83, contributing to the overall stability of the ligand-receptor complex. Finally, one of the hydroxyl groups within the Thr residue of OCT formed a hydrogen bond with Lys153, further strengthening the ligand-receptor complex through a polar interaction (Fig. 8A).
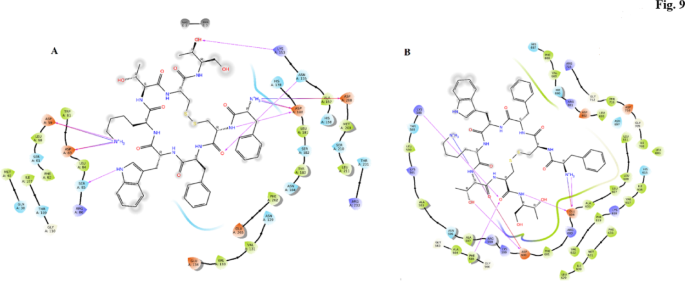
OCT in the binding site of TLR4 (A) and TRKb (B).
In the TRKb, which is BDNF’s receptor31 in, our docking study, OCT displayed a docking score of − 9.96, indicating a strong binding affinity with the TRKb receptor. The analysis revealed specific and meaningful interactions between OCT and key amino acid residues in TRKb. The amine group of D-Phe in OCT formed both a hydrogen bond and an ionic bond with Glu604, establishing a stable and favorable interaction at the binding site. Additionally, the side chain amine of Lys interacted with Asp600, contributing to the overall stability of the ligand-receptor complex. Notably, Asp600 also engaged in a hydrogen bond with the hydroxyl group of the side chain of Thr, further reinforcing the binding interaction. Furthermore, the carbonyl part of Cys7 in OCT formed hydrogen bonds with Lys588 and Phe565, likely facilitating additional favorable interactions and enhancing the overall stability of the ligand-receptor complex. Moreover, the nitrogen atom of threoninol in OCT participated in a hydrogen bond formation with Glu604, further strengthening the binding between the ligand and TRKb (Fig. 8B).
In the mTOR docking study, OCT exhibited a docking score of − 7.37, indicating a favorable binding affinity with the mTOR protein. The analysis revealed several key interactions between OCT and specific amino acid residues in mTOR. The amine group of D-Phe in OCT formed a hydrogen bond with Glu315, contributing to a stable interaction at the binding site. Additionally, the aromatic ring of Phe formed a hydrogen bond with Glu315 through the nitrogen atom in its amide group. The D-Trp residue in OCT engaged in pi–pi stacking with Tyr327 and formed pi–cation interactions with Arg274, further stabilizing the ligand-receptor complex. Lysine interacted with Tyr273 through pi–cation interactions and also formed ionic interactions with Asp275. Moreover, Lysine formed a hydrogen bond with Asp293. Thr313 in OCT formed a hydrogen bond with Asp275 through its side chain hydroxyl group. Additionally, the carbonyl group of Thr formed a hydrogen bond with Lys277. Furthermore, one of the hydroxyl groups of threoninol in OCT formed a hydrogen bond with Thr313, while the other hydroxyl group formed a hydrogen bond with Leu296 (Fig. 9A).
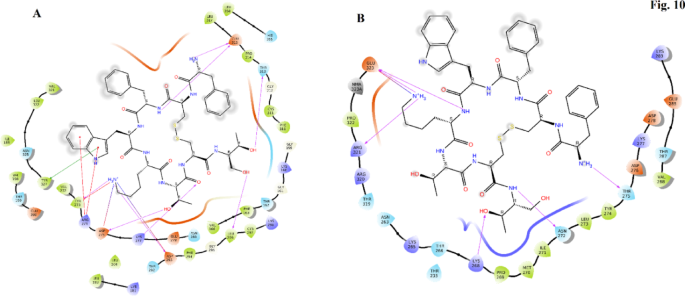
OCT in the binding site of mTOR (A) and TAF15 (B).
In the TAF15, which is SIRT1’s receptor20, in our docking study, OCT achieved a docking score of − 5.52, indicating a moderate binding affinity with the TAF15 protein. The analysis revealed several interactions between OCT and specific amino acid residues in TAF15. One notable interaction involved the hydrogen bonding between the amine group of D-Phe in OCT and Thr275 in TAF15, contributing to the stabilization of the ligand-receptor complex. Additionally, the side chain amine of Lys interacted with Glu323 in TAF15 through both an ionic interaction and a hydrogen bond formed by the amide nitrogen, further contributing to the binding of OCT to TAF15. Furthermore, Lys268 formed a hydrogen bond with one of the hydroxyl groups of OCT’s threoninol, adding to the overall binding interaction. Another interaction involved threoninol in OCT forming a hydrogen bond with Asn272 in TAF15 through its amide nitrogen, contributing to the stability of the ligand-receptor complex (Fig. 9B).