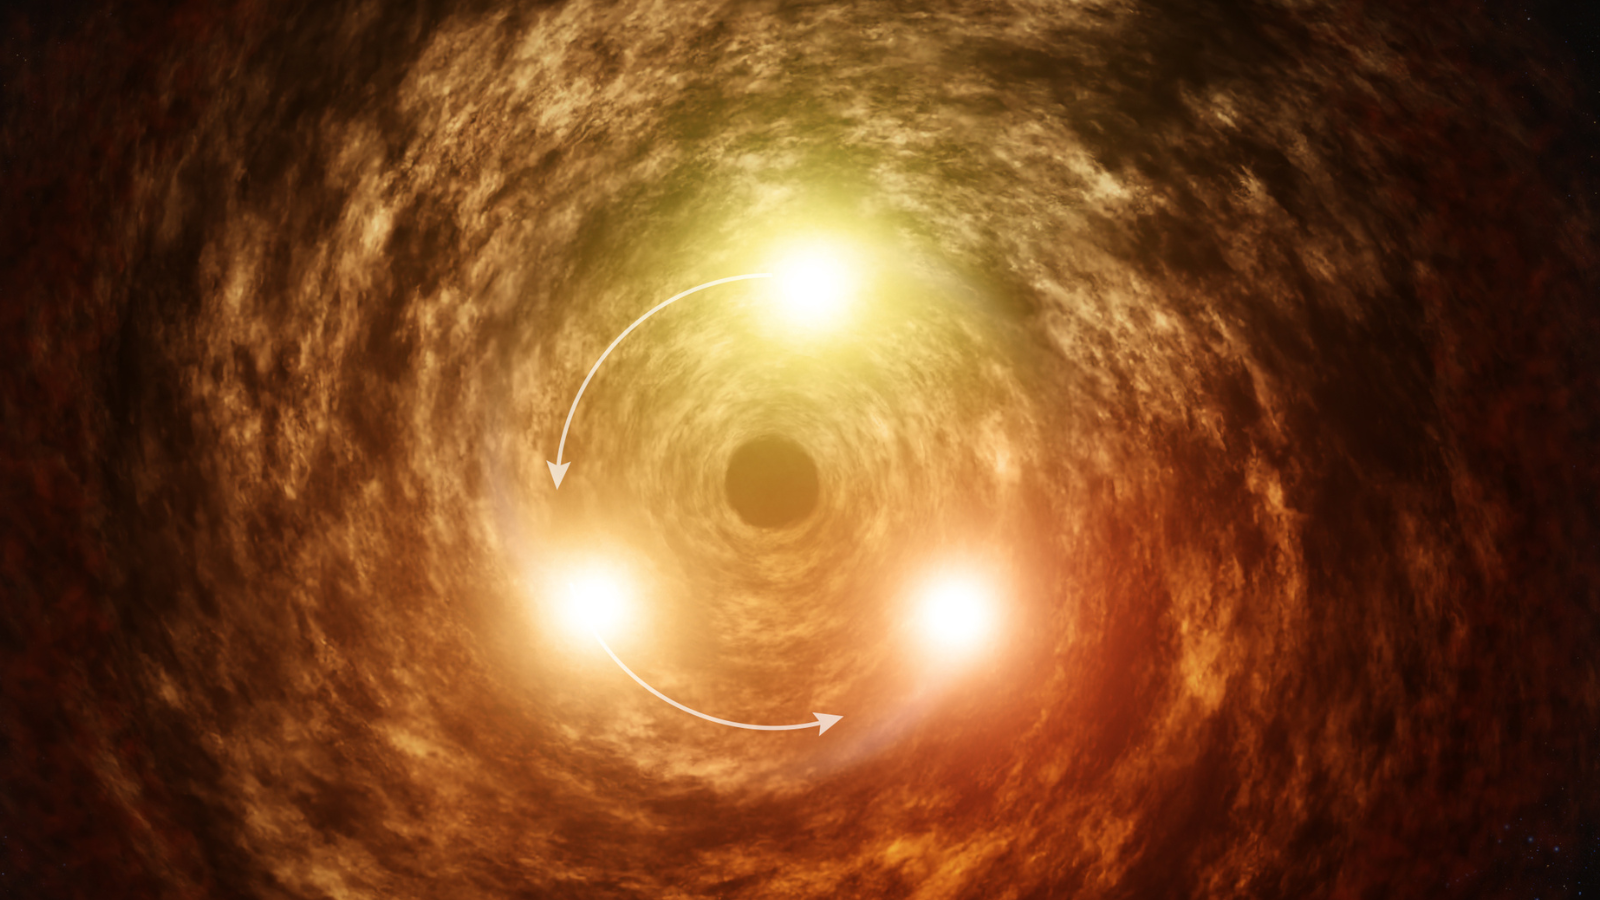
Serum D-Dimer, Glycated Serum Protein, and HbA1c Levels in Predicting

Introduction

Gestational Diabetes Mellitus (GDM) is the most common metabolic disorder during pregnancy, with its global prevalence steadily increasing each year. According to the International Diabetes Federation (IDF) statistics in 2021, approximately 14.0% of pregnant women worldwide are affected by GDM.1 GDM is not only a major contributor to maternal complications such as pregnancy-induced hypertension and cesarean section but also closely associated with adverse fetal outcomes.2,3 Macrosomia (birth weight ≥4000g), one of the typical complications of GDM, has an incidence rate of 15–45% among GDM pregnant women, significantly higher than that of non-GDM pregnant women (approximately 12%).4 Macrosomia not only increases the risk of birth canal trauma and shoulder dystocia but is also strongly linked to neonatal hypoglycemia, long-term childhood obesity, and metabolic syndrome.5 Therefore, accurately identifying high-risk populations and developing individualized intervention strategies in early pregnancy has become a significant challenge in perinatal medicine.6,7

Currently, in clinical practice, the prediction of macrosomia mainly relies on ultrasound assessment of fetal growth parameters (eg, abdominal circumference, femur length) and maternal blood glucose monitoring.6,8 However, the sensitivity of ultrasound markers in mid-pregnancy is only 60%-70%, and they are highly influenced by the operator’s experience.9,10 Traditional blood glucose markers (such as fasting blood glucose and postprandial blood glucose) only reflect short-term glucose fluctuations,11 making it difficult to fully assess the cumulative effect of chronic hyperglycemia exposure on the fetus. More critically, the pathological mechanism of macrosomia in GDM involves multiple dimensions: in addition to fetal hyperinsulinemia caused by insulin resistance, chronic inflammatory states, oxidative stress, and coagulation dysfunction may further promote excessive fetal growth through placental vascular lesions.12,13 Therefore, single-dimensional biomarkers are insufficient to meet the needs of precise prediction, necessitating the exploration of integrated models that combine metabolic, coagulation, and inflammatory pathways.

In recent years, multi-omics analysis of serum biomarkers has provided new insights for risk stratification of GDM complications.14,15 D-Dimer (D-D), a fibrin degradation product, not only reflects a hypercoagulable state but is also closely related to endothelial damage and chronic low-grade inflammation. Studies have shown that D-D levels in GDM pregnant women in mid-pregnancy are 40–60% higher than in healthy pregnant women and are positively correlated with the risk of fetal growth restriction.16 Glycated Serum Protein (GSP) and Glycated Hemoglobin (HbA1c), which reflect average blood glucose levels over different time spans of 2–3 weeks and 8–12 weeks, respectively, are important markers of blood glucose control. Due to its short half-life (approximately 14 days), GSP can more sensitively capture blood glucose fluctuations in mid-to-late pregnancy, while HbA1c, as the gold standard for diagnosing diabetes, has been confirmed in several cohort studies to be associated with excessive fetal growth.17,18 Glycated Serum Protein (GSP), measured in this study using the fructosamine nitroblue tetrazolium (NBT) method, is commonly referred to as “fructosamine”, particularly in the United States. It reflects the overall level of glycated serum proteins. It is important to note that alternative enzymatic assays, such as the GlycoGap method available in the US, provide a more specific measurement of glycated serum proteins compared to the traditional fructosamine NBT assay. Notably, these biomarkers reflect different aspects of pathophysiology: coagulation function, short-term, and long-term glucose metabolism. In theory, they can form a complementary predictive network. However, current research has mainly focused on single-marker analysis, lacking a systematic evaluation of the synergistic effect of multiple markers.

This study innovatively integrates D-D, GSP, and HbA1c into a combined analysis framework, aiming to address the following scientific questions: (1) Is there a synergistic pattern in the expression levels of coagulation and glucose metabolism markers in GDM pregnant women with macrosomia? (2) Can the combination of multiple markers break through the predictive limitations of traditional models? By retrospectively analyzing clinical data from 224 GDM pregnant women, this study constructs the first predictive model integrating coagulation and metabolic pathways, providing a theoretical basis and practical tool for early identification of GDM-related macrosomia.

Materials and Methods

Study Design

This study conducted a retrospective analysis of 224 pregnant women diagnosed with gestational diabetes mellitus (GDM) who delivered at our hospital between January 2021 and August 2024. Based on neonatal birth weight, 112 patients meeting the criteria for macrosomia were included in the macrosomia group, while 112 patients with normal birth weight infants were included in the normal group. Macrosomia is defined as a newborn with a birth weight of ≥ 4000g. Normal birth weight is defined as a newborn’s birth weight being between 2500g and 4000g. The assessment of clinical conditions and data collection were fully reviewed by our research team to ensure the accuracy of the information and completeness of the data. This study was approved by the ethics committee of Shijiazhuang Maternal and Child Health Hospital, and all participants signed informed consent before enrollment. The study adhered to the principles outlined in the Declaration of Helsinki.

Inclusion criteria: (1) Diagnosis of GDM based on the standards of the International Diabetes and Pregnancy Study Group after performing a 2-hour 75g oral glucose tolerance test after 28 weeks of pregnancy, with at least one of the following: fasting glucose (FBG) ≥ 5.1 mmol/L, 1-hour postprandial blood glucose (PBG) ≥ 10.0 mmol/L, or 2-hour PBG ≥ 8.5 mmol/L; (2) Diagnosis of macrosomia, defined as birth weight ≥ 4000g, and the normal birth weight group (2500–4000g).; (3) Spontaneous conception and singleton pregnancy; (4) No history of COVID-19 infection; (5) Complete clinical data; (6) No history of diabetes prior to pregnancy; (7) Good compliance with testing.

Exclusion criteria: (1)Co-existing cardiovascular diseases, significant organ dysfunction, or pre-pregnancy hypertension; (2) Previous history of diabetes or abnormal glucose tolerance with poor compliance; (3) Presence of other pregnancy complications; (4) Pregnancy achieved through assisted reproductive technology.

Data Collection

Demographic Data of Patients

The hospital’s electronic medical record system was used to gather general and clinical information on both patient groups, such as age, body mass index, education level, smoking history, alcohol history, annual family income, gestational age of previous pregnancy or delivery, FBG, fasting insulin(FINS) and Homeostasis Model Assessment of Insulin Resistance (HOMA-IR). HOMA-IR=fasting insulin concentration (μU/L) × fasting glucose (mmol/L)/22.5 Baseline demographic and clinical characteristics, including the mother’s age at delivery, number of births, and level of education (elementary, high school, college, and beyond), were identified as potential confounding factors. In addition, weight-related variables, including pre-pregnancy body mass index (BMI, kg/m2), were major confounders.

Detection of Serum D-D, GSP and HbA1c

Fasting venous blood samples (3 mL) were collected from the antecubital vein of all participants between 28 and 30 weeks of pregnancy. For three days prior to testing, both groups of pregnant women were instructed to maintain their normal dietary habits. On the day before testing, they were asked to fast after dinner and maintain a fasting state until the time of blood collection. On the day of testing, fasting venous blood samples were collected in the morning. HbA1c levels were measured using an immunoturbidimetric method with an automatic biochemical analyzer (Beckman Coulter, Model AU680). GSP (fructosamine) levels were measured using the fructosamine nitroblue tetrazolium (NBT) method, using commercially available kits provided by Beckman Coulter, Inc. (Indianapolis, IN, USA). D-Dimer levels were measured using the immunoturbidimetric method with the automated coagulation analyzer (STAGO c0MPAcT) from France, with test kits sourced from ADL Company, USA.

Statistical Analysis

SPSS 26.0 (IBM Corp., Armonk, NY, USA) was used to conduct the statistical analysis. Normality of continuous data was evaluated using the Shapiro–Wilk test. The t-test was used to compare two samples, and normally distributed continuous data were reported as mean ± standard deviation. Group comparisons were carried out using the Mann–Whitney U-test, and non-normally distributed continuous data were displayed as median (minimum, maximum). The χ²-test was used to compare two samples, and categorical data were represented as [n (%)]. The risk factors of macrosomia were analyzed by multiple factors. Before multivariate analysis, variance inflation factor (VIF) was used to assess multicollinearity among key glucose- and insulin-related variables, including HOMA-IR, fasting blood glucose (FBG), glycated serum protein (GSP), and HbA1c. Variables with VIF > 5 were considered to exhibit significant collinearity and were excluded from the final model. Additionally, body mass index (BMI) was included as a covariate to adjust for potential confounding effects. The diagnostic value of each index was judged by ROC curve. The threshold for statistical significance was set at P <0.05.

Results

Demographic Data Comparison

A total of 224 participants were included, with 112 in each group. No significant differences were observed in age, BMI, educational level, smoking history, alcohol consumption, family income, previous pregnancies, or gestational age at delivery (all p>0.05). However, significant differences were found in metabolic markers. Fasting blood glucose (5.60 [5.41, 6.89] vs 5.31 [5.07, 5.81] mmol/L, p<0.001), fasting insulin (17.45±4.45 vs 16.31±3.54 μU/L, p=0.037), and HOMA-IR (4.35±1.08 vs 3.84±0.88, p<0.001) were significantly higher in the macrosomia group compared to the normal group. As shown in Table 1.

Table 1 Demographic Data Comparison [, M(P25, P75), n (%)]

Comparison of Serum D-D, GSP, HbA1c

Significant differences were observed between the macrosomia and normal groups in several metabolic markers. The macrosomia group had significantly higher levels of D-Dimer (4.90 [3.51, 5.74] vs 2.98 [2.14, 3.78] mg/L, p<0.001), GSP (3.49±0.33 vs 3.07±0.36 μmol/L, p<0.001), HbA1c (7.49±1.68 vs 5.85±0.91%, p<0.001), and HOMA-IR (4.35±10.8 vs 3.84±0.88, p<0.001). These findings suggest that higher levels of D-Dimer, GSP, HbA1c, and insulin resistance (as measured by HOMA-IR) are significantly associated with macrosomia. These results indicate a possible link between metabolic dysfunction and the occurrence of macrosomia in this population. As shown in Table 2.

Table 2 Comparison of Serum D-D, GSP, HbA1c [, M(P25, P75)]

Comparison of Infant Indicators

Significant differences were observed in birth weight between the macrosomia and normal birth weight groups, with the macrosomia group having a significantly higher average birth weight (4445.83±196.19 g vs 3386.09±328.83 g, p<0.001). However, no significant differences were found in body length (51.21±1.50 cm vs 51.08±1.17 cm, p=0.460), chest circumference (34.46±1.52 cm vs 34.31±1.48 cm, p=0.436), or head circumference (34.15±1.20 cm vs 34.03±1.13 cm, p=0.433) between the two groups. These results suggest that while macrosomia is associated with significantly higher birth weight, other anthropometric measures such as body length, chest circumference, and head circumference are not significantly different between the two groups. As shown in Table 3.

Table 3 Comparison of Infant Indicators ()

Multivariate Analysis of Risk Factors for Macrosomia

A logistic regression analysis was conducted to assess the factors associated with macrosomia. Collinearity analysis was performed on HOMA-IR, fasting blood glucose, insulin, as well as D-D, GSP and HbA1c. Factors with VIF>5 were excluded. Therefore, only D-D, GSP and HbA1c were included in the multivariate analysis. Univariate logistic regression showed that D-dimer (DD), GSP, and HbA1c were significantly associated with the outcome. Specifically, DD (OR=2.378), GSP (OR=31.254), and HbA1c (OR=2.512) were independent risk factors. After adjusting for confounders including BMI in multivariate analysis, DD (OR=2.374), GSP (OR=31.890), and HbA1c (OR=2.482) remained significant predictors. BMI was not significantly associated with the outcome. Overall, DD, GSP, and HbA1c are robust independent predictors even after controlling for BMI. As shown in Table 4.

Table 4 Multivariate Analysis of Risk Factors for Macrosomia

Analysis of Diagnostic Value of Each Index to Macrosomia

The diagnostic performance of various indicators for predicting macrosomia was assessed using receiver operating characteristic (ROC) analysis. The area under the curve (AUC) for D-Dimer (DD) was 0.7857 (95% CI: 0.7256–0.8457), with a sensitivity of 66.96% and specificity of 84.82%, yielding a Youden index of 0.5178. GSP demonstrated an AUC of 0.7980 (95% CI: 0.7407–0.8553), with a sensitivity of 80.36% and specificity of 69.64%, resulting in a Youden index of 0.5000. HbA1c had an AUC of 0.7917 (95% CI: 0.7314–0.8520), with a sensitivity of 62.50% and specificity of 90.18%, giving a Youden index of 0.5268. When these markers were combined, the AUC increased to 0.9241 (95% CI: 0.8912~0.9570), with a sensitivity of 83.93%, specificity of 86.61%, and a Youden index of 0.7054. These results indicate that the combined detection of these markers offers superior diagnostic accuracy for macrosomia compared to individual markers. As shown in Table 5, Figure 1.

Table 5 Analysis of Diagnostic Value of Each Index to Macrosomia

Figure 1 Receiver operating characteristic (ROC) curves for D-dimer, glycated serum protein (GSP), HbA1c, and their combined detection in predicting macrosomia.

Notes: The area under the curve (AUC) for combined detection was 0.924 (95% CI: 0.891–0.957), indicating superior diagnostic performance compared to individual markers.

Discussion

This study confirmed that the combined detection of serum D-Dimer (D-D), Glycated Serum Protein (GSP), and HbA1c has significant predictive value for macrosomia in gestational diabetes mellitus (GDM). Compared to the normal birth weight group, the macrosomia group had significantly higher levels of D-D (4.90 vs 2.98 mg/L), GSP (3.49 vs 3.07 μmol/L), and HbA1c (7.49% vs 5.85%) (all p<0.001).

This result is consistent with trends observed in previous studies. Bender et al19 in their cohort study on non-GDM patients found that the proportion of macrosomia was higher in women with HbA1c levels between 5.7–6.4% (10.5%) compared to those with HbA1c <5.7% (6.8%). Barbry et al18 investigated 4383 GDM women and found that HbA1c ≥ 5.6% (38 mmol/mol) indicated a higher risk of macrosomia, with an OR of 2.12 [1.29; 3.46] for HbA1c 5.6–5.9%, and OR of 2.06 [1.14; 3.70] for HbA1c > 5.9%, compared to HbA1c ≤ 4.5% (26 mmol/mol). Similar findings were reported by Muhuza et al.17 Notably, GSP in our study showed particularly strong predictive value (OR=31.89), possibly related to its sensitivity to short-term glucose fluctuations. Chen et al20 previously reported that GDM women had higher serum levels of GSP, homocysteine (Hcy), and cystatin C (Cys-C) compared to normal controls (P <0.05), with GSP’s AUC for predicting adverse pregnancy outcomes in GDM being 0.817, showing good predictive value.

Interestingly, our data showed that GSP exhibited higher sensitivity (80.36%) while HbA1c showed higher specificity (90.18%) in predicting macrosomia. This difference may be explained by the distinct physiological timeframes these markers represent: GSP, reflecting glycemic control over 2–3 weeks, is more responsive to recent or short-term glucose fluctuations and may thus better capture transient glycemic spikes in mid-to-late pregnancy; in contrast, HbA1c reflects average glucose over a longer period (8–12 weeks), which may be more specific to sustained hyperglycemia that contributes to fetal overgrowth. This complementary pattern supports the rationale for combining both markers in a multidimensional prediction model.

Li et al21 found that women with GDM exhibited more severe insulin resistance (increased HOMA-IR) compared to women with normal glucose tolerance (NGT), and in the subgroup with HOMA-IR ≥ 1.61/BMI 18.5–25 kg/m², the incidence of macrosomia was significantly higher (9.8% vs 3.7%, p = 0.025). Yin et al22 found that the incidence of GDM increased with elevated HbA1c and HOMA-IR, and when both HbA1c and HOMA-IR were elevated, the risk of GDM was significantly increased. However, in contrast to the findings of Sun et al23 who reported significant associations between late-pregnancy HOMA-IR (measured at 32–36 weeks)/change in HOMA-IR (ΔHOMA-IR) and adverse outcomes including macrosomia, HOMA-IR measured at a single mid-gestation time point (28–30 weeks) in our study did not reach statistical significance in the multivariate model (OR=1.44, p=0.097). Besides, this discrepancy highlights a crucial point. While Li et al21 also utilized a single HOMA-IR measurement (at GDM diagnosis, 22–28 weeks), their significant finding for macrosomia emerged from stratifying patients into metabolic subtypes based on combined HOMA-IR and BMI cut-offs, rather than evaluating HOMA-IR as a continuous predictor in a multivariate model like ours. This suggests that the impact of insulin resistance on macrosomia risk may be more strongly linked to its trajectory and late-gestation severity (potentially mediated through progressive placental metabolic reprogramming or inflammatory pathways) rather than a single snapshot in mid-pregnancy. Future studies incorporating serial assessments of insulin resistance, particularly extending into the third trimester, are warranted to further elucidate its dynamic role and refine predictive models.

Notably, BMI was included as a covariate in the regression model due to its known inverse relationship with GSP, particularly glycated albumin, which is the major component measured by the fructosamine assay. Several studies have confirmed that higher BMI is associated with lower glycated albumin levels independent of glucose concentration. Adjusting for BMI in our model ensured that the predictive value of GSP was not confounded by body composition differences, thereby enhancing the robustness of our findings.

In terms of clinical application, the combined model achieved an AUC of 0.924, improving by 0.13 compared to single markers. The higher efficacy of our model may be attributed to the unique contributions of GSP and D-D. This finding provides important evidence for clinical decision-making: for pregnant women in the “gray zone”, coagulation function evaluation may serve as an effective supplement to risk stratification.

However, the limitations of this study must be carefully considered. First, the single-center retrospective design may lead to selection bias. Although we controlled for major confounding factors through 1:1 matching, unrecorded factors such as dietary patterns and exercise compliance may affect the generalizability of the results. Second, GSP testing has not yet been widely implemented in clinical practice, and variations in standardization across different testing methods (enzyme vs HPLC) may limit the applicability of the model. Additionally, the study did not differentiate between GDM subtypes (A1 and A2), and A2-type women may require more aggressive insulin intervention;24 thus, further validation in subgroups is needed.

Based on the current findings, future research could address three main directions: First, conduct multi-center prospective cohort studies to validate the cross-population applicability of the model, with particular attention to ethnic variations in biomarker thresholds and implementation barriers across healthcare resource settings.25,26 Second, integrate ultrasound parameters (such as fetal abdominal circumference growth rate) with biochemical markers to develop a multi-modal predictive system, providing direction for optimizing the existing model.27 Third, explore the clinical translation pathways for diagnostic technologies. For primary healthcare institutions, a rapid GSP testing technology based on fingertip blood (similar to current HbA1c bedside testing devices) could be developed, combined with D-D instant testing (POCT), forming a fast screening protocol.

The core clinical implication of this study is that preventing macrosomia requires breaking beyond the framework of one marker of blood glucose control, focusing on the multi-dimensional interaction of metabolism and coagulation systems. For pregnant women with persistently elevated D-D levels, even if blood glucose control is satisfactory, it is still advisable to shorten ultrasound monitoring intervals or assess the feasibility of preventive anticoagulant therapy. As precision medicine advances, risk stratification based on biomarker combinations will undoubtedly become an important tool in perinatal medicine, with this study providing crucial evidence-based support.

Conclusion

In conclusion, the combined use of D-Dimer, Glycated Serum Protein, and Glycated Hemoglobin provides a new perspective for predicting the risk of macrosomia in gestational diabetes mellitus (GDM). These three biomarkers are easily accessible, cost-effective, and suitable for promotion across healthcare institutions at various levels. With the growing prevalence of precision medicine, risk assessment based on multidimensional biomarkers will become a crucial tool in perinatal management, and this study offers key evidence to support this approach. Future research should focus on translating laboratory findings into clinical pathways, ultimately achieving a “prediction-prevention-personalized intervention” closed-loop management model.

Data Sharing Statement

The datasets used and analysed in this study are available upon contact with the corresponding author.

Ethics Statement

This study was approved by the ethics committee of Shijiazhuang Maternal and Child Health Hospital, and all participants signed informed consent before enrollment. The study adhered to the principles outlined in the Declaration of Helsinki.

Author Contributions

All authors made a significant contribution to the work reported, whether that is in the conception, study design, execution, acquisition of data, analysis and interpretation, or in all these areas; took part in drafting, revising or critically reviewing the article; gave final approval of the version to be published; have agreed on the journal to which the article has been submitted; and agree to be accountable for all aspects of the work.

Funding

There is no funding to report.

Disclosure

No potential conflict of interest was reported by the authors.

References

1. Wang H, Li N, Chivese T, et al. IDF diabetes atlas: estimation of global and regional gestational diabetes mellitus prevalence for 2021 by international association of diabetes in pregnancy study group’s criteria. Diabet Res Clin Pract. 2022;183:109050. doi:10.1016/j.diabres.2021.109050

2. Lowe WL Jr, Scholtens DM, Kuang A, et al. Hyperglycemia and adverse pregnancy outcome follow-up study (HAPO FUS): maternal gestational diabetes mellitus and childhood glucose metabolism. Diabetes Care. 2019;42(3):372–380. doi:10.2337/dc18-1646

3. Ye W, Luo C, Huang J, Li C, Liu Z, Liu F. Gestational diabetes mellitus and adverse pregnancy outcomes: systematic review and meta-analysis. BMJ. 2022;377:e067946. doi:10.1136/bmj-2021-067946

4. Kc K, Shakya S, Zhang H. Gestational diabetes mellitus and macrosomia: a literature review. Ann Nutr Metab. 2015;66 Suppl 2:14–20. doi:10.1159/000371628

5. Young BC, Ecker JL. Fetal macrosomia and shoulder dystocia in women with gestational diabetes: risks amenable to treatment? Curr Diab Rep. 2013;13(1):12–18. doi:10.1007/s11892-012-0338-8

6. O’Dwyer V, Russell NM, McDonnell B, Sharkey L, Mulcahy C, Higgins MF. Antenatal prediction of fetal macrosomia in pregnancies affected by maternal pre-gestational diabetes. J Matern Fetal Neonatal Med. 2022;35(25):7412–7416. doi:10.1080/14767058.2021.1949447

7. Kang X, Liang Y, Wang S, et al. Prediction model comparison for gestational diabetes mellitus with macrosomia based on risk factor investigation. J Matern Fetal Neonatal Med. 2021;34(15):2481–2490. doi:10.1080/14767058.2019.1668922

8. Hong M, Liang F, Zheng Z, et al. Interaction and joint association of gestational diabetes mellitus and subsequent weight gain rate on macrosomia. Clin Nutr ESPEN. 2023;58:368–374. doi:10.1016/j.clnesp.2023.11.001

9. Leiroz R, Aquino MA, Santos KP, et al. Accuracy of the mid-trimester ultrasound scan in the detection of fetal congenital anomalies in a reference center in Northeastern Brazil. J Gynecol Obstet Hum Reprod. 2021;50(10):102225. doi:10.1016/j.jogoh.2021.102225

10. Walsh CA, Lees N. Prevalence of anomalies on the routine mid-trimester ultrasound: 3172 consecutive cases by a single maternal-fetal medicine specialist. Australas J Ultrasound Med. 2024;27(1):12–18. doi:10.1002/ajum.12369

11. Bai W, Wang H, Fang R, et al. Evaluating the effect of gestational diabetes mellitus on macrosomia based on the characteristics of oral glucose tolerance test. Clin Chim Acta. 2023;544:117362. doi:10.1016/j.cca.2023.117362

12. Huang X, Zha B, Zhang M, et al. Decreased monocyte count is associated with gestational diabetes mellitus development, macrosomia, and inflammation. J Clin Endocrinol Metab. 2022;107(1):192–204. doi:10.1210/clinem/dgab657

13. Liu B, Xu Y, Voss C, et al. Altered protein expression in gestational diabetes mellitus placentas provides insight into insulin resistance and coagulation/fibrinolysis pathways. PLoS One. 2012;7(9):e44701. doi:10.1371/journal.pone.0044701

14. Hu L, Han J, Zheng F, et al. Early second-trimester serum microRNAs as potential biomarker for nondiabetic macrosomia. Biomed Res Int. 2014;2014:394125. doi:10.1155/2014/394125

15. Wen J, Hong Q, Zhu L, et al. Association of maternal serum 25-hydroxyvitamin D concentrations in second and third trimester with risk of gestational diabetes and other pregnancy outcomes. Int J Obes. 2017;41(4):489–496. doi:10.1038/ijo.2016.227

16. Zhang Y, Li T, Yue CY, Liu Y. Associations of serum D-dimer and glycosylated hemoglobin levels with third-trimester fetal growth restriction in gestational diabetes mellitus. World J Diabetes. 2024;15(5):914–922. doi:10.4239/wjd.v15.i5.914

17. Muhuza MPU, Zhang L, Wu Q, Qi L, Chen D, Liang Z. The association between maternal HbA1c and adverse outcomes in gestational diabetes. Front Endocrinol. 2023;14:1105899. doi:10.3389/fendo.2023.1105899

18. Barbry F, Lemaitre M, Ternynck C, et al. HbA1c at the time of testing for gestational diabetes identifies women at risk for pregnancy complications. Diabetes Metab. 2022;48(3):101313. doi:10.1016/j.diabet.2021.101313

19. Bender WR, McCarthy C, Elovitz M, Parry S, Durnwald C. Adverse pregnancy outcomes in nondiabetic patients with an elevated early pregnancy HbA1c. Am J Perinatol. 2022;29(14):1496–1502. doi:10.1055/a-1877-8696

20. Chen Y, Li C, Lei Y, Zhang F. Effects of glycated serum protein, homocysteine, and cystatin-C levels on pregnancy outcomes in patients with gestational diabetes mellitus. Pak J Med Sci. 2024;40(4):572–576. doi:10.12669/pjms.40.4.8988

21. Jiang L, Li AQ. Characteristics and pregnancy outcomes of subtypes of gestational diabetes mellitus based on HOMA-IR and BMI. Arch Gynecol Obstet. 2024;310(5):2355–2361. doi:10.1007/s00404-024-07733-6

22. Yin B, Ding L, Chen Z, Zhu Y, Zhu B, Chen Y. Combining HbA1c and insulin resistance to assess the risk of gestational diabetes mellitus: a prospective cohort study. Diabet Res Clin Pract. 2023;199:110673. doi:10.1016/j.diabres.2023.110673

23. Sun YY, Juan J, Xu QQ, Su RN, Hirst JE, Yang HX. Increasing insulin resistance predicts adverse pregnancy outcomes in women with gestational diabetes mellitus. J Diabetes. 2020;12(6):438–446. doi:10.1111/1753-0407.13013

24. Ghamri KA. Insulin requiring Gestational Diabetes: risk factors and correlation with postpartum diabetes and prediabetes. Pak J Med Sci. 2023;39(5):1260–1267. doi:10.12669/pjms.39.5.7648

25. Filardi T, Gentile MC, Venditti V, et al. The impact of ethnicity on fetal and maternal outcomes of gestational diabetes. Medicina. 2022;58(9):1161. doi:10.3390/medicina58091161

26. Duke A, Yap C, Bradbury R, et al. The discordance between HbA1c and glucose tolerance testing for the postpartum exclusion of diabetes following gestational diabetes. Diabet Res Clin Pract. 2015;108(1):72–77. doi:10.1016/j.diabres.2015.01.006

27. Xuan Nguyen K, Bui Minh T, Dinh HT, et al. Low-grade inflammation in gestational diabetes mellitus and its correlation with maternal insulin resistance and fetal growth indices. Int J Gen Med. 2023;16:1429–1436. doi:10.2147/IJGM.S408856

Continue Reading