Our results focus on the effects of reducing demand and vehicle capacity on passenger interactions. The first part highlights the main changes in passenger behavior and differences in passenger travel patterns. The second part focuses on the epidemiological effects to identify which scenario had the most significant effect on the number of infected passengers. Finally, at the end of the result section, we identify the critical parts of the system from an epidemiological point of view.
Effects of reduced demand and vehicle capacity
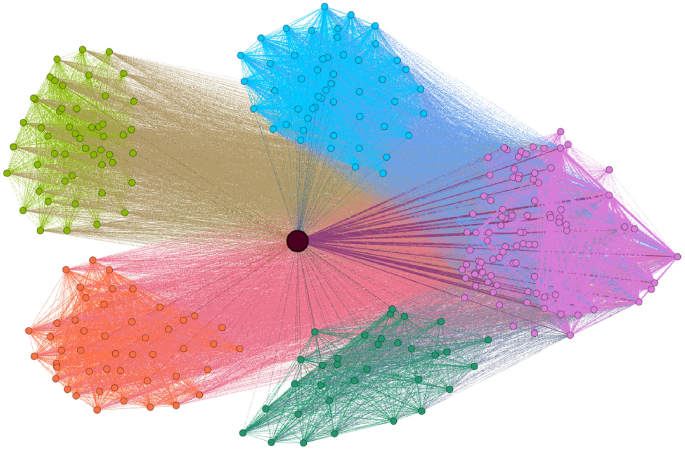
As discussed in previous sections, the contact network describes the fine structure of passenger co-traveling relationships during the day. Figure 5 summarizes the changes in key network metrics of the contact network under different demand and vehicle capacity restrictions. These metrics include the number of passengers (nodes), the number of connections (edges), as well as median degree (co-travel connections of individual passengers). If a vehicle travels between stations A and B, passengers sharing the trip will form a clique (fully connected subgraph) in the network. Therefore, metrics also include median clique sizes describing the size of the co-traveling groups between stations. The results shown in the table suggest that capacity restrictions and demand-related changes effectively disrupt the formation of large high-risk clusters, potentially reducing the risk associated with infectious passengers within the transit network.
The results show a significant decrease in the overall size of the passenger contact network (as shown by the number of nodes and edges) across the different scenarios. These changes highlight the impact of the demand and vehicle capacity changes on the network structure.
Heatmaps highlighting changes in key metrics in the contact network across different scenarios; The contact network in scenarios with maximal demand and no vehicle capacity restrictions consists of 48,546 nodes and 3,756,340 edges.
The restrictions also influenced the degree distribution of the contact network. As the degree of a given node represents the number of direct contacts a passenger has during the day, the risk of exposure to infectious diseases is reduced as demand and capacities decrease. At 100% demand, the median number of passenger connections was 118. Across the different scenarios, this number dropped to 58.
Diseases tend to spread more quickly inside a community or a strongly connected cluster due to the higher number of connections among passengers. Therefore, as passenger groups grow and become more interconnected in the network, they promote the spreading process, working as super spreaders during epidemiological simulation. Consequently, clique sizes and clique size distributions are expected to strongly correlate with the final epidemiological modeling results.
Demand serving functionality of the transit system
The structure of the transit system does not always match the given structure of demand due to limitations in infrastructure. A natural example is when too many passengers attempt to reach a destination simultaneously, but only a limited number of vehicle trips are available to serve that station. If the system cannot handle individual passengers due to the infeasibility of their demand, they cannot reach their destination, and the route choice model leaves them out of the simulation and the contact network simultaneously. Therefore, for each scenario, a small portion of passengers cannot satisfy their demand due to restrictions in vehicle capacity. This enables the identification of critical parts of the system from an operability point of view, designating vehicle trips that are sensitive to reduced capacities, leaving passengers without transit options. This information can also be used to evaluate the system’s capability to serve passengers. As seen in Table 2, the number of passengers who are unable to reach their destinations increases as restrictions in vehicle capacity are introduced. Consequently, reducing demand naturally reduces the load on sensitive vehicle systems, facilitating system efficiency.
Under normal operating conditions, with 100% demand and unrestricted vehicle capacity, 4270 passengers failed to reach their destination. This serves as a baseline for comparing the effects of different scenarios. Table 2 shows that as capacity restrictions are introduced, the number of passengers with infeasible demand grows substantially. The trend worsens as capacity restrictions become more strict, reaching as many as 9203 stranded passengers at the end of the restriction range. This means that introducing only transit system-related restrictions significantly damages operability. However, even a slight decrease in demand helps ease the load on critical components, helping the system serve a larger portion of passenger demand.
The results demonstrate the necessity of balance between capacity restrictions and demand management. Combining different demands and reducing vehicle capacity can help maintain operability while protecting passengers in case of an outbreak.
Epidemiological spread analysis
This section is an overview of the epidemiological simulation results, which focus on the global rate of infected passengers and the number of highly endangered individuals. We also provide these values as a ratio compared to the network size in each scenario to compare the real epidemiological effects of restrictions.
At the beginning of each simulation process, we started with 100 infected passengers ((|A_0| =100)), selected randomly from the network, and then we simulated 5 iterations representing an infection period of 5 days. We ran the epidemic spreading process (k = 100,000) times to estimate the probability of infection. As discussed previously, we selected (tau _i) so that no nodes transitioned to the removed state, remaining infectious throughout the simulation.
The epidemiological simulation shows that reduced demand and vehicle capacities affect the global infection rate of the contact network. Figure 6 presents the expected percentage of passengers who are infected at the end of the simulation.
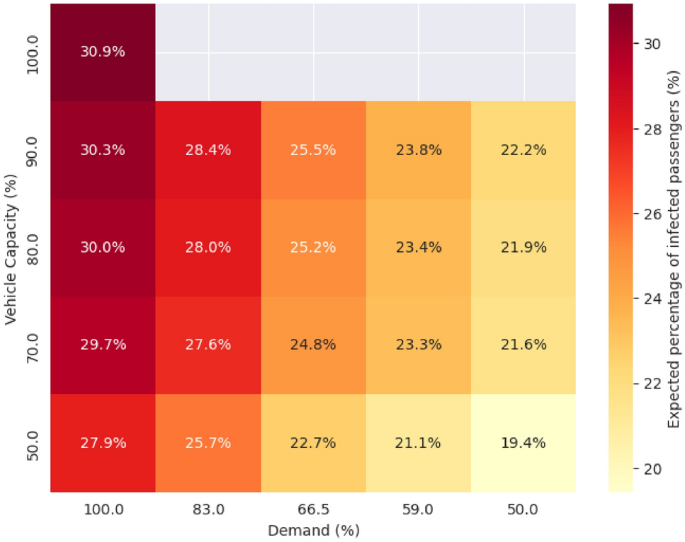
Infection risk associated with each scenario (demand and vehicle capacity).
The baseline scenario that did not have reduced demand or restricted capacities shows an infection rate of 30.9%. As the capacity restriction becomes more strict, global infection slightly declines, reducing to 27.9%. A similar but more pronounced trend can be observed for lower demand levels. For example, a 50% reduction in demand results in 8.5% decrease in the risk of infection in the scenario where vehicle capacity is set to 90%. Results show that the reduction in infection rate is more noticeable in the case of demand change than in restricted capacities. However, implementing capacity restrictions, even without significantly reducing passenger demand, can reduce infection rates within the transit network. Furthermore, the combined effect of restrictions on the transit system and government regulations that affect demand can substantially reduce the impact of an outbreak on society. The results underscore the importance of coordinated measures in managing public health risks during pandemics.
To determine changes in the number of infected passengers in a more refined way, we collected highly endangered passengers—those with a final infection probability greater than 50%—from the different demand and capacity-reduced scenarios. The table 3 provides a different view of the results.
In the original scenario, with full capacity and demand, capacity restrictions reduced the percentage of highly endangered individuals from 23.3% to 20%. The results follow the same trend as the global infection percentage: as demand decreases and capacity restrictions are introduced, this percentage declines further. For example, when capacity restrictions increase from 0% to 50%, the percentage drops to 16.6%, reducing the proportion of endangered passengers by 7%. Furthermore, when decision-makers implement 50% capacity restrictions along with local measures that reduce demand by 50%, the proportion of individuals at a critical infection level decreases to 13.7%.
The results highlight that demand-related restrictions have a stronger effect on the infection rate. Although capacity restrictions are essential parts of containment strategies, they are not necessarily enough to minimize the negative impact of an outbreak situation. Finally, combining transit system-related measures with demand-reducing decisions can maximize the reduction in infected individuals.
Identifying critical components
Bota et al.29 proposed a methodology for identifying the most critical bus trips responsible for spreading disease among passengers. Here we follow the same approach by taking the average infection probabilities for all passengers on a particular vehicle trip to estimate the likelihood of transporting infected passengers. From another perspective, this gives us an estimate of the probability of getting infected if a passenger uses that specific vehicle trip. To calculate the most critical parts of the system, we take the top 100 vehicle trips based on this metric, according to the highest infection likelihoods.
Since we are interested in measuring the impact of the scenarios on the epidemiological risk associated public transportation system components, we took a slightly different approach. Instead of focusing on individual vehicle trips, we evaluated a similar likelihood of infection at the transit route level as a whole (i.e., any vehicle traveling on a particular route within a 24-hour time-frame). In the following part of the paper, we summarize the results for the top 10 most critical bus routes identified using this approach.
Figure 7 shows the most critical bus routes and the regions they connect. As shown, these transit routes are located in different parts of the Bay Area region, and most of them connect different counties or cities. However, there are other routes, for example, cccta_206A, operated by the Central Contra Costa Transit Authority, or sf_muni_39, which operates within San Francisco. The most critical routes include the connection between Fremont and Palo Alto, Richmond and Vallejo, Vallejo and Fairfield, or Berkeley and San Leandro. If passengers use these routes, the likelihood of getting infected is higher than 90% for baseline scenario. In the rest of this section, we evaluate how the different demand and vehicle capacity-related restrictions affect these routes.
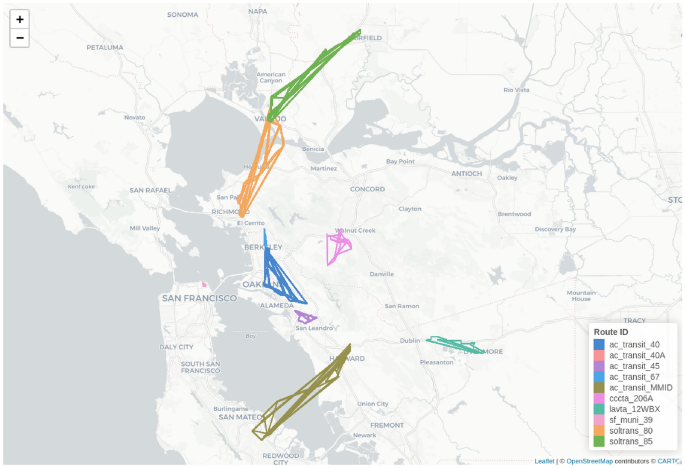
Critical regions in the transit system. Figure created with R version 4.1.2 https://cran.r-project.org/bin/windows/base/old/4.1.2/, using leaflet 2.2.2 https://cran.r-project.org/package=leaflet. The base tile layer was downloaded from OpenStreetMap (CC BY-SA 2.0; https://www.openstreetmap.org/copyright).
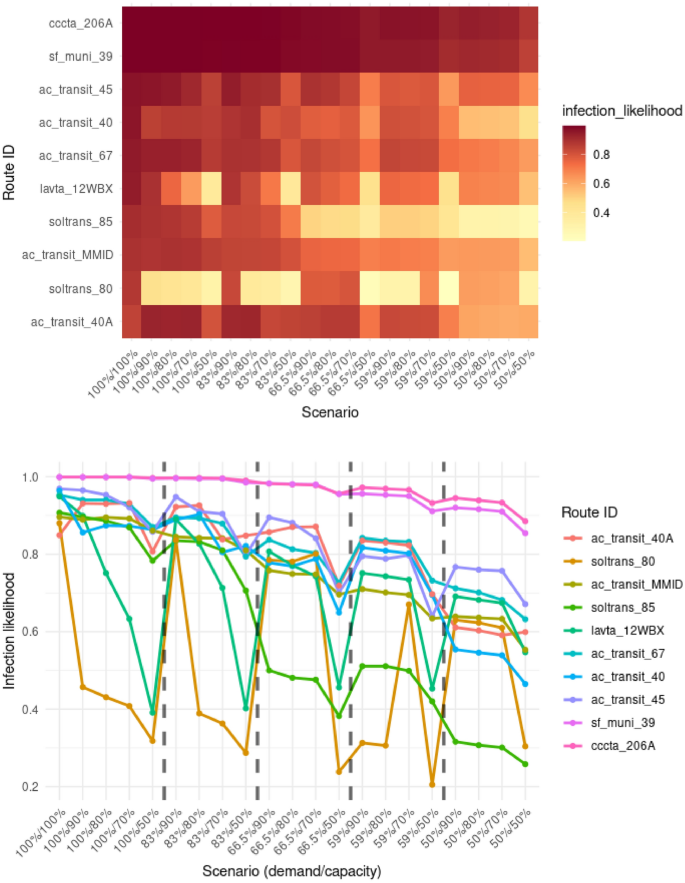
Effect of different scenarios for the top 10 most contagious vehicles. The x-axis shows the demand and capacity percentages of the different scenarios. Dashed lines separate scenario groups with differing levels of transit demand.
Figure 8 shows the changes in the expected likelihood of infection across varying scenarios with different vehicle capacities and reduction in travel demand. It can be seen that the probability of infection decreases with reduced transit demand for all identified routes. Among the top 10 routes, two types of patterns can be observed. The first pattern involves routes, such as in the case of sf_muni_39 or cccta_206A, where the likelihood of infection decreased slightly for the different scenarios. However, interesting trends can be observed in the rest of the routes, especially the soltrans_80 route that connects the cities of Fairfield and Vallejo, and lavta_12WBX operated by the Wheel public bus service in the Tri-Valley region. We can spot the drastic impact of vehicle capacities on the likelihood of infection for these routes. There is a 50–70% decrease in the probability of expected infection specifically due to restrictions in vehicle capacity. In some cases, demand-related changes did not impact the route-related risks. In other cases, these restrictions were effective in reducing disease-related dangers. Results show that some routes react differently to the various types of restrictions, highlighting the importance of combining multiple measures. This strategy will balance the reduction effect in the different parts of the system.