On February 6, 2023, a devastating Mw 7.8 earthquake struck southeastern Turkey, at 01:17 UTC. The epicenter located in Pazarcık, Kahramanmaraş Province (37.288°N, 37.043°E) with a hypocenter depth of 10 km, according to the Turkish Disaster and Emergency Management Authority (AFAD; https://tadas.afad.gov.tr/). The US Geological Survey (USGS) positioned the Pazarcık earthquake’s epicenter at 37.226°N, 37.014°E, with its hypocenter depth of 10 km, and moment magnitude Mw of 7.81. According to the Global GMT determinations, the Pazarcık earthquake’s epicenter at 37.226°N, 37.014°E, with a hypocenter depth of 15 km and Mw of 7.82. Seismic moment tensor solutions from mentioned institutions (AFAD, USGS, and Global CMT) consistently indicate that the Pazarcık event was strike-slip earthquakes. Most of Turkey’s territory is located on the Anatolian fault zone within the Eurasian seismic belt, where this zone is caught in a complex tectonic interaction between the Eurasian, African, and Arabian plates. The Anatolian fault zone is structurally demarcated by two zones: one is the dextral strike-slip Northern Anatolian Fault Zone (NAFZ) lied on northern of Turkey, extending approximately 1500 km in an east–west orientation, another is the sinistral strike-slip Eastern Anatolian Fault Zone (EAFZ) lied on southeastern of Turkey, spanning 550 km along northeast direction (Bozkurt, 2001)3. Historically, Turkey’s significant seismic events have predominantly occurred along the NAFZ and EAFZ (Zare et al., 2014)4. The 2023 Pazarcık earthquake ruptured the southwestern segment of the EAFZ, a complex fault system comprising multiple parallel, sub-parallel, and oblique faults, with rupture extending along a northeast-southwest orientation. The EAFZ represents one of Turkey’s most seismically active regions, having generated numerous destructive historical earthquakes including: the 8.0-magnitude Erzincan earthquake in 1939, the 7.1-magnitude Elmalıdere-Bingol earthquake in 1949, the 6.8-magnitude Erzincan earthquake in 1992, the Mw 6.7-Doganyol earthquake in 2020, and so on. According to the Middle East seismic hazard zonation map (Sesetyan et al., 2018)5, peak ground acceleration (PGA) on bedrock sites (VS30 > 800 m/s) reach maximum levels of 0.5 g and 1.0 g for 475-y (10% probability of exceedance in 50 years) and 2475-y (2% probability of exceedance in 50 years) return periods, respectively, representing the region’s highest seismic hazard levels. The 2023 Pazarcık earthquake, followed by the Elbistan earthquake nine hours later, caused widespread destruction across 11 provinces, with 55% of buildings being damaged or collapsing in Kahramanmaraş, and 58% of buildings being damaged in Hatay (Tao et al., 2023)6. A significant proportion of building collapses in quake-affected regions can be attributed to structures designed according to outdated seismic codes (Erdik et al., 2023; Turner, 2023)7,8. Approximately 97% of the collapsed buildings were constructed prior to seismic code update in 1997 (Binici et al., 2023)9. Numerous of strong-motion recordings during the Pazarcık earthquake were obtained by the Engineering Strong Motion (ESM) database.
Sichuan province located in southwestern China situated on the Eurasian seismic belt, experienced a devastating Mw 7.9 earthquake in Wenchuan country (31.021N, 103.367E) on May 12, 2008, hypocenter depth of 14 km. The 2008 Wenchuan earthquake occurred on the Longmenshan Fault Zone, with a reverse-slip earthquake (USGS). This fault zone extends along the edge of the Sichuan Basin from northeast to southwest, exhibiting a NE-SW strike orientation. The Wenchuan event resulted in numerous structural collapses across 14 severely damaged counties or cities, attributable to large magnitude, and shallow focal depth. Remote sensing analysis of post-seismic building collapse distribution reveals catastrophic collapse rates exceeding 90% in Yingxiu and Beichuan towns, both located within the near-field region of the epicenter. Otherwise, Significant building collapses were also documented in the urban areas of Mianzhu, Shifang, and Pengzhou cities, where over 60% of structures failed in multiple surrounding towns and villages (Lei et al., 2010)10. The National Strong-Motion Observation Networks System (NSMONS) in China, obtained a larger numbers of strong motion recordings during the Wenchuan earthquake.
Ground motion prediction equations (GMPEs) incorporate key parameters as predictor variables, including magnitude, distance, style-of-faulting, site class. However, the GMPEs adopted for China’s seismic zoning map, were developed by the NGA-West2 and NSMONS databases, but their predictor variables do not include fault type. China is located at the intersection of the circum-Pacific and Eurasian seismic belts, active crustal movement results in frequent earthquakes. Since the twentieth century, China has experienced multiple devastating earthquakes, e.g., the 7.9-magnitude Wenchuan in 2008, the 8.1-magnitude Kunlunshan in 2001, the 7.8-magnitude Tangshan in 1976, the 8.0-magnitude Gulang in 1927, the 8.5-magnitude Haiyuan in 1920, and so on. Operational since the end of 2007, the NSMONS has captured strong-motion records for only a single M ≥ 7.5 event: the 12 May 2008 Wenchuan earthquake. Both Turkey and China are situated along the Eurasian seismic belt. The 2023 Pazarcık earthquake (strike-slip, Mw7.8) and 2008 Wenchuan earthquake (reverse-fault, Mw 7.9) exhibited comparable magnitudes but different fault types. Comparative analysis of their ground-motion intensity measures (IMs) difference provides valuable insights into large-magnitude ground-motion characteristics across different fault types, while providing essential references for future revisions of ground motion prediction equations (GMPEs) in China’s seismic zonation map. Therefore, in this study, the IMs of ground motion were calculated for both earthquakes, such as PGA, PGV, PSAs, significant duration (5–95%), Arias intensity and Newmark displacement, to analyze ground motion characteristics based on the predicted values from GMPEs.
Recordings and site conditions
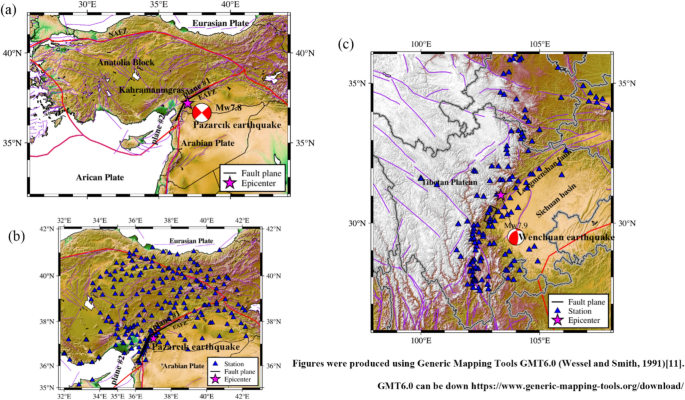
In this study, a total of 227 processed strong-motion recordings from the Pazarcık earthquake in the ESM database were used, with Joyner–Boore distance (RJB) ranging from near-fault to 400 km (last accessed March 2023). The RJB values were calculated by the USGS-inverted rupture plane. Figure 1a,b show two dominant fault planes. The fault plane #1 extended approximately 180 km along a 60.0° strike direction, and the fault plane #2 propagated roughly 170 km along a 25.0° strike orientation. Figure 1b displays the positions of 227 used stations with RJB < 400 km.
(a) The epicenter and rupture faults (black lines) of the geographical location for the Pazarcık earthquake; The map was generated using Generic Mapping Tools (version 6.0, https://www.generic-mapping-tools.org/download/)11; (b) Shows the strong-motion stations used in the Pazarcık earthquake for RJB < 400 km; (c) Shows the strong-motion stations used in the Wenchuan earthquake for RJB < 400 km.
For comparison with the 2023 Pazarcık earthquake, 149 strong-motion recordings (RJB < 400) from the 2008 Wenchuan earthquake (Fig. 1c) were used to investigate ground motion differences between the two events. All recordings were filtered using a Butterworth Bandpass filter (0.01–35 Hz). Figure 2a shows the RJB distributions of strong-motion recordings considered for both earthquakes. The majority of strong-motion recordings were acquired at stations with RJB > 80 km for both events. Only 54 of 227 recordings from Pazarcık earthquake, and 30 of 149 recordings from Wenchuan earthquake obtained at stations RJB < 80 km. There are 12 stations at RJB = 0 km from the Pazarcık earthquake, and shows the square at RJB = 1.0 km on the vertical axis in figure. Figure 2b displays histograms of the VS30 distributions for strong-motion stations used in this study during Pazarcık and Wenchuan earthquakes. The VS30 distributions at stations are similar for both earthquakes, with the majority of their VS30 values ranging within 600 m/s. For the Pazarcık earthquake, VS30 values for 99 strong-motion stations were obtained directly from the ESM database, while the remaining 128 stations of VS30 values estimated based on topographic slope. For the Wenchuan earthquake, VS30 values for 97 strong-motion stations were obtained from the Western China site Flatfile (Xie et al., 2022)12, while the remaining 52 stations VS30 values were estimated using the Chinese site classification by Ji et al. (2017)13 HVSR method and topographic slope. The Wenchuan earthquake recordings were processed using a Butterworth bandpass filter with a range of 0.01–35 Hz.
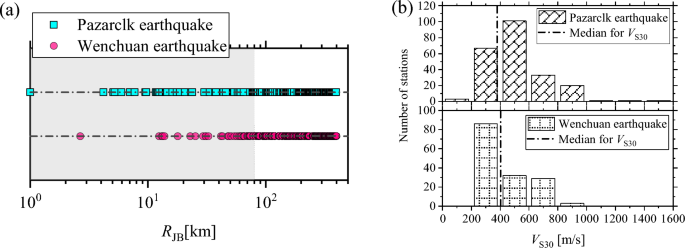
(a) Joyner–Boore distance (RJB) distributions for the 227 recordings in the Pazarcık earthquake, and 149 recordings in the Wenchuan earthquake. The square symbol at RJB = 1.0 km on the vertical axis signifies the 12 recordings from stations with RJB = 0 km in the Pazarcık earthquake. (b) Histograms of VS30 distributions for strong-motion stations in Pazarcık and Wenchuan earthquakes. The black dash-dotted lines represent the medians VS30 values for strong-motion stations considered in each earthquake.
Analysis of recorded data
Figure 3 illustrates the observed IMs, total residuals (Res) and their stacked column, for PGA and PSAs with periods at T = 0.5 s, 2.0 s, and 5.0 s in Pazarcık and Wenchuan earthquakes. Additionally, the figure includes the predicted medians from one of global NGA-West2 GMPE developed by Boore et al. (2014; hereafter, BSSA14)14. The BSSA14 model was developed by global strong-motion recordings, including from Turkey, China and other regions. To distinguish regional variations in crustal medium, the BSSA14 incorporated anelastic attenuation adjustment coefficientΔc3, calculated by linear regression between within-event residuals and Joyer-Boore distance. Both Turkey and China were assigned the same regional adjustment coefficientΔc3 in this model. Therefore, the BSSA14 model is adopted in this study, and its constraints are as follows: the magnitude range of Mw = 3 to 8.5 for both strike-slip and reverse-slip earthquakes, the RJB ranges from 0 to 400 km, the VS30 from 150 to 1500 m/s, and the basin depth Z1.0 ranges from 0 to 3.0 km. In the calculations of predicted medians, site conditions were characterized using VS30 = 484 m/s for the Pazarcık earthquake (the median of all used stations in this event) and VS30 = 379 m/s for the Wenchuan earthquake. The parameter ZTOR in the BSSA14 model represents depth to top of rupture, we adopted ZTOR = 0 km in this study. The regional adjustment of anelastic attenuation for both Turkey and China were considered. Moreover, basin effects were excluded from the predicted medians. It is worth noting that the predicted medians cannot reflect actual predictions at each site location, since the site effects represented by constantVS30 values. The utilization of predicted medians was used as a reference to highlight the disparities in PGA and PSAs observed between the two events.
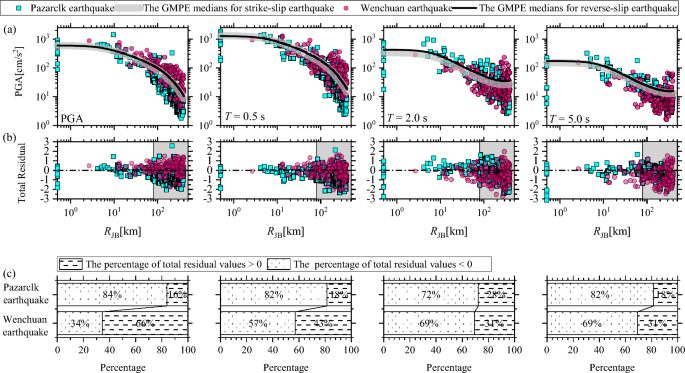
(a) Observed peak ground acceleration (PGA) and 5%-damped pseudo-spectral accelerations (PSAs) at periods T = 0.5, 2.0, and 5.0 s for Pazarcık earthquake and Wenchuan earthquake. The thick grey lines represent the medians predicted by BSSA14 models for Pazarcık earthquake triggered on a strike-slip fault, where the VS30 value is 484 m/s. The black solid lines represent the medians predicted by BSSA14 models developed for Wenchuan earthquake triggered on a reverse-slip fault, where the VS30 value is 379 m/s. (b) Total residuals were computed using the actual VS30 values for each event and site. (c) The selected data as a (horizonal) 100% Stacked Column Graph of the total residuals (i.e. Values of total residual below zero and above zero) were listed.
For the PGA from the Pazarcık earthquake, they decline at a faster than the predicted medians, whereas those for the Wenchuan earthquake is consistent with predicted medians. Similarly, for PSA at T = 0.5 s, the Pazarcık earthquake decays faster than predicted, while the Wenchuan earthquake follows the predicted trend. Additionally, the observed PSA at periods T = 2.0 s and T = 5.0 s for both earthquakes decays more rapidly than predicted medians (Fig. 3a). The total residuals for two events were obtained by the actual VS30 at each station, and calculated by the observed values minus the predicted medians from the GMPEs on the natural logarithmic scale, as illustrated in Fig. 3b. The most of Res values for PGAs in Pazarcık earthquake were negative at RJB > 80 km, while positive result is observed for Wenchuan earthquake. For PSA at T = 0.5 s, Res values at RJB > 80 km were negative for the Pazarcık earthquake, while the Wenchuan event showed no significant deviation. For PSAs at periods T = 2.0 s and T = 5.0 s, the most of Res values were positive for both earthquakes with RJB exceeding 80 km. Figure 3c displays the percentage distribution of positive and negative Res values at RJB > 80 km, consistent with the result observed in Fig. 3b. In the Pazarcık earthquake, positive Res values accounted for 16% (PGA), 18% (T = 0.5 s), 28% (T = 2.0 s), and 18% (T = 5.0 s), with corresponding negative values of 84%, 82%, 72%, and 82%. In contrast, the Wenchuan earthquake exhibited higher positive Res values percentages: 66% (PGA), 43% (T = 0.5 s), 31% (T = 2.0 s), and 31% (T = 5.0 s), with negative percentages of 34%, 57%, 69%, and 69%, respectively. Therefore, these results reveal period-dependent differences in ground motion characteristics between the two earthquakes.
The between-events residuals (δBe) reflect the source characteristics, and are calculated by averaging the total residuals for individual earthquakes. The total residuals for both earthquakes show significant deviations at RJB > 80 km. To eliminate the deviations of the δBe, and more reality reveal the source discrepancy between the Pazarcık earthquake and Wenchuan earthquake, a linear model f(R) (Eq. 1) was regressed on the relationship between Res and RJB:
$$R_{es} = cR_{{{text{JB}}}} + sigma$$
(1)
where c is a trend-adjusted coefficient, and σ is the total standard deviation. Then, the corrected δBe values were obtained by subtracting the trend-adjusted residuals from the original residuals. Earthquake magnitude serves as a fundamental parameter for ground motion interpretation. The M or Mw scale was derived from seismic moment using Southern California earthquake data, but it has not been adequately validated for magnitudes less than 7.5 outside that region. Recent studies also highlight that the M or Mw scale tends to overestimate radiated energy for smaller to moderate-magnitude earthquakes below 7.5. The detailed limitations are discussed in Das and Das (2025)15. To address these shortcomings, the Das magnitude scale Mwg was proposed16. To better compare the source effects of the Pazarcık and Wenchuan earthquakes, we calculated another magnitude scale Mwg for both events using seismic moment (M₀) from the Global Centroid Moment Tensor database2. The results yield an Mwg of 7.8 for the 2008 Wenchuan earthquake and 7.7 for the 2023 Pazarcık earthquake. These corrected δBe values for both Mw and Mwg were used to comparative analysis between two earthquakes, as shown in Fig. 4.
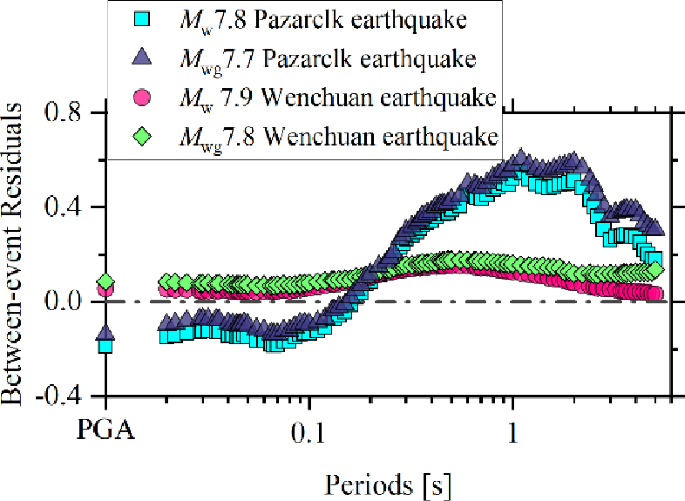
The corrected between-events residuals δBe for PGAs and PSAs at T = 0.2 s–5.0 s between the Pazarcık earthquake and the Wenchuan earthquake using both Mw and Mwg, based on the GMPEs developed by Boore et al. (2014)14, respectively.
Figure 4 shows significant difference for the corrected δBe values between these two earthquakes. For the Pazarcık earthquake, the corrected δBe values for both Mw and Mwg are negative values at periods of < 0.2 s, whereas positive values at periods of > 0.2 s, indicating overprediction of the source effects in short-period ground motion for BSSA14 model, but underprediction on intermediate- and long-period ground motions. The δBe values for Mw are slightly higher than those of Mwg at periods of < 0.2 s, while the opposite trend occurs at longer periods. The result indicates that the Mwg scale matches the average source effect from BSSA14 more closely at short periods, demonstrating its better consistency with high-frequency ground motion. This behavior aligns with the expected performance of the proposed Mwg scale15. For the Wenchuan earthquake, all the corrected δBe values for both Mw and Mwg are positive, indicating underpredictions of the source effects in ground motion across all periods for BSSA14 model. The δBe values for Mw show slightly differences from those for Mwg at periods of < 1.0 s, while the larger discrepancies emerge at periods of > 1.0 s. The corrected δBe values for Pazarcık earthquake was larger than those of the Wenchuan earthquake at T > 0.2 s, but smaller for both PGA and PSAs at T < 0.2 s. The result may be attributed to the different rupture styles between two earthquakes: strike slip for the Pazarcık earthquake and reverse slip for the Wenchuan earthquake. Furthermore, the fault slip distribution of the Pazarcık earthquake was concentrated near the ground surface, whereas the Wenchuan event occurred deeper location (at a depth of ~ 10 km) (USGS). The shallower depth of the Pazarcık earthquake may generate greater surface waves in longer periods. Similar result was found for 2013 M7.0 Lushan strike-slip earthquake and 2017 M 7.0 Jiuzhaigou reverse-slip earthquake (Ren et al. 2018)17,18.
Seismic amplitude characteristics
PGA and PGV
In this section, the seismic amplitude parameters were calculated to investigate ground motion differences between Pazarcık earthquake and Wenchuan earthquake. First, we established empirical relationships between PGA and PGV for both the Pazarcık and Wenchuan earthquakes separately, with regression results presented in Table 1. The Pearson correlation coefficients are 0.917 (Pazarcık event) and 0.782 (Wenchuan event), indicating strong correlation for both earthquakes. Figure 5a shows the distribution of PGA and PGV during the two earthquakes. To ensure consistent comparison, only recordings with PGA exceeding 5 cm/s2 were considered for both earthquakes. The two solid lines in figure represent the PGA and PGV thresholds corresponding to intensity IX according to the China Earthquake Intensity Scale (GB/T 17742, 2008)19; equivalent to modified Mercalli intensity [MMI] IX), with values of 354 cm/s2 and 36 cm/s, respectively. Above the PGA threshold corresponding to Chinese Intensity IX, the Wenchuan earthquake show generally comparable amplitudes to the Pazarcık earthquake, though with fewer available recordings. However, PGV distributions for Chinese Intensity IX reveals that the Wenchuan earthquake exhibited both lower amplitudes and fewer recordings compared to the Pazarcık event.
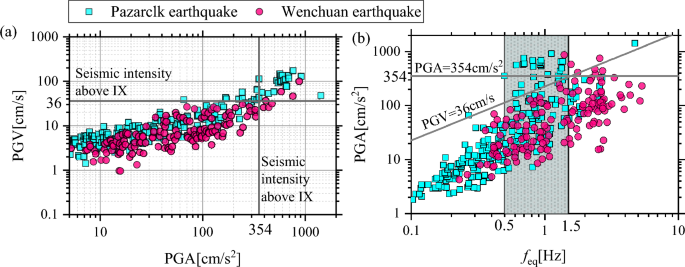
(a) The observed PGAs versus PGVs were compared for Pazarcık earthquake and Wenchuan earthquake. The horizontal solid line represents the PGV threshold corresponding to Chinese earthquake intensity scale IX. The vertical solid line represents the PGA threshold corresponding to Chinese earthquake intensity scale IX; (b) The PGAs and the equivalent predominant frequency feq were compared for Pazarcık earthquake and Wenchuan earthquake. The horizontal solid line represents the PGA threshold corresponding to Chinese earthquake intensity scale IX. The oblique solid line represents the PGV threshold corresponding to Chinese earthquake intensity scale IX.
The equivalent dominant frequency (feq), denoted as PGA/(2·π·PGV), is an important indicator for measuring the relationship between ground motion and structural damage. The feq is obtained by discrete Fourier transform with assumption of ground motion’s sine or cosine characteristics, which was employed to reasonably elucidate the structural damage during the Mw 9.0 earthquake in Japan (Kawase, 2011)20. Therefore, in order to investiage the influence differences of ground motion on structural damage between Pazarcık and Wenchuan earthquakes, the feq were calculated for both events.
Figure 5b presents the distribution of PGV and feq for both earthquakes. The urban residential buildings in the Pazarcık earthquake-affected area are mainly multi-storey frame structure and small high-rise reinforced concrete frame structure and frame supported shear wall structure. In Wenchuan earthquake-affected areas, the predominant building types consisted of reinforced concrete frame structures, brick-concrete structures, and bottom-frame structures, with most structures ranging from 3 to 10 floors. The shaded area in the figure represents the structural natural frequency range (0.5 ~ 1.5 Hz) of the primary buildings in both earthquakes affected area. The ground motions between the two earthquakes exhibit significant differences in seismic amplitude characteristics. Within frequency range of 0.5 ~ 1.5 Hz, many PGA and PGV for Pazarcık earthquake exceeded the thresholds, corresponding to Chinese earthquake intensity scale IX, whereas only one recording from Wenchuan earthquake surpassed these thresholds. Such many recordings for Pazarcık earthquake exceeded the Chinese Intensity IX thresholds within the structure natural frequency range of in affected area, indicating that its ground motions have greater impact on structures damage compared to Wenchuan event.
Arais intensity
The Arias intensity (Ia), derived by integrating squared accelerations time history, reflects the energy content of the recorded signal (Arias, 1970)21. Given its critical role in evaluating seismic potential destructiveness (landslide, soil liquefaction, and structural damage), many researchers have established on the GMPEs of Arias intensity (Travasarou et al., 2003; Stafford et al., 2009; Lee et al., 2012; Li et al., 2017)22,23,24,25. This study analyzes the differences in Arias intensity between the Pazarcık and Wenchuan earthquakes, through comparing with a predictive model estimated by Li et al. (2017, hereafter, LYX17)25. The LYX17 model was adopted because it was developed using strong-motion recordings from earthquakes in Western America, and Central Asia from the NGA database, its continental tectonic environment is similar to that of China. The predictor variables in LYX17 model include moment magnitude Mw, rupture distance RJB, site type and fault type, as follows the Eq. 2:
$$begin{gathered} log_{10} I_{a} = – 1.073 – 2.494log_{10} [R_{{{text{JB}}}} + 0.956exp (0.462M_{w} )] hfill \ , + 0.715M_{w} – 0.262S_{A} + 0.099S_{C} + 0.089V hfill \ end{gathered}$$
(2)
where Ia represents Arias intensity, with application limits of RJB not exceeding 200 km and the Mw range from 5.5 to 8.0. The two dummy indicators SA and SC classify site categories as follows: SA = 1 and SC = 0 for bedrock site; SA = 0 and SC = 0 for hard site; SA = 0 and SC = 1 for soft site. The site classification follows these VS30 criteria: bedrock site with VS30 > 500 m/s, hard site VS30 ranging from 250 to 500 m/s, and soft site VS30 < 250 m/s. A dummy variable V is used to represent the fault type: V = 1 represents reverse faults, and V = 0 represents all other fault types. Figure 6 shows a comparison between observed Ia values from the Pazarcık and the Wenchuan earthquakes, and their corresponding predicted medians using Eq. 2. According to the above-described, the median VS30 values are determined to be 484 m/s for the Pazarcık earthquake and 379 m/s for the Wenchuan earthquake. Consequently, the hard site condition (SA = 0, SC = 0) was employed to estimate the predicted medians in this analysis.
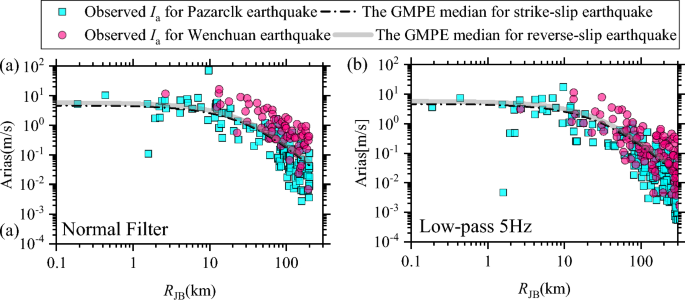
(a) The observed Arais intensity were compared in the Pazarcık earthquake and Wenchuan earthquake, compared with prediction mean by the Li et al. (2017)25, respectively; (b) The reprocessed strong-motion recordings of Arais intensity, using a low-pass filter with a 5 Hz cut-off frequency, were compared in the Pazarcık earthquake and Wenchuan earthquake, compared with prediction mean by the Li et al. (2017)25, respectively.
In Fig. 6a, for the Pazarcık earthquake, the observed Ia values show good agreement with the predicted medians by the LYX17 model at RJB < 80 km. However, most observed Ia values are lower than the predicted ones when RJB exceeds 80 km. For the Wenchuan earthquake, nearly all observed Ia values exceed the predicted medians. Wenchuan earthquake exhibits significantly greater deviations from the predicted mean compared to the Pazarcık earthquake. We reprocessed the strong-motion recordings for both earthquakes using a low-pass filter with a 5 Hz cut-off frequency to remove high-frequency components. Figure 6b presents a comparison between the reprocessed Ia values for both events, and their corresponding predicted medians. The reprocessed Ia values for the Wenchuan earthquake demonstrate significantly reduced deviations from the predicted medians, indicating its ground motions contain relatively abundant high-frequency components. This result may be attributed to the different styles of fault rupture, that is, strike slip for the Pazarcık earthquake and reverse slip for the Wenchuan earthquake. The Δσ, a fundamental source parameter plays a critical role in characterizing earthquake physics and seismic hazard assessment, and closely linked to the amplitude of high-frequency (short-period) ground motion. The previous studies (Mohammadioun, 2002; McGarr, 2002)26,27 showing that the Δσ for reverse-slip earthquakes is greater than that of strike-slip earthquakes, due to the reverse-slip event in focal mechanism having larger in friction strength and shear stress. Hence stress drop (Δσ) is probably another attribution.
As well known as, the PGA serves as a critical indicator for assessing earthquake-induced building damage, demonstrating strong correlation with structural damage characteristics. Consequently, the PGA is currently the most widely used ground motion parameter in code for seismic design of buildings. However, the PGA has significant limitations when employed to assess seismically-induced secondary disasters such as landslides or liquefaction. The Arias intensity, calculated by integrating the square of acceleration time histories, captures the frequency content, duration, and amplitude characteristics of ground motion. This parameter serves as a reliable indicator for assessing earthquake-induced landslides and liquefaction potential. Therefore, investigating the correlation between Arias intensity and PGA is crucial for utilizing the conversion methods between ground motion parameters in predicting seismic secondary disasters. Previous studies have investigated the correlation between Arias intensity and PGA, establishing empirical relationships between these parameters (Arias, 1970; Jibson, 1993; Romeo, 2000: Liu et al., 2015.2016)21,28,29,30,31. The two prediction models were selected to investigate the ground motion differences for PGA and Ia between the two events. One of the prediction models derived by Romeo (2000)29 was used in this study (Eq. 3), which is only the correlation relationship between PGA and Ia.
$$I_{a} = 0.04PGA^{1.668}$$
(3)
Previous studies (Chousianitis et al., 2014and Sokolov and Wenzel, 2013)32,33 have demonstrated that the Ia are significantly influenced by source and site effects. Another prediction model derived by Liu et al. (2016)31 was adopted in this study, which incorporates moment magnitude Mw, and site condition VS30, as predictor variables (Eq. 4).
$$log (I_{a} ) = a + blog (PGA) + c(M_{W} – 6) + dlog (V_{30} /500)$$
(4)
in which Ia is independently for each horizontal component, a, b, c and d is regression coefficients. Figure 7a presents the observed PGA and Ia values for both Pazarcık and Wenchuan earthquakes, demonstrating a strong correlation between these two parameters. The values observed for two earthquakes mostly surpass the predicted medians from two models, a larger discrepancy observed for Eq. 3 that does not incorporate magnitude and site conditions. Subsequently, the total residuals were computed for Pazarcık and Wenchuan earthquakes, based on the Eqs. 3, 4. Most total residuals and their Error bars for both earthquakes exceeded zero (Fig. 7b–e), indicating underprediction by both equations. Additionally, observed that the Wenchuan earthquake displayed higher error bars compared to the Pazarcık event. Error bars for both earthquakes from Eq. 3 (without accounting for magnitude and site conditions) exhibits the decreasing trend with increasing VS30 (Fig. 7d), indicating the site-dependence of PGA and Ia. In contrast, Error bars for both earthquakes from Eq. 4 (incorporates magnitude and site conditions) shows a flat trend (Fig. 7e).
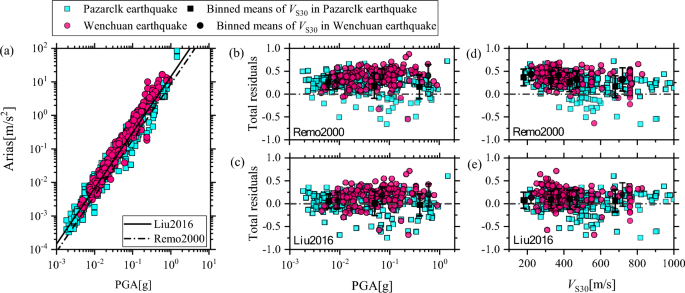
(a) The observed Ia and PGA values for the Pazarcık and Wenchuan earthquakes were compared with the median predictions estimated by Remo (2000)29 and Liu et al. (2016)31; (b) The total residuals plotted against PGA for the Pazarcık and Wenchuan earthquakes, based on Eq. 3 from Romeo (2000)29; (c) The total residuals versus RJB for the Pazarcık and Wenchuan earthquakes based on Eq. 4 from Liu et al. (2016)31; (d) The total residuals versus VS30 for the Pazarcık and Wenchuan earthquakes based on Eq. 3 from Romeo (2000)29. VS30-binned means with one standard deviation error bars are plotted for each earthquake; (e) The total residuals versus VS30 for the Pazarcık and Wenchuan earthquakes based on Eq. 4 from Liu et al. (2016)31, VS30-binned mens with one standard deviation error bars for each earthquake.
The strong motion duration
Significant duration—defined as the time interval between specific percentage thresholds of Arias intensity (Trifunac and Brady, 1975)34– is widely adopted as one of duration measures in engineering applications. The D5-95 (the time interval between 5 and 95% of cumulative Arias intensity) was computed for both the Pazarcık and Wenchuan earthquakes in this study. The observed D5-95 values for the Pazarcık and Wenchuan earthquakes were compared, as illustrated in Fig. 8a. Most D5-95 values for the Wenchuan earthquake (reverse-slip fault) were significantly higher than those for the Pazarcık earthquake (strike-slip fault) at comparable rupture distances. Figure 8b displays the observed D5-95 ploted against VS30 for both the Pazarcık and Wenchuan earthquakes, revealing similar D5-95 values within comparable VS30 ranges for most D5-95 observed. In addition, the total residuals of D5-95 were analyzed using the GMPE model developed by Afshari and Stewart (2016, hereafter, AS2016)35. This model was derived using the NGA-West2 database (Ancheta et al., 2014)36, employing the geometric mean of two horizontal components. The AS2016 model has the following limitations for predictor variables: moment magnitudes Mw 3.0 to 8.0, focal mechanisms (normal, strike-slip, reverse-slip and Unkown), Rrup ≤ 300 km, and VS30 = 150 to 1500 m/s. Figure 8c,d present the total residuals and error bars for both earthquakes. The predominantly positive residuals indicate that the observed D5-95 exceed the regional averages predicted by the AS2016 model. The Wenchuan earthquake exhibits higher error bars than the Pazarcık event for both Rrup and VS30, suggesting that larger D5-95 for Wenchuan event. Such difference in Significant duration may be attributed to the different fault styles between the two earthquakes. The reverse-slip fault typically generates longer ground motion durations than the strike-slip fault with similar magnitude. Another factor may be rupture directivity. The Wenchuan earthquake featured unilateral rupture with a rupture length of approximately 300 km, whereas the Pazarcık earthquake exhibited bilateral rupture with a maximum length no more than 180 km (USGS). Significant duration reflects the energy accumulation process of ground motion, therefore, the observation may relate to rupture mechanisms. The Pazarcık earthquake exhibited both supershear and subshear rupture propagation (Ren CM, 2024; Jia Z et al., 2023; He L et al., 2023)37,38,39, with the extremely fast rupture velocity. Propagation efficiency of seismic waves is higher, and can release a large amount of energy within shorter intervals.
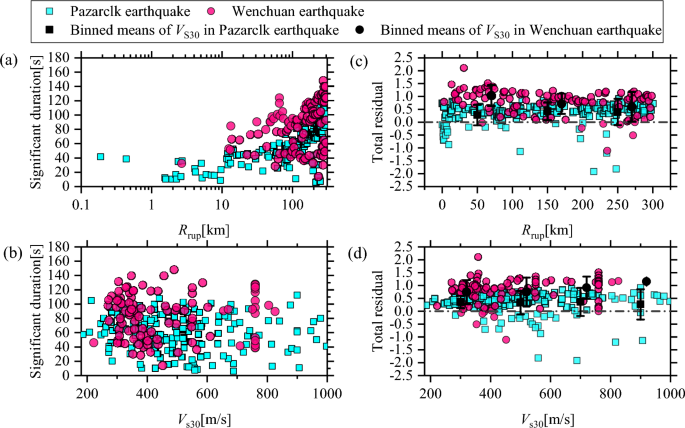
(a) The significant durations (5%-95%) calculated for the Pazarcık earthquake and Wenchuan earthquake against Rrup; (b) The total residual calculated for significant durations (5%-95%), based on the GMPE of Afshari and Stewart (2016)35 for the Pazarcık earthquake and Wenchuan earthquake against Rrup, respectively.
Newmark displacement
Earthquake-triggered landslides are one of most devastating secondary hazards. Prediction of their spatial distribution and triggering conditions is crucial for regional seismic landslide hazard assessment. Newmark (1965)40 proposed a rigid sliding block model to estimate coseismal slope displacement. This model treats the slope as a rigid block with a known critical acceleration, the acceleration required to overcome frictional resistance and begin sliding on the inclined plane. Since the slope is subjected to seismic acceleration time history, it is necessary to calculate cumulative displacement of block. The Newmark displacement is calculated through double integration of acceleration time history exceeding the critical acceleration. At present, many Newmark displacement prediction models have been developed (Jibson, 2007; Lee, 2008etc.)41,42. Most existing models formulate Newmark displacement as a function of critical acceleration and ground motion parameters, notably PGA or Arias intensity Ia. In this section, Newmark displacements were calculated for strong motion recordings from both Pazarcık and Wenchuan earthquakes, using four critical accelerations (0.02 g, 0.05 g, 0.10 g, and 0.2 g). All strong-motion recordings from both the Pazarcık earthquake (0.01–40 Hz bandpass filtered) and Wenchuan earthquake (0.01–35 Hz bandpass filtered), processed using Butterworth filters. Figure 9 presents the relationship between Newmark displacement and PGA for both Pazarcık and Wenchuan earthquakes. Both earthquakes exhibit a nonlinear relationship in logarithmic coordinates between Newmark displacement and PGA at each critical acceleration. However, the Pazarcık earthquake shows larger scatter.
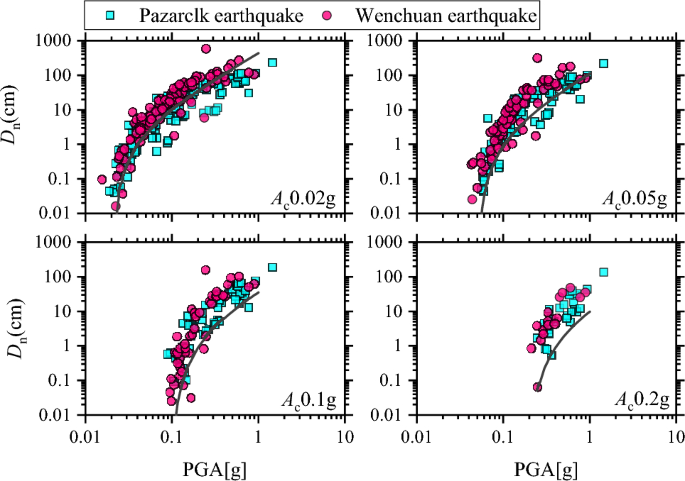
Observed Newmark displacement and PGAs at critical acceleration of 0.02, 0.05, 0.1 and 0.2 g for Pazarcık earthquake and Wenchuan earthquake, respectively. The black solid lines represent the Newmark displacement predicted medians developed by Jibson 200741.
The Newmark displacement prediction models developed by Jibson 200741 were used in this study, which expresses displacement as a function of critical acceleration and PGA, as following the Eq. 5:
$$log D_{n} = 2.510 + log [(1 – frac{{A_{c} }}{PGA})^{2.341} (frac{{A_{c} }}{PGA})^{ – 1.438} ] pm 0.510$$
(5)
where Dn is Newmark displacement in centimeters, Ac is critical acceleration (ranging from 0.02 to 0.4 g), and the predicted medians were shown in Fig. 9. As shown in the figure, as the critical acceleration increases, the discrepancy between the Newmark displacement and the predicted medians become more pronounced for both two earthquakes. At a critical acceleration of 0.02 g, the Newmark displacement values for the Pazarcık earthquake are in good agreement with the predictive medians, while the most values for Wenchuan earthquake are greater. At critical accelerations of 0.05 g and 0.1 g, almost all Newmark displacement values for both earthquakes are larger than the predicted medians. Newmark displacements are apparently greater than the predicted medians for both events, as the critical acceleration of 0.2 g. This phenomenon suggested that the Newmark displacement of both earthquakes exceed the averages predicted by Jibson’s (2007) model41 at critical acceleration values of 0.05, 0.1, and 0.2 g, and exhibits a dependence on critical acceleration dependence.
The Arias intensity has been proven to be a reliable indicator of earthquake-induced slope instability (Harp and Wilson, 1995)42 Therefore, many researchers have adopted Arias intensity for estimating seismic Newmark displacement. Unlike PGA, which only reflects the intensity at a single point within an acceleration time history, Arias intensity integrates the entire acceleration time history, thereby providing a more comprehensive characterization of ground motion (Rathje and Saygili, 2008; Hesieh and Lee, 2011)43,44. Research on earthquake-induced landslide susceptibility (Lee et al., 2008)45 reveals a strong correlation between landslide and Arias intensity. Consequently, Arias intensity is deemed superior to other ground motion parameters for landslide hazard assessment. Figure 10 compares the observed Newmark displacements under four critical accelerations for both earthquakes, with the predicted displacement medians by the global empirical model of Hsieh and Lee 201144. The model describes the relationship between Newmark displacement and Arias intensity at the constant critical acceleration, as expressed by the following equation.
$$log D_{n} = 0.847log I_{a} – 10.62A_{c} + 6.587A_{c} log I_{a} + 1.84$$
(6)
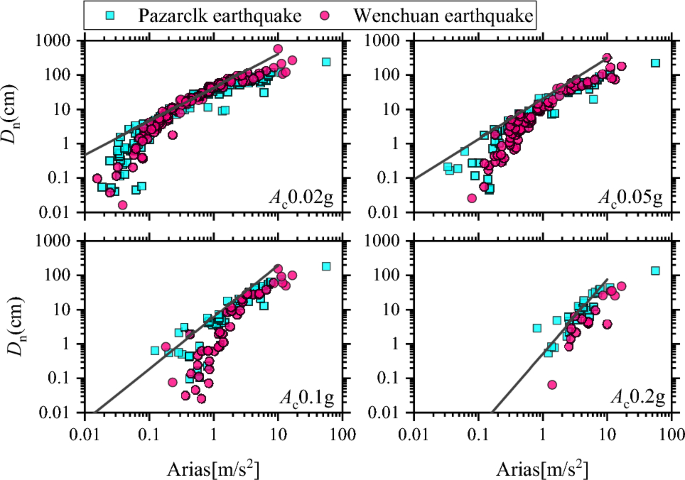
Observed Newmark displacement and arias intensity at critical acceleration with 0.02, 0.05, 0.1 and 0.2 g for Pazarcık earthquake and Wenchuan earthquake, respectively. The black solid lines represent the predicted Newmark displacement medians developed by Hsieh and Lee in 201144.
in which Dn is Newmark displacement in centimeters, Ia represents Arias intensity, and Ac denotes critical acceleration (ranging from 0.02 to 0.3 g). Observed that Newmark displacement values for Pazarcık earthquake exhibits increasing dispersion with decreasing Arias intensity, at Ac of 0.02 g, 0.05 g and 0.1 g. At Ac = 0.02 g, the observed Dn values for Pazarcık and Wenchuan earthquakes show good agreement with the empirical model at a range of Ia from 0.2 to 1.3 m/s, while the remaining observed Dn values fall below the predicted medians. Almost observed Dn values fall below the predicted median at the Ac is 0.05 and 0.1 g. At Ac = 0.2 g, the observed Dn values for Pazarcık earthquake show a good match with the predicted medians, whereas all observed Dn values for Wenchuan earthquake are below the predicted medians. The result indicates that the Dn values of both earthquakes were consistently lower than the averages predicted by Hsieh and Lee in 201144 model at four critical accelerations, except for Pazarcık earthquake at Ac = 0.2 g.
Generally, seismic slope displacement is typically estimated through a two-step procedure: (1) evaluation of ground-motion intensity measures using appropriate GMPEs; followed by (2) application of Newmark displacement prediction models that utilize intensity measures and critical acceleration to predict slope displacement. However, the research results indicate that the two-step approach may increase computational complexity, particularly in a large-scale area application (Du and Wang, 2014)46. Hence, Du and Wang (2016; hereafter, DW2016)47 proposed a one-step empirical model for predicting Newmark displacement. The model directly incorporates seismic information and site conditions instead of intensity measures. The predictive variables include Mw, Rrup, VS30, and fault type, expressed as follows,
$$begin{gathered} ln D_{n} = C_{1} + C_{2} (8.5 – M_{w} ) + (C_{3} + C_{4} M_{w} )ln (sqrt {R_{1}^{2} + h^{2} } ) hfill \ , + C_{5} F_{r} + (C_{6} + C_{7} M_{w} )ln (frac{{R_{2} }}{20}) + C_{8} ln (frac{{V_{S30} }}{1100}) hfill \ end{gathered}$$
(7)
where Dn is Newmark displacement in centimeters, C1–C8 is regression coefficients; both R1 and R2 represent rupture distance (km): if R1 ≤ 20 km, R1 equals to Rrup, otherwise, R1 is set to 20 km; if R2 ≥ 20 km, R2 equals to Rrup, otherwise, R2 is set to 20 km; Fr is an indicator variable (1 for reverse slip types of faulting and 0 for otherwise); h is a fictitious depth in km estimated during the regression, and VS30 denotes the averaged shear wave velocity of the upper 30 m (m/s). Figure 11 compares the observed Newmark displacements under four critical accelerations for both earthquakes, with the predicted medians from the Du and Wang (2016)47 models. The Newmark displacement decreases with increasing rupture distance. At Ac of 0.02, 0.05 and 0.1 g, Wenchuan earthquake exhibits significantly larger Dn values than Pazarcık earthquake with Rrup < 80 km, indicating its ground motion had more pronounced impacts on slope stability in the affected area. At Ac of 0.02 g, the observed Dn values for the Pazarcık earthquake were significantly lower than the predicted medians at Rrup < 30 km, whereas most Wenchuan earthquake observations exceeded predicted medians at Rrup > 30 km. At Ac of 0.05 g, the observed Dn values for the Pazarcık earthquake were significantly lower than the predicted medians at Rrup ≤ 10 km, while the opposite result was observed at Rrup > 10 km. Nearly all observed Dn values for the Wenchuan earthquake exceeded the predicted medians. At Ac of 0.1 g, most observed Dn values for the Pazarcık earthquake exceeded the predicted medians, and almost Wenchuan earthquake observations showed significantly higher Dn values than predicted medians at Rrup ≤ 50 km. At Ac of 0.2 g, most observed Dn values for both earthquakes were larger than the predicted medians. The result indicate that the Dn values of both earthquakes were higher than the averages predicted by Du and Wang in 201647 model at Ac = 0.05 and 0.1 and 0.2 g, except for Pazarcık earthquake at Ac = 0.02 g.
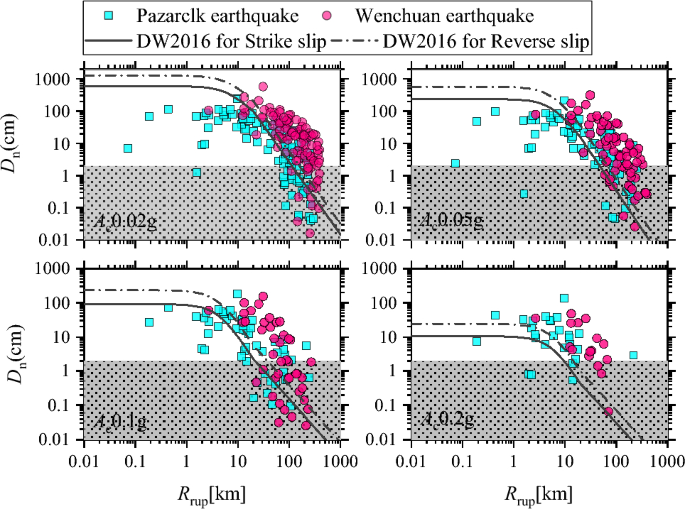
Observed Newmark displacement versus rupture distance (Rrup) at critical acceleration with 0.02, 0.05, 0.1 and 0.2 g for Pazarcık earthquake and Wenchuan earthquake, respectively. The black solid lines represent the predicted Newmark displacement medians for strike slip earthquake developed by Du and Wang (2016)47. The black dash dot lines represent the predicted Newmark displacement medians for reverse slip earthquake developed by Du and Wang (2016)47.
Research by Wilson and Keefer (1983, 1985)48,49 suggested that slopes produced the permanent damage to slopes occurs when the Newmark displacement value exceeds 2 cm. Typically, the more intense ground motion, the more severe and extensive the surface damage. Conversely, the greater surface damage indicates a more intense ground motion, increasing the likelihood of large-scale area landslides49. As seen in Fig. 11, the most observed Dn values exceeded 2 cm during two earthquakes across all critical accelerations (Ac = 0.02 g, 0.05 g, 0.1 g, and 0.2 g). The Pazarcık earthquake occurred in the eastern parts of Anatolian plateau, the Wenchuan earthquake occurred in Longmenshan Fault Zone, located between the seismically active Tibetan Plateau and Sichuan basin (Zhang 2013)50. Both regions exhibit high terrain ruggedness index and elevated landslide susceptibility. The observations show most of Newmark displacements for both earthquakes exceeding 2 cm, indicating a sever landslide risk in their respective affected regions.