Identification of differentially expressed lipid metabolism related genes between periodontitis and healthy individuals
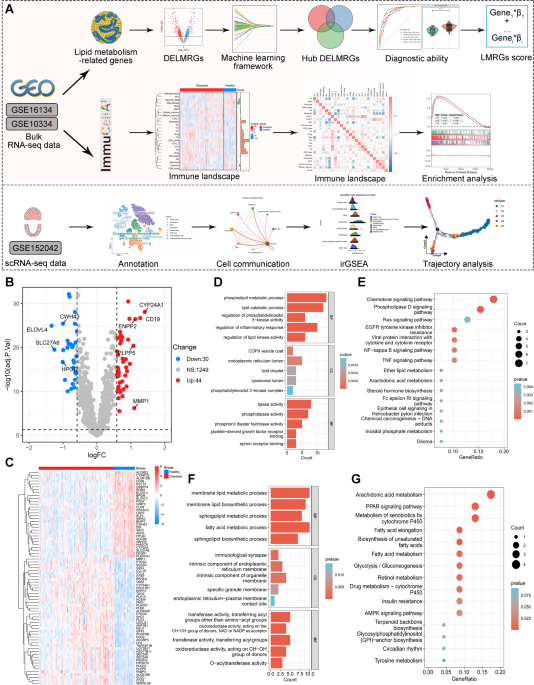
The workflow of this study is display in Fig. 1A. A total of 74 differentially expressed lipid metabolism-related genes (DELMRGs) were identified through differential expression analysis. Among these, 44 genes were upregulated, while 30 genes were downregulated (Fig. 1B). The hierarchical clustering heatmap shows the detailed expression patterns of these DELMRGs (Fig. 1C). We then investigated the biological functions of the upregulated and downregulated LMRGs using GO and KEGG enrichment analyses. GO enrichment analysis revealed that the upregulated LMRGs were primarily involved in the phospholipid metabolic process, lipid catabolic process, regulation of phosphatidylinositol 3-kinase activity, regulation of inflammatory response, and regulation of lipid kinase activity (Fig. 1D). In contrast, the downregulated LMRGs were mainly associated with membrane lipid metabolism, membrane lipid biosynthesis, sphingolipid metabolism and biosynthesis, and fatty acid metabolism (Fig. 1F). KEGG enrichment analysis indicated that the upregulated LMRGs were significantly involved in the chemokine signaling pathway, phospholipase D signaling pathway, cytokine-cytokine receptor interaction, NF-kappa B signaling pathway, and ether lipid metabolism (Fig. 1E). Meanwhile, the downregulated genes were primarily associated with arachidonic acid metabolism, fatty acid metabolism, and the biosynthesis of unsaturated fatty acids (Fig. 1G).
Identification of differentially expressed lipid metabolism-related genes (LMRGs) in periodontitis and healthy individuals. (A) The workflow of this study. (B–C) Volcano plot (B) and hierarchical clustering heatmap (C) illustrating the 74 differentially expressed LMRGs in periodontitis and healthy individuals. (D–E) Significant terms of GO (Gene Ontology) enrichment analysis (D) and KEGG (Kyoto Encyclopedia of Genes and Genomes) enrichment analysis (E) of the 44 upregulated LMRGs. (F–G) Significant terms of GO enrichment analysis (F) and KEGG enrichment analysis (G) of the 30 downregulated LMRGs.
Hub lipid metabolism related genes identification by multiple machine learning approaches
Next, three machine learning algorithms were employed to identify the most relevant diagnostic LMRGs for periodontitis. Random Forest (RF) identified 10 LMRGs based on importance scores, including FABP4, PLEKHA1, CWH43, CLN8, PDGFD, NEU1, HMGCR, CYP24A1, and OSBPL6 (Fig. 2A, B). Using LASSO regression, 16 LMRGs were identified after selecting the appropriate penalty parameter (Fig. 2C, D), with the coefficients of these genes shown in Fig. 2E. In the XGBoost model, the top 10 important LMRGs were CWH43, RORA, HSD11B1, PLEKHA1, ADGRF5, CLN8, FABP4, LYN, ENPP2, and OSBPL6 (Fig. 2F). Ultimately, five hub LMRGs were identified across these three algorithms: FABP4, CWH43, CLN8, ADGRF5, and OSBPL6 (Fig. 2G). We then explored the expression levels of these genes between periodontitis and healthy samples in the GSE16134 dataset. ADGRF5 and FABP4 were significantly upregulated in periodontitis samples compared to healthy tissues (Fig. 2H). Conversely, the expression levels of CWH43, CLN8, and OSBPL6 were significantly higher in healthy tissues than in periodontitis samples (Fig. 2H).
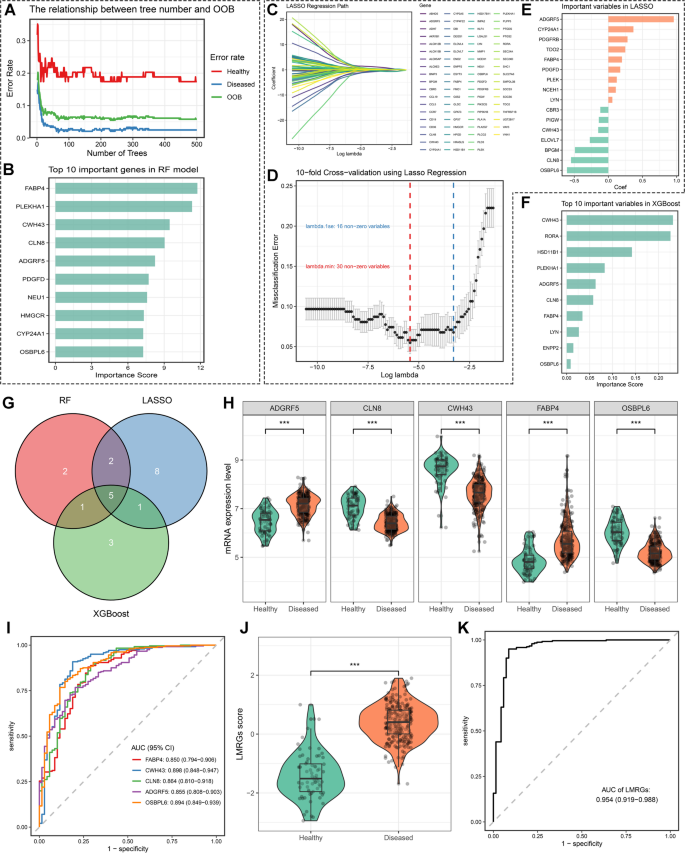
Identification of hub lipid metabolism-related genes (LMRGs) as promising diagnostic biomarkers for periodontitis through machine learning framework. (A–B) Variable selection in the Random Forest algorithm. (A) Line plot illustrating the relationship between the number of trees and the misclassification rate and out-of-bag (OOB) error in the Random Forest model. (C–E) Variable selection in the least absolute shrinkage and selection operator (LASSO) regression model. (C) The variable selection process during LASSO regression, with the horizontal axis representing the penalized parameter lambda (log-transformed) and the vertical axis showing the coefficients of each variable. (D) The 10-fold cross-validation (CV) of the LASSO model. The blue line represents the value of lambda and the corresponding variable number with non-zero coefficients selected by lambda.1se, while the red line represents the value of lambda and the corresponding variable number with non-zero coefficients selected by lambda.min. (E) Bar plot displaying the coefficients of the LMRGs identified by LASSO regression. (F) The importance score of the top 10 variables identified by the XGBoost model. (G) Venn plot illustrating the common LMRGs identified by the three machine learning algorithms. (H–I) Facet boxplots (H) and receiver operator characteristics (ROC) curves (I) to demonstrate the expression pattern and diagnostic ability of key LMRGs in periodontitis. (J–K) Boxplots (J) and ROC curve (K) showing the expression pattern and diagnostic ability of the LMRGs score in periodontitis.
Subsequently, ROC curves were used to evaluate the diagnostic ability of these LMRGs in distinguishing between periodontitis and healthy participants. The results demonstrated that these genes performed well in differentiating periodontitis from healthy individuals (Fig. 2I). The AUC value for CWH43 was 0.898 (0.848 − 0.947), followed by OSBPL6 (0.894 [0.849 − 0.939]), CLN8 (0.864 [0.810 − 0.918]), ADGRF5 (0.855 [0.808 − 0.903]), and FABP4 (0.850 [0.794 − 0.906]) (Fig. 2I). To further enhance the diagnostic ability of these genes for periodontitis, we developed an LMRGs score using the following formula: LMRGs score = 1.137 * FABP4 + (-1.113) * CWH43 + (-1.701) * CLN8 + 2.403 * ADGRF5 + (-1.642) * OSBPL6. As expected, periodontitis patients had higher LMRGs scores than healthy individuals (Fig. 2J). Integrating these genes into one index further improved the diagnostic ability, with the LMRGs score yielding an excellent discrimination ability between periodontitis and healthy samples, with an AUC of 0.954 (0.919 − 0.988) (Fig. 2K). We also validated the expression levels and diagnostic ability of the identified hub LMRGs and LMRGs score in an external validation cohort, with consistent results observed (Figure S1A-D). Ultimately, we also validated the protein expression level of these hub genes in healthy and periodontitis human samples through IHC staining. The results indicated that CLN8, CWH43, and OSBPL6 were upregulated in periodontitis tissues, while ADGRF5 and FABP4 were upregulated in healthy tissues (Figure S2). Taken together, these results indicate that these LMRGs and their integrated index, the LMRGs score, have promising diagnostic ability for periodontitis.
Immune cell infiltration landscape and immune function status in patients with periodontitis
Next, we investigated immune cell infiltration and immune function in periodontitis using ImmuCellAI and GSVA. In the GSE16134 cohort, we observed multiple immune cells, including CD4 + T cells, Th17, follicular helper T cell (Tfh), nTreg, CD4 naive T cells, iTreg, Th1, Th2, dendritic cells (DC), exhausted T cells, and CD8+ T cells (Fig. 3A). Consistent results were observed in the GSE10334 cohort (Fig. 3D). We then examined the association between LMRG scores and the infiltration levels of different immune cells in periodontitis and healthy tissues. A significant positive correlation was found between LMRG scores and the infiltration of CD4+ T cells, CD4 naive T cells, nTreg, Th1, Th17, Tfh, and exhausted T cells in periodontitis tissues in the GSE16134 dataset (Fig. 3B). In contrast, LMRG scores were significantly negatively correlated with the infiltration of macrophages and cytotoxic T cells (Fig. 3B). Similar correlation patterns were identified in healthy participants in the GSE16134 dataset (Fig. 3C) and all participants in the GSE10334 dataset (Fig. 3E, F). Boxplots demonstrated that periodontitis tissues had significantly higher infiltration levels of CD4+ T cells, Tfh, and Th17 than healthy tissues in both the GSE16134 and GSE10334 datasets (Fig. 3G, H). However, the infiltration levels of gamma delta T cells and macrophages in periodontitis were significantly decreased compared to healthy individuals (Fig. 3G, H).
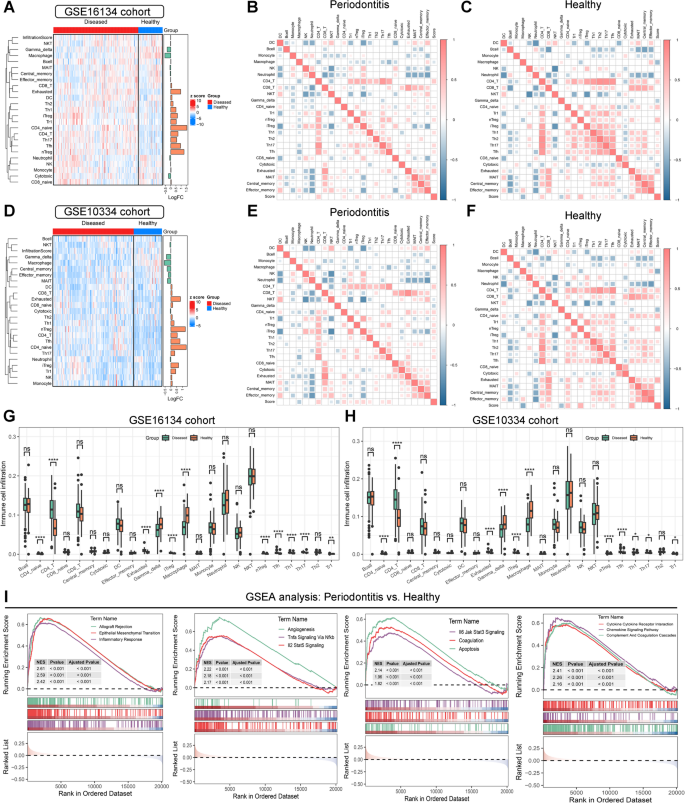
Immune cell infiltration and immune function estimation in periodontitis. (A–C) Hierarchical clustering heatmap (A) and correlation heatmap (B–C) illustrating the diverse immune cell infiltration status and their correlation with lipid metabolism-related genes (LMRGs) in periodontitis and healthy individuals in the GSE16134 cohort. (D–F) Hierarchical clustering heatmap (D) and correlation heatmap (E–F) illustrating the diverse immune cell infiltration status and their correlation with LMRGs in periodontitis and healthy individuals in the GSE10334 cohort. (G–H) Boxplots demonstrating the differences in immune cell infiltration estimated by ImmuneCellAI between periodontitis and healthy individuals in the GSE16134 (G) and GSE10334 (H) datasets. (I) Significant altered biological processes in periodontitis identified by Gene Set Enrichment Analysis (GSEA). ns no significance; * P-value < 0.05; ** P-value < 0.01; *** P-value < 0.0001.
GSVA was performed to investigate immune function in periodontitis. The results indicated that antigen presentation processes were significantly activated in periodontitis, as evidenced by increased scores for APC co-stimulation, HLA, and aDCs (Figures SA, B). This further triggered T cell activation and inflammation responses in periodontitis, as indicated by the increased scores of multiple T cell subsets and the inflammation-promoting score in GSVA (Figure S3A, B). GSEA was then employed to investigate significantly altered biological processes and pathways between periodontitis and healthy participants. Consistent with the GSVA analysis, multiple immune-related processes and inflammation response-related pathways were significantly activated in periodontitis, as evidenced by the activation of inflammatory response, TNF-α signaling via NF-κB, IL2-STAT5 signaling, IL6-JAK-STAT3 signaling, and chemokine signaling pathways (Fig. 3I and Figure S4A). Furthermore, epithelial-mesenchymal transition (EMT), angiogenesis, apoptosis, and metabolism pathways were also significantly activated in periodontitis (Fig. 3I and Figure S4A). Collectively, these results revealed that the immune microenvironment plays pivotal roles in periodontitis.
scRNA-seq analysis identifies cell subtypes and cell communication in periodontitis
Considering the limitations of bulk RNA-seq data in reflecting the immune microenvironment components in patients, we performed scRNA-seq analysis to decipher the immune microenvironment of periodontitis at single-cell resolution. After quality control and dimensionality reduction, we identified 12 distinct clusters in both periodontitis and healthy gingival tissue (Fig. 4A and Figure S4B). The top five marker genes of each cluster were visualized using bubble plots (Fig. 4B) and heatmaps (Figure S4C). Ultimately, using the SingleR algorithm, we identified eight main cell types among the 12 clusters: plasma cells, monocytes, multipotent progenitor cells (MPP), fibroblasts, keratinocytes, CD8+ effector memory T cells (Tem), microvascular (mv) endothelial cells, and class-switched memory B cells (Fig. 4C). We then validated the expression levels of key LMRGs at the single-cell level. Our analysis revealed that ADGRF5 and FABP4 were primarily expressed in fibroblasts and microvascular endothelial cells, while CLN8 was expressed across all single-cell types. In contrast, OSBPL6 was not expressed in CD8+ Tem cells, plasma cells, or monocytes (Fig. 4D and Figure S5A-C). Subsequently, we mapped the cell communication network among these cell types, identifying strong interactions mediated by multiple signaling pathways, including MHC-II signaling, CXCL signaling, and ADGRE5 signaling (Fig. 4E). These pathways are crucial in antigen processing and the inflammatory response. Further investigation of these pathways revealed that HLA and CD4 primarily contributed to signaling from various cells to MPP (Figure S6A), CXCL12 and CXCR4 contributed to signaling from plasma cells to other cells (Figure S6B), and ADGRE5 and CD55 contributed to signaling from diverse cells (Figure S6C).
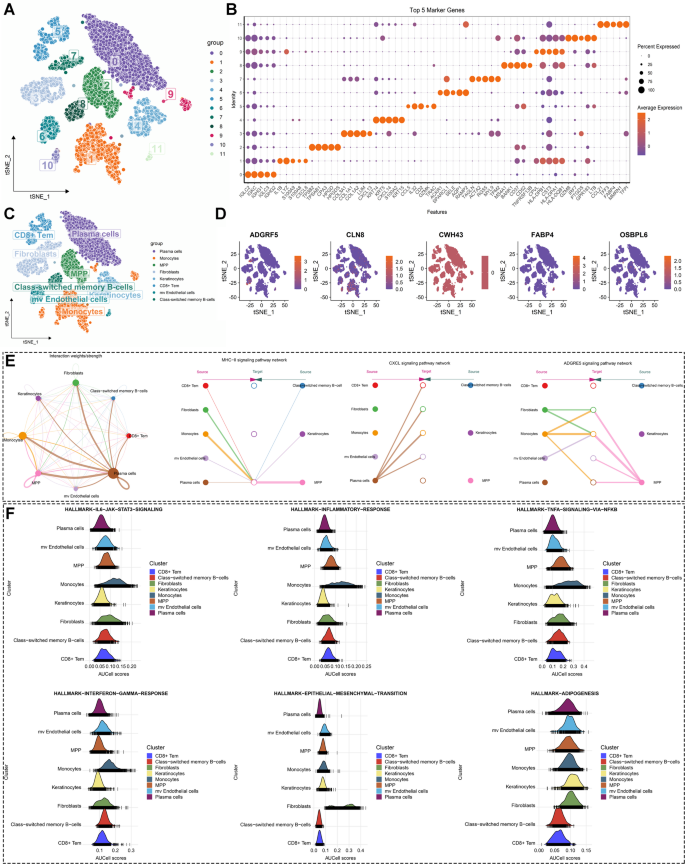
Single-cell RNA sequencing analysis in periodontitis to decipher its immune microenvironment landscape. (A) The utilization of the t-distributed stochastic neighbor embedding (tsne) algorithm identified 12 clusters in gingival tissues from individuals with periodontitis and healthy individuals. (B) Dot plot visualization of the top five marker genes for each cluster. (C) Annotation of eight cell types in gingival tissues from individuals with periodontitis and healthy individuals. (D) Feature plots displaying the expression levels of hub lipid metabolism-related genes (LMRGs) across the cell subtypes. (E) Cell communication network and the contribution of MHC-II, CXCL, and ADGRE5 signaling among different cell types. (F) Ridge plots displaying the indicated biological pathway scores estimated by single-cell Gene Set Enrichment Analysis (GSEA) among different cell types.
Single-cell GSEA was performed to investigate the most relevant biological functions of different cell subtypes in periodontitis. The results suggested that monocytes and MPPs primarily contributed to the inflammatory response and immune reaction in periodontitis by activating pathways such as the inflammatory response, TNF-α signaling via NF-κB, IL6-JAK-STAT3 signaling, IL2-STAT5 signaling, complement, and reactive oxygen species pathways (Figure S6D). Fibroblasts were mainly involved in processes like EMT, myogenesis, and Wnt/β-catenin signaling (Figure S6D). Keratinocytes and mv endothelial cells were engaged in cell proliferation by activating the E2F targets, MYC targets V1, and MYC targets V2 pathways (Figure S6D). We further performed single-cell GSEA to investigate the significantly altered biological processes of these cell types in periodontitis. Consistent with previous findings, the results indicated that the IL6-JAK-STAT3 signaling, inflammatory response pathway, TNF-α signaling via NF-κB, and interferon gamma response pathways were significantly activated in monocytes (Fig. 4F and Figure S6D). Meanwhile, EMT was exclusively activated in fibroblasts. The process of adipogenesis was activated in multiple cell types in periodontitis, except for CD8+ Tem and class-switched memory B cells (Fig. 4F and Figure S6D). Taken together, these findings highlight the important role of monocytes in periodontitis through the activation of inflammatory response pathways.
Deciphering the heterogeneity among different monocytes clusters in periodontitis
Given the important role and heterogeneity of monocytes in periodontitis, we further investigated the role of different subsets of monocytes by clustering them into distinct groups. Using the t-SNE algorithm, we identified five monocyte clusters, with the top five marker genes for each cluster summarized in Fig. 5A. Based on the unique expression patterns of these marker genes (Figure S7), we annotated the monocyte clusters as follows: C1 (APOE+SELENOP+ monocytes), C2 (CD1E+ monocytes), C3 (GZMB+PTGDS+ monocytes), C4 (CLEC9A+ monocytes), and C5 (IGHA1+ monocytes) (Fig. 5B). Trajectory analysis revealed three differentiation states among these monocyte subtypes. C1 represented the earliest stage of differentiation, while C4 appeared at the terminal stage (Fig. 5C). Additionally, BEAM analysis was conducted to investigate differentially expressed genes (DEGs) before and after branch point 1. We identified the top 100 DEGs, categorizing them into three subtypes as shown in Fig. 5D.
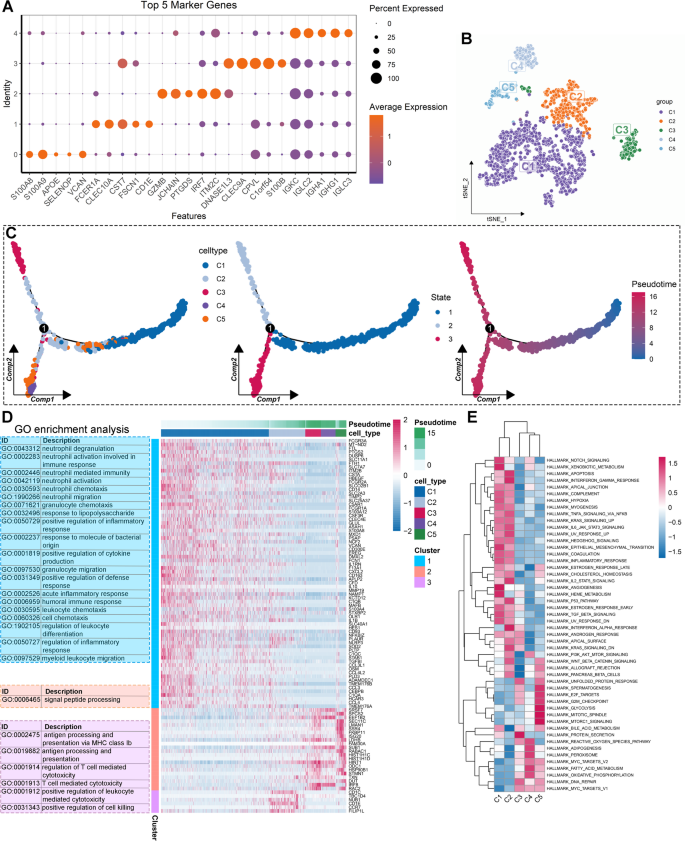
Deciphering the heterogeneity of monocytes in periodontitis through single-cell analysis. (A) Dot plot visualization of the top five marker genes for each monocyte cluster. (B) Annotation of five monocyte subtypes based on their unique marker genes. (C) Cell trajectory and pseudotime analysis among monocyte subtypes. (D) Differentially expressed genes (DEGs) of branch 1 along the pseudotime were hierarchically clustered into three subclusters, and their biological functions were estimated by Gene Ontology (GO) enrichment analysis. (E) Hierarchical clustering heatmap showcasing the activity of diverse biological processes among different monocyte subtypes.
GO enrichment analysis demonstrated that DEGs in cluster 1 were mainly involved in neutrophil activation, inflammatory response, and immune response. DEGs in cluster 2 were primarily associated with signal peptide processing, while DEGs in cluster 3 were linked to antigen presentation and T cell-mediated cytotoxicity (Fig. 5D). We further performed GSVA to explore the significantly altered biological processes in these monocyte subtypes. As illustrated in Fig. 5E, clusters C1 and C2 were predominantly involved in immune and inflammatory response pathways (Fig. 5E). Additionally, the EMT process was activated in C1 and C2 monocytes (Fig. 5E). In contrast, cell proliferation, adipogenesis, fatty acid metabolism, and oxidative phosphorylation were activated in C3, C4, and C5 monocytes (Fig. 5E). Single-cell GSEA was conducted to validate these findings, with consistent results observed (Figure S8). Taken together, different monocyte subtypes have distinct roles in periodontitis.