In this section, the results of each sustainability metric are individually analysed to examine the dynamics of battery performance, PV power generation, and load behavior. Finally, the holistic metric is evaluated to provide a comprehensive overview of the cases studied and their overall resilience.
Battery sustainability index (BSI)
In this study, the BSI was designed to provide a computationally tractable representation of battery health by quantifying SOC excursions and cycling frequency via weightings supported by degradation trends in the literature12,20. While this formulation captures the operational stress imposed on batteries, it does not include detailed electrochemical models such as Rainflow Counting or calendar aging estimation. For example, in Berlin, the BSI highlighted more frequent low-SOC events—reflecting deeper discharge cycles—which are known to accelerate degradation in both NMC and LFP batteries. These findings are consistent with trends reported in experimental investigations on hybrid energy storage, such as in24, where lithium-ion battery degradation was significantly affected by real-world fluctuations in renewable energy output. The incorporation of such empirical modelling approaches and hybrid storage configurations will be a natural extension of this work, particularly to bridge the gap between operational patterns and electrochemical wear.
The SOC is maintained above the minimum threshold of 20% for most of the operational hours, as set by HOMER. However, the frequency and duration of excursions below the safe operating range vary significantly across locations (see Fig. 3). The SOCSI is calculated for all the study cases, as shown in Table 2.
For Cairo (a), the SOC profile indicates that the battery spends most of the year at or near full capacity (100% SOC). This suggests an oversized energy storage system, where PV generation consistently exceeds demand. The frequent operation at full SOC may indicate underutilization of the system’s capacity and potential for optimization to reduce oversizing.
For Berlin (b), the SOC profile shows more variation, with periods of SOC decreasing closer to the 20% threshold. However, the battery generally maintains the SOC within the safe range for a significant portion of the year. The balanced performance reflects a system that is reasonably well sized, although there may still be occasional mismatches between PV generation and demand.
For Riyadh (c), the SOC profile demonstrates the most consistent behavior, with the SOC remaining stable and within the safe range for most of the operational hours. The battery rarely exists at critical levels, which reflects effective PV generation and proper system sizing suited to Riyadh’s high solar irradiance.
The evaluation of the BSI and SOCSI over the three years (2017–2019) reveals significant differences in battery performance due to regional variations in solar energy availability, operational dynamics, and battery sizing, as shown in Table 3.
Comparison of state-of-charge (SOC) behavior across Cairo, Berlin, and Riyadh for 2017, illustrating the temporal dynamics and variability influenced by regional solar conditions and battery management.
Although Fig. 3 provides insight into the SOC behavior over time, the SOC pattern is highly dynamic and influenced by several interdependent variables, including load demand fluctuations, solar radiation variability, and autonomy configuration. As such, determining the long-term sustainability or degradation risk of a battery on the basis of SOC plots or average values alone may lead to ambiguous conclusions. This complexity highlights the necessity of developing a comprehensive metric that encapsulates not only SOC trends but also their implications for battery longevity and system resilience.
Table 4 presents quantitative indicators of battery SOC behavior across three distinct locations (Cairo, Berlin, and Riyadh) over three years, including the average SOC, standard deviation, and cumulative time the battery operated outside the optimal SOC window. The results reveal significant spatial and temporal variations in battery operating patterns. For example, Cairo presented relatively high average SOC values (72.3–82.7%) with decreasing standard deviations over time (32.1–11.9%), reflecting tighter SOC control but frequent exposure to high SOC levels that risk accelerated degradation. Conversely, Berlin’s SOC remained generally lower (56.4–63.4%), yet with consistently high variability (approximately 34%), indicating less consistent SOC management. Riyadh displayed a stable average SOC (approximately 70%) and moderate standard deviation (≈ 20%), suggesting relatively balanced operation.
The SOCSI results reveal significant differences in battery performance across the studied locations, highlighting the importance of optimizing battery autonomy on the basis of regional solar conditions. In Cairo, an oversized PV system designed to provide one full day of autonomy consistently results in lower SOCSI values. This is because the system generates more power than the load demand does, causing the battery to remain near its maximum SOC for most of the year. While this setup reduces deep discharges, it limits the battery’s cycling within the optimal SOC range, resulting in less dynamic operation and higher degradation risks. Therefore, despite ensuring a reliable energy supply, Cairo’s battery system operates suboptimally in terms of long-term viability, with the BSI reflecting this imbalance between autonomy and SOC management.
However, these conventional statistical measures (mean and standard deviation) fail to capture critical aspects of battery sustainability. For example, both Berlin 2017 and Cairo 2017 show similar standard deviations (33.8% vs. 32.1%), yet the time spent outside the safe SOC range differs drastically (3461 h vs. 5408 h). This illustrates that traditional statistics provide limited insight into the actual stress imposed on a battery. The unsafe time metric highlights these hidden risks, emphasizing the need for a composite index such as the BSI, which integrates both the frequency and severity of SOC deviations alongside cycling behavior. The BSI thus offers a more meaningful and actionable indicator of battery health, supporting informed decisions about system operation and maintenance planning.
In contrast, Berlin experiences higher SOCSI values due to limited solar energy, which requires the battery to operate within a narrow SOC range. The battery spends much of the year at the lower SOC limit of 20%, especially in colder climates. However, the system’s ability to maintain this low SOC range leads to better resilience in terms of cycle life. Berlin’s higher BSI indicates a more favourable balance between cycling frequency and SOC management than does Cairo, where the oversized system limits cycling dynamics.
Riyadh benefits from consistently high solar availability, leading to more balanced and dynamic battery operation. The battery in Riyadh operates within the optimal SOC range more frequently, which promotes both longevity and reduced degradation. Riyadh’s high BSI values underscore its more sustainable battery performance, attributed to its optimal balance between SOC stability and efficient cycling.
The results emphasize the need for location-specific battery operation strategies. In Cairo, the oversized PV system should be optimized to avoid excessive SOC levels, as one day of autonomy is excessive for such sustainable high solar radiation. Conversely, in Berlin and Riyadh, one day of autonomy is more appropriate given the limited solar availability and consistent solar conditions, respectively. These findings highlight that autonomy should be carefully adjusted to local solar power performance, optimizing both battery performance and long-term viability across diverse environmental contexts.
To assess how different degradation mechanisms or battery chemistries influence the BSI, a sensitivity study was conducted where the weights were varied as follows:
-
Scenario A SOC-dominant scenario (ω₁ = 0.7, ω₂ = 0.3).
-
Scenario B Base case (ω₁ = 0.6, ω₂ = 0.4).
-
Scenario C Equal contribution (ω₁ = 0.5, ω₂ = 0.5).
-
Scenario D Cycle dominant (ω₁ = 0.4, ω₂ = 0.6).
As shown in Table 5, the analysis demonstrates that BSI is responsive to changes in degradation emphasis. For example, in Cairo in 2017, the BSI increased by more than 30% between the SOC-dominant (0.556) and cycle-dominant (0.730) scenarios. This variability highlights the importance of selecting appropriate weights to reflect the actual degradation mechanisms relevant to battery technology and the usage profile.
Lithium-ion chemistries such as NMC, which are widely used in advanced systems, are highly sensitive to SOC-related degradation, justifying higher SOCSI weightings (e.g., ω₁ = 0.6–0.7). In contrast, chemistries such as LFP or future solid-state batteries, which exhibit greater tolerance to high SOC, may benefit from recalibrated weights with greater emphasis on cycling. Similarly, systems with high-frequency shallow cycling may prioritize the cycle term to better capture wear patterns.
This flexibility enhances the applicability of BSI across diverse technologies and operating conditions. The sensitivity results also reinforce the need for careful, data-driven selection of weights rather than arbitrary choices, ensuring that the index meaningfully reflects the sustainability of the battery system.
PV power behavior
Figure 4 shows the daily ratio of served load to PV energy for three cities, i.e., Cairo, Berlin, and Riyadh, over 2017. Cairo consistently has a stable ratio below 1, indicating that PV energy production generally exceeds the load throughout the year. This pattern reflects the effective sizing of the PV system and favourable solar conditions, which minimize seasonal variability and ensure consistent energy availability. Berlin, in contrast, demonstrated significant fluctuations in the ratio, with multiple peaks exceeding 1. These spikes indicate periods where the served load surpasses PV energy production, particularly during winter months with lower solar irradiance. This variability highlights the challenges of relying solely on PV systems in regions with significant seasonal changes in solar availability, necessitating greater reliance on storage. Riyadh displays a pattern similar to that of Cairo, with ratios below 1 for most of the year, although it experiences slightly more variability. Occasional peaks suggest short-term mismatches between PV energy generation and load, but the overall stability reflects Riyadh’s high solar irradiance and well-sized PV system.
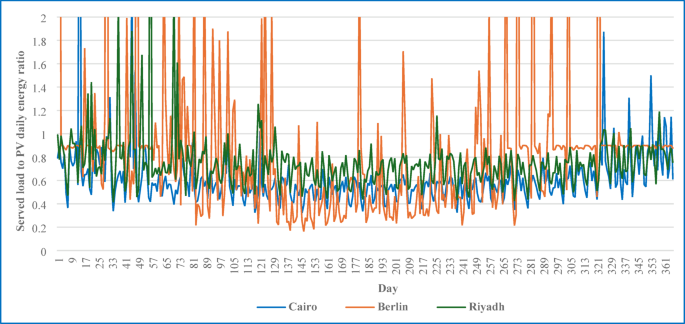
Comparison of the daily ratio of served load to PV energy across Cairo, Berlin, and Riyadh for 2017, showing regional differences in PV system performance and load matching.
Table 6 summarizes the ERE values for the three locations over three years. The ERE evaluates the PV system’s reliability in delivering energy to meet load demands by calculating the average fraction of daily PV-generated energy utilized effectively. Cairo’s ERE values, ranging from 0.55 to 0.63, indicate a consistent and reliable energy supply where PV production typically exceeds load requirements. This reflects a surplus of PV energy, which is effectively utilized to serve the load, minimizing reliance on storage.
Although Berlin has the lowest solar irradiance among the three locations, it presented the highest ERE value in 2017 (0.878). This outcome is attributed not to higher energy availability but to better alignment between the PV system output and the local load profile, resulting in more efficient utilization of the available PV energy. The relatively moderate and consistent load demand in Berlin allows a larger portion of the PV-generated energy to be consumed directly, thereby increasing the ERE despite limited solar resources.
The fluctuation in Berlin’s ERE values across the years, particularly the noticeable drop in 2018 (0.732), can be attributed to seasonal variations in irradiance, which affect the degree of mismatch between generation and load. Unlike Cairo, where PV generation often exceeds load requirements year-round, Berlin’s performance is more sensitive to annual solar variability. These differences highlight the importance of system design and regional climate in determining the effective utilization of PV energy.
Riyadh has an ERE of approximately 0.74, indicating a well-balanced system where PV energy production and load demands align effectively. The consistency of these values highlights Riyadh’s stable solar resources and effective system sizing, which ensures high reliability in energy delivery across all three years. These observations emphasize the importance of tailoring PV systems and energy management strategies to specific regional conditions to optimize reliability and performance.
These year-over-year trends underscore the importance of location-specific PV system design and energy management. While Cairo and Riyadh show consistent reliability, Berlin’s variability suggests the need for more robust storage or adaptive load management in regions with less predictable solar patterns.
Load behavior
The weighting factor was set to 3 during peak demand hours (08:00–16:00), where the load reached 200 kW, and 1 during other hours. This reflects periods of highest grid stress and system vulnerability, ensuring that the PDM metric prioritizes demand-matching performance during operationally critical times.
Cairo consistently has high weighted PDM values throughout the study period, with most values remaining above 0.6, as shown in Fig. 5-a. This indicates a well-balanced energy supply and demand, particularly during both peak and off-peak hours. The solar resource availability in Cairo, coupled with an effective EMS, supports stable performance.
Berlin shows a more volatile weighted PDM profile with frequent dips below 0.5 (see Fig. 5-b). This suggests challenges in meeting energy demand, particularly during peak load periods. The lower solar irradiance in Berlin likely impacts the PV performance, and the peak load weight (ω = 3) accentuates this mismatch during high-demand periods.
Riyadh’s weighted PDM values are relatively stable, remaining consistently above 0.5, with fewer extreme dips than those in Berlin. The region benefits from strong solar resources, enabling good performance, as shown in Fig. 5-c. However, occasional drops indicate periods of higher unmet loads, possibly during peak load periods or extreme weather conditions. Table 4 provides further insight into the long-term performance of the metric.
Cairo achieves the highest average PDM across all years. This reflects effective solar PV and EMS practices that ensure a balance between load demand and energy supply. Berlin consistently has the lowest PDM values, highlighting the impact of reduced solar resource availability. Seasonal fluctuations and the higher weight assigned to peak loads exacerbate the challenges in matching energy demand. Riyadh exhibits strong performance, with PDM values close to those of Cairo, as shown in Table 7. Its stable solar irradiance supports effective load balancing, although minor dips indicate areas for improvement in peak load management.
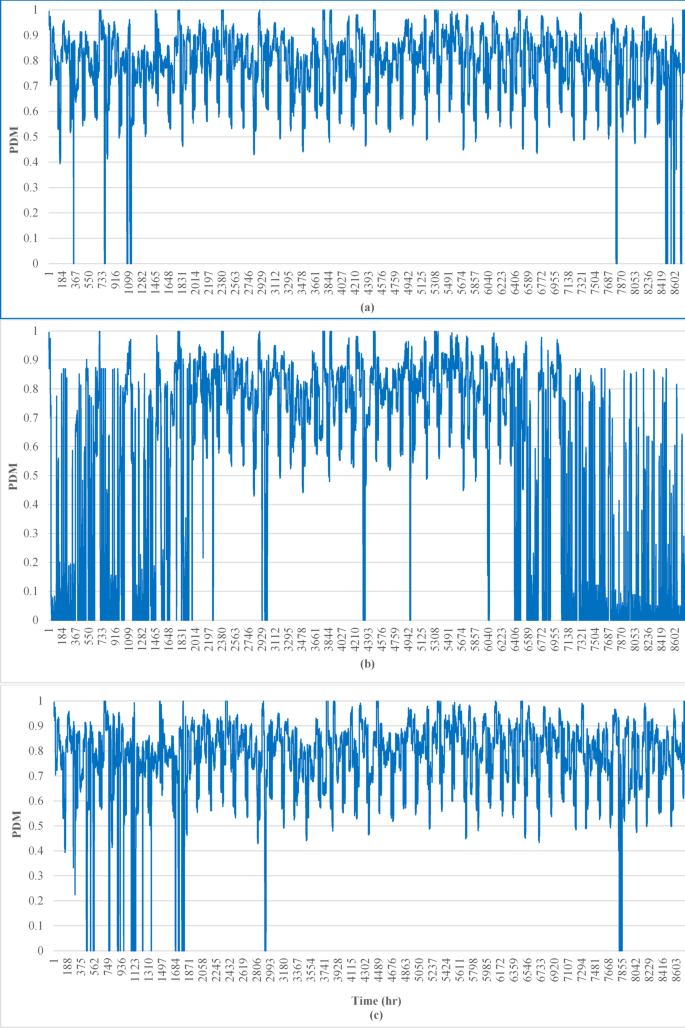
Comparison of the weighted peak demand matching (PDM) metric across Cairo, Berlin, and Riyadh for 2017, reflecting system performance under variable load weighting during peak and off-peak hours.
Holistic sustainability index
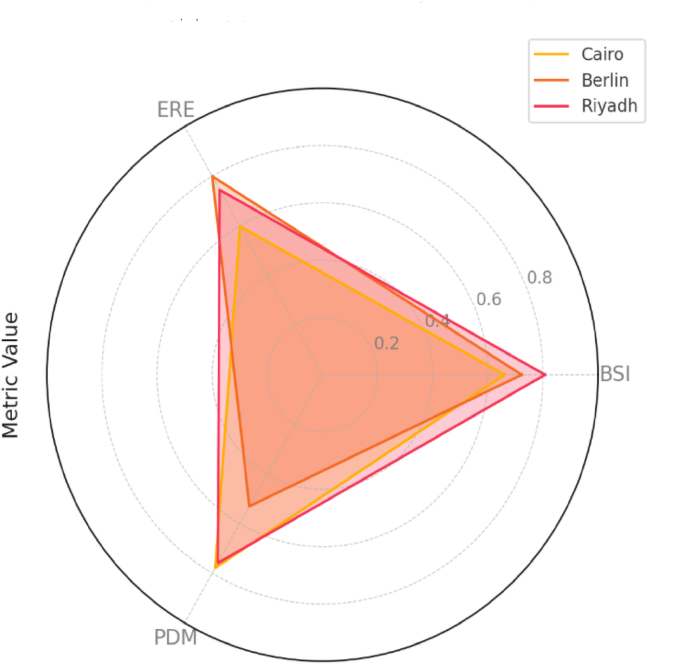
Comparison of BSI, ERE, and PDM metrics for Cairo, Berlin, and Riyadh, illustrating differences in battery sustainability, energy reliability, and demand matching performance across the cities.
The radar chart, shown in Fig. 6, effectively highlights the comparative sustainability performance of Cairo, Berlin, and Riyadh across average values of three key metrics: BSI, ERE, and PDM. Riyadh has the strongest overall sustainability profile, leading to both BSI (0.81) and ERE (0.75), indicating robust battery longevity and efficient energy reliability (see Figure y). Cairo has a relatively high PDM score (0.78), reflecting excellent load matching performance, although its lower BSI (0.66) and ERE (0.60) suggest potential oversizing issues and opportunities for optimizing battery cycling and system efficiency. Berlin, while exhibiting the highest ERE (0.80), has the lowest PDM (0.53), indicating challenges in demand matching, likely due to variable solar availability and seasonal load fluctuations. The intermediate BSI value (0.72) for Berlin indicates moderate battery performance but suggests that system flexibility improvements, such as hybrid storage or renewable diversification, could further enhance sustainability. Overall, the radar chart underscores the distinct trade-offs in system design and operational efficiency among cities, emphasizing the need for tailored strategies to improve sustainability metrics on the basis of regional characteristics.
The final HM values for the three locations, i.e., Cairo, Berlin, and Riyadh, over three years are presented in Table 8.
The results of the HM analysis provide insights into the performance of the locations studied over three years. Riyadh achieves the highest HM values across all years, reflecting its optimal balance between battery performance, energy utilization, and load-matching efficiency. Its high solar availability ensures that the battery operates within the optimal SOC range more frequently, promoting longevity while maintaining efficient energy conversion and demand matching.
Berlin has moderate HM values because of its efficient cycling dynamics and relatively strong energy utilization ERE. However, its limited solar availability requires the battery to operate near the lower SOC range for extended periods, increasing stress and degradation risks. While Berlin’s energy management strategy effectively maximizes energy utilization under constrained conditions, improving battery stress management could enhance its overall performance.
Cairo, despite benefiting from an oversized PV system that ensures a reliable energy supply, records comparatively lower HM values. The oversized system results in prolonged periods of high SOC, reducing cycling dynamics and leading to inefficiencies in energy utilization and load matching. Adjusting the system design to better align with local demand patterns and solar availability could significantly improve the performance of Cairo’s HM.
The contrasting system behaviors observed in Cairo and Berlin highlight the need for region-specific optimization strategies. Cairo’s oversized PV system ensures high reliability but leads to suboptimal battery cycling, which lowers the overall HM by underutilizing the battery and potentially reducing its lifespan. Conversely, Berlin’s smaller PV capacity results in greater battery stress due to increased cycling but achieves a higher ERE because of more effective energy utilization. To improve system performance, it is recommended that Cairo’s battery capacity be optimized to increase battery cycling and extend battery longevity. For Berlin, integrating hybrid renewable energy systems, such as combining wind power with PV, could reduce battery stress while maintaining energy reliability. Future work will explore these hybrid configurations to further enhance system flexibility, resilience, and sustainability across diverse climatic regions.
The HM advances beyond traditional reliability-based indices such as the LMI by incorporating a multidimensional assessment of PV-battery system performance. Unlike the LMI, which primarily evaluates how well the load demand is met, the HM integrates the BSI, ERE, and PDM into a unified framework. This integration allows the HM to capture operational inefficiencies and long-term degradation risks that the LMI tends to overlook. A clear example is observed in the Cairo case, where the LMI indicated acceptable reliability performance due to high load coverage, yet the HM revealed a lower score of 0.66, indicating an oversizing issue and excessive battery cycling. This demonstrates HM’s ability to detect subtle but critical design flaws, offering a more insightful evaluation tool for system designers aiming to balance performance, longevity, and reliability.
These findings reinforce the importance of adopting a holistic approach to sustainability assessment, as the interaction between battery performance, energy utilization, and load matching varies significantly across locations. The proposed HM framework effectively captures these interactions, offering actionable insights for optimizing system design and operation to maximize resilience across diverse environmental and operational contexts.
Economic assessment of PV-battery systems
To enhance the practical relevance of the proposed HM, this section presents a basic economic analysis focused on the levelized cost of energy (LCOE) and battery replacement scheduling. The analysis links sustainability indicators, such as the BSI, to cost performance, highlighting the economic benefits of improved system design (Table 9).
Levelized cost of energy (LCOE)
The LCOE is calculated as:
$${text{LCOE }} = {text{ }}Sigma {text{ }}left( {{text{C}}_{{text{t}}} /left( {{text{1 }} + {text{ r}}} right)^{{text{t}}} } right)/Sigma {text{ }}left( {{text{E}}_{{text{t}}} /left( {{text{1 }} + {text{ r}}} right)^{{text{t}}} } right)$$
where Ct is the cost in year t (capital, replacement, O&M), Et is the energy delivered to load in year, r is the discount rate (6%) and T is the project lifetime (25 years).
The battery replacement time
The battery replacement time in this study was estimated by linking the BSI results, which reflect the combined effects of SOC stability and cycle usage, to the expected consumption of the battery’s rated cycle life. To link the proposed BSI to battery economic life, we assume a linear relationship between the BSI and the replacement time. This is based on the premise that optimal SOC management and reduced cycling stress, reflected in higher BSI values, enable the battery to approach its maximum potential lifespan. For lithium-ion batteries, a typical maximum calendar life of 15 years is assumed under ideal operating conditions. Thus, the battery replacement time is estimated as:
$$T_{{replace}} = 15 times BSI$$
When this method is applied, the estimated battery replacement times for Cairo, Berlin, and Riyadh are approximately 9, 13, and 14 years, respectively. These estimates align with practical expectations for lithium-ion battery deployments in well-managed off-grid systems. This approach integrates the technical sustainability analysis with economic planning by translating the BSI into an expected replacement timeline. The economic analysis conservatively assumes a minimum of one replacement during a standard 25-year system lifetime to reflect calendar aging and real-world degradation mechanisms. This integration of sustainability results with replacement scheduling ensures that the proposed metric not only assesses technical health but also informs practical cost planning.
As shown in Table 10, this basic cost analysis reveals that systems with better battery sustainability (high BSI) not only perform better technically but also reduce long-term costs. In particular,
By linking HM to LCOE and the replacement frequency, this study provides a comprehensive view of both the technical and economic performance.