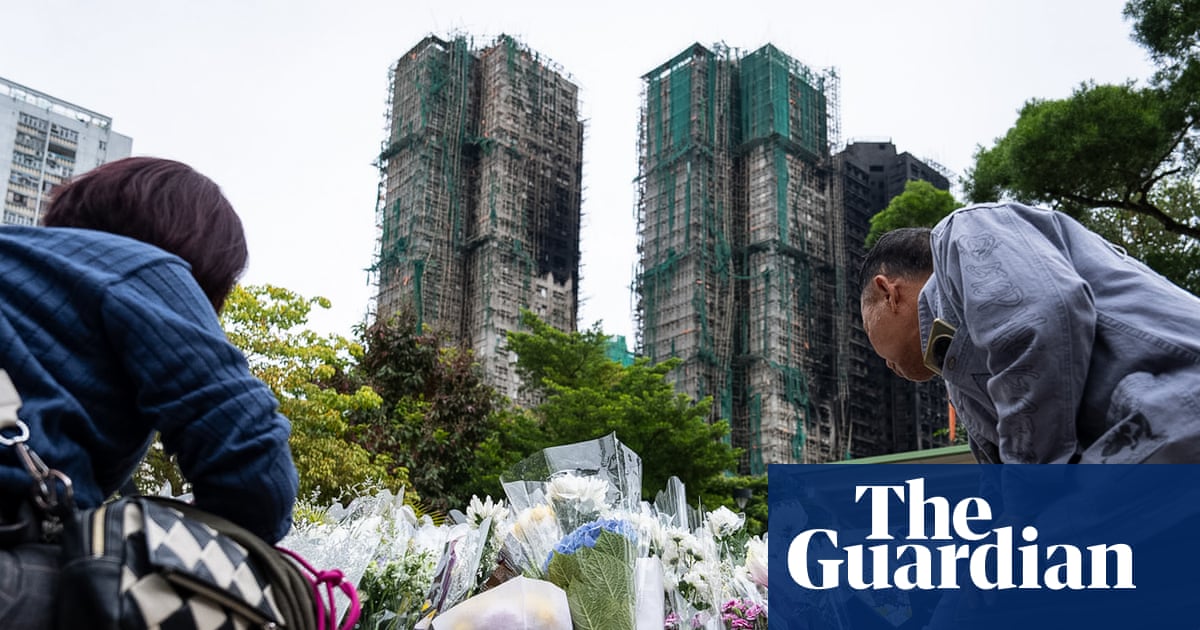
Datasets collection
The user behavior dataset used in this study was collected from multiple well-known online education platforms, including the international platform Coursera and the domestic platform NetEase Cloud Classroom.
The Coursera dataset covers user activity from 2019 to 2022 and includes detailed logs of various learning-related interactions, such as course browsing, video viewing, quiz submissions, and forum participation. These multidimensional records provide a comprehensive view of users’ learning behaviors and habits. In contrast, the data from NetEase Cloud Classroom spans from June 2020 to January 2023 and features a diverse user base, including high school students, university students, and working professionals across different age groups and educational backgrounds. This dataset not only captures core learning behaviors—such as course selection and study duration—but also includes user interaction data such as comments, likes, and discussions, offering rich, multidimensional insights for behavior analysis.
The dataset was collected through direct collaboration with the online education platforms and constitutes proprietary experimental data. Rigorous preprocessing and cleaning procedures were applied to ensure data quality and usability. In total, the dataset contains approximately 200,000 samples with multiple feature dimensions, including user demographics, course selection, study time, and interaction behaviors—allowing for a comprehensive representation of user activity on online education platforms. To safeguard user privacy and ensure data anonymity, the study strictly adhered to data protection regulations and privacy standards during data collection. All user information was encrypted to prevent any disclosure of personal data. During preprocessing, a variety of methods were employed: missing values were handled using mean imputation or interpolated based on behavioral correlations; outliers were detected and removed using box plot techniques; and all numerical features were standardized to have a mean of 0 and a variance of 1. This normalization allowed different features to be compared on the same scale, thereby enhancing the efficiency and accuracy of model training. Through these preprocessing steps, data quality was significantly improved, ensuring the stability and performance of the predictive models.
Experimental environment
The experiments in this study were conducted on a high-performance computing server equipped with multiple GPU accelerators to support the training and validation of deep learning models. Python was used as the primary programming language, with TensorFlow and Keras frameworks employed to construct and train the BPNN model. Additionally, the WRF model was implemented using the Random Forest Classifier from the Scikit-learn library, with custom adjustments made to incorporate weighting mechanisms.
Parameters setting
To optimize the improved BPNN model based on the WRF framework, this study carefully configured several key parameters. Table 2 presents the main parameters and their corresponding values used during model training. The number of decision trees in the WRF model was set to 100, based on extensive experimentation and cross-validation. This number was chosen to strike a balance between prediction accuracy and computational efficiency. While increasing the number of trees can reduce variance and improve stability, it also leads to diminishing returns and higher computational costs beyond a certain point. Empirical results showed that 100 trees offered sufficient ensemble diversity to achieve high prediction accuracy without introducing excessive computational overhead. Moreover, this configuration helped mitigate overfitting in the presence of imbalanced data by enhancing model robustness. The maximum depth of each decision tree was set to 10, a parameter that directly influences model complexity. Deeper trees are capable of capturing more intricate patterns, but they also increase the risk of overfitting, particularly in noisy or limited datasets. Conversely, overly shallow trees may underfit and fail to capture key relationships. After testing various depth values ranging from 5 to 20, a depth of 10 was selected as the optimal setting. This depth offered a balanced trade-off, allowing the model to capture meaningful patterns without overfitting. It also ensured the model remained interpretable—an important factor for understanding user behavior on online education platforms. Other parameters were configured based on best practices in decision tree modeling and the specific characteristics of the user behavior data. For instance, the “gini” criterion was used to measure split quality due to its computational efficiency and effectiveness, especially with moderately balanced datasets. The min_samples_split parameter was set to 2, allowing internal nodes to continue splitting until all leaves reached purity, which is a standard setting in many decision tree implementations.
The selection of hyperparameters in deep learning models—such as learning rate, number of hidden layers, dropout rate, and regularization coefficient—is inherently complex and computationally demanding. Although this study carefully determined these values based on experimental results using data from an online education platform, it remains important to discuss the generalizability of these parameters in similar contexts and the associated cost of their selection. In this study, hyperparameters including a learning rate of 0.001, 50 hidden layer nodes, and a regularization coefficient of 0.001 were selected to align with the characteristics of the dataset, which comprised user login data, course interactions, and other behavioral metrics. These settings were chosen to optimize the performance of the integrated WRF-BPNN model for predicting user behavior within the AI-driven online education context. However, these parameter settings may not be universally applicable across all platforms or datasets. Variations in user demographics, engagement patterns, or course content may necessitate different configurations. For example, if a dataset is skewed toward a small group of highly active users, adjustments to the learning rate or the number of hidden layers may be required to prevent overfitting or underfitting. For more diverse user behaviors or larger datasets, more complex architectures—such as deeper networks or larger batch sizes—may be necessary to effectively capture interaction patterns. Conversely, for simpler or smaller datasets, a more lightweight configuration with fewer hidden layers or a lower learning rate may still yield satisfactory results.
Hyperparameter tuning is inherently resource-intensive and can significantly increase the time and computational cost of model training. While methods such as Grid Search and Random Search are commonly used and effective, they become computationally expensive when applied to large datasets or deep learning models with many parameters. In this study, the chosen hyperparameters reflect a balance between model performance and computational feasibility. Initial parameter selection was conducted using Random Search, followed by cross-validation to fine-tune these values, ensuring an optimal trade-off between prediction accuracy and training efficiency. To mitigate the high cost of hyperparameter tuning, future work could explore automated optimization techniques such as Bayesian optimization or genetic algorithms. These methods provide more efficient exploration of the hyperparameter space and can significantly reduce computational demands without compromising model performance.
In practical applications, transferring hyperparameters across different datasets or platforms presents another challenge. This study suggests that certain parameters—such as the learning rate and regularization coefficient—tend to be relatively robust across varying data characteristics. However, others, such as the number of hidden layers or the overall network architecture, may require adjustment based on dataset size and behavioral complexity. For large-scale or behaviorally rich datasets, advanced tuning techniques like cross-validation or sensitivity analysis can help identify the most impactful parameters. Incorporating domain knowledge into this process can further improve both the efficiency and effectiveness of hyperparameter selection. In summary, hyperparameter selection is a critical step in model development. In the context of dynamic and diverse datasets—such as those from online education platforms—careful consideration must be given to both the computational cost and generalizability of the chosen parameters.
Performance evaluation
Figure 4 illustrates the impact of different hyperparameters on the model’s prediction performance. When the learning rate is reduced from 0.01 to 0.001, the model’s Accuracy, Recall, and F1-score improve to 92.3%, 89.7%, and 90.8%, respectively. This indicates that a lower learning rate helps the model converge more effectively and reduces the risk of overfitting. Additionally, the model performs best when the number of hidden layer nodes is set to 50. Increasing the nodes to 100 leads to a decline in performance, suggesting that excessive model complexity can hinder learning. Furthermore, the model achieves optimal performance with a regularization coefficient of 0.001, highlighting the role of appropriate regularization in enhancing generalization.
The influence of different parameters on the prediction results of the model (the abscissa “1” in the figure is learning _ rate = 0.01; “2” is learning _ rate = 0.001; “3” is hidden _ layers = 50; “4” is hidden _ layers = 100; “5” means regularization coefficient = 0.01; “6” is regularization coefficient = 0.001).
Figure 5 shows the performance comparison results among different models. The proposed integrated model performs well in several benchmark models, especially in three important evaluation indexes: Accuracy, Recall and F1-score, which are significantly improved compared with other models. Firstly, in terms of accuracy, the proposed ensemble model (WRF + BPNN + CNN + Attention) reaches 92.3%, which is obviously improved compared with the traditional BPNN (87.3%) and the unweighted random forest (89.2%). In addition, the CNN and LSTM are 90.5% and 90.1% respectively, while the accuracy of extreme gradient boosting (XGBoost) is 91.0%. It shows that the integrated model is not only superior to the traditional single model (such as BPNN and unweighted random forest), but also surpasses other deep learning methods, such as CNN, LSTM and XGBoost. This shows that the integration method can better handle complex user behavior data by combining the advantages of different models, thus improving the overall prediction accuracy. In the recall rate, the performance of the proposed integrated model is equally outstanding, reaching 89.7%. This result is obviously higher than other models, especially traditional BPNN (84.1%) and unweighted random forest (82.4%). In addition, the recall rates of CNN, LSTM and XGBoost are 85.3%, 86.2% and 87.5% respectively. Improving the recall rate means that the model can better identify minority samples and reduce the situation of missing detection. The integrated model shows great ability in this respect, especially when dealing with unbalanced data, which can better capture the feature information of minority categories and further improve the practicability and reliability of the model. F1 score, as an indicator of comprehensive consideration of accuracy and recall, directly reflects the overall performance of the model. In terms of F1 score, the score of integrated model reaches 90.8%, which is significantly higher than all benchmark models. The F1 score of traditional BPNN is 85.6%, that of unweighted random forest is 85.6%, that of CNN and LSTM is 87.8% and 88.1%, and that of XGBoost is 89.2%. The integrated model achieved the highest F1 score among all compared models, indicating its strong overall predictive capability by balancing both accuracy and recall. This balanced performance helps avoid the common pitfall of overemphasizing one metric at the expense of the other. Overall, the proposed model demonstrates clear advantages in accuracy, recall, and F1 score, particularly when handling complex user behavior data. It effectively addresses the limitations of traditional models and enhances prediction accuracy. Compared to other advanced deep learning methods such as CNN, LSTM, and XGBoost, the ensemble model—by combining the strengths of WRF, BPNN, and MHAM—offers superior overall performance, improved generalization, and greater application potential.

Performance comparison results among different models.
Figure 6 presents the cross-validation results. Increasing the number of folds from 5 to 10 improves the model’s average accuracy, recall, and F1 score to 92.3%, 89.7%, and 90.8%, respectively. However, further increasing the folds to 15 causes a slight decline in performance. This suggests that 10-fold cross-validation offers a good balance, ensuring strong generalization while avoiding over-fitting.

Cross-validation results.
Figure 7 illustrates the relationship between training time and predictive performance. As the data volume increases, training time grows linearly, while accuracy, recall, and F1 score also improve. Specifically, when the dataset size rises from 50,000 to 200,000, accuracy increases from 91.3 to 92.3%, recall from 88 to 89.7%, and F1 score from 89.6 to 90.8%. This indicates that larger datasets enhance the model’s predictive ability, but require greater computational resources.

Relationship between training time and prediction performance.
Figure 8 illustrates the impact of different user behavior features on the model’s prediction results. Using the correct answer rate as a feature yields the highest accuracy, recall, and F1 score—92.3%, 89.7%, and 90.8%, respectively. This highlights the correct answer rate as a key predictor that significantly enhances model performance. Features like learning time and course clicks also improve the model’s performance, though to a lesser extent. In contrast, interaction frequency has relatively little effect on the model’s accuracy.

Influence of user behavior characteristics on prediction results.
Figure 9 compares the proposed improved integrated model with several benchmark algorithms. All experiments were conducted on the same dataset, and multiple evaluation metrics were recorded for each model to assess the superiority and effectiveness of the improved integrated model. The results show that performance differences between the improved WRF-BPNN ensemble model and traditional models like SVM, Neural Networks, and LightGBM are statistically significant. Paired t-tests confirm that the integrated model outperforms others in accuracy, recall, and F1 score, with all p-values below 0.05, indicating strong statistical significance.

Performance comparison of different models.
Compared to SVM, the improved integrated model clearly excels at handling nonlinear relationships and high-dimensional data. While SVM performs well on small datasets, its effectiveness decreases with larger, more complex data. In contrast, the integrated model leverages the strengths of both WRF and BPNN to effectively manage large-scale data and capture nonlinear patterns. Against Neural Networks, the integrated model achieves higher recall and F1 scores, particularly in addressing class imbalance. Although neural network has strong feature-learning capabilities, it often struggles to detect minority classes in imbalanced datasets. The weighted mechanism in WRF enhances minority class recognition, helping maintain strong predictive performance under imbalance. Compared to LightGBM, the integrated model offers better prediction accuracy and stability. LightGBM, a fast and efficient gradient boosting algorithm, performs well on large datasets but can be challenged by complex nonlinear relationships and high-dimensional features. By incorporating BPNN’s nonlinear fitting capability, the integrated model better captures these complexities, resulting in superior accuracy and stability.
To assess the competitiveness and originality of the proposed model, this study conducts a direct evaluation against four representative works. These works focus on user or student behavior prediction in educational settings. To ensure fairness and consistency, the key predictive models from these studies are re-implemented on the same test dataset, with all parameter settings replicated precisely as originally reported. Table 3 presents a detailed comparison between the proposed ensemble model (WRF + BPNN + CNN + Attention) and the benchmark models from the literature.
As shown in Table 3, the results clearly demonstrate the consistent performance advantage of the proposed ensemble model (WRF + BPNN + CNN + Attention) over several recent state-of-the-art approaches. In terms of accuracy, this model achieved 92.3%, surpassing Luo et al.’s machine learning method by 3.2%, Yildiz Durak & Onan’s PLS-SEM + ML approach by 2.0%, Jain & Raghuram’s SEM-ANN model by 1.6%, and Mathur et al.’s hybrid SEM-ANN framework by 1.1%. The performance gains are even more notable in recall, where the proposed model achieved 89.7%—substantially higher than the baseline models, which ranged from 83.5 to 86.9%. This demonstrates a stronger capacity to detect minority behavior classes, such as high-engagement users or at-risk students, particularly within imbalanced datasets. Additionally, the F1-score—a balanced measure that considers both precision and recall—reached 90.8%, underscoring the overall predictive superiority of this model.
These improvements stem from several targeted architectural innovations. First, unlike traditional machine learning methods or shallow ANN/SEM models, this approach incorporates a CNN. The CNN automatically and effectively extracts complex local temporal patterns in user behavior data. Examples include login frequency trends and time-specific engagement peaks. These patterns are often missed by conventional methods. Second, a MHAM is integrated to dynamically reweight the extracted features. This significantly enhances the model’s ability to detect critical discriminative cues, such as consistently high-performance behaviors or key course interactions. The addition of MHAM also overcomes the limitations of earlier SEM and ANN models, which tend to rely on static feature weights or implicitly learned feature relevance. Third, to address the pervasive issue of class imbalance in online education datasets, a WRF is incorporated either as a preprocessing component or as the core classifier. By applying class-weighting strategies based on node purity, feature importance, and skewed class distributions, the WRF significantly enhances the model’s ability to detect minority class instances. These include high-value user behaviors and dropout risks. This aspect is often underemphasized in prior studies. Finally, a BPNN is employed for the final prediction stage. Leveraging its strong nonlinear fitting capabilities, the BPNN models the complex patterns extracted and enhanced through CNN-MHAM and refined via WRF-based classification.
From the perspective of academic innovation and competitive performance, the core strength of this study lies in its deep integration of four components. These are CNN (for feature extraction), MHAM (for dynamic feature weighting), WRF (for handling class imbalance), and BPNN (for nonlinear modeling). All components work together within a unified predictive framework. This architecture is specifically tailored to the high-dimensional, temporally structured, locally dependent, nonlinear, and highly imbalanced nature of user behavior data on AI-driven online education platforms. Compared to traditional machine learning methods or hybrid SEM-ANN models, which primarily focus on structural relationships and shallow predictive capabilities, this model represents a significant technical advancement. It excels in automated feature engineering, adaptive feature importance learning, minority class detection, and the modeling of complex behavioral patterns. In particular, the CNN-MHAM module’s enhancement of local and discriminative features, combined with WRF’s effectiveness in identifying minority behavior patterns, are key drivers of this model’s superior performance—especially in terms of recall. These innovations collectively demonstrate the model’s robustness and competitiveness in addressing real-world, complex, and imbalanced behavioral prediction tasks in educational settings.