Datasets
We have compiled a comprehensive and well-structured dataset through the meticulous collection of image data obtained from the prestigious Institute of Radiotherapy and Nuclear Medicine (IRNUM) in Khyber Pakhtunkhwa, Pakistan. Utilizing the advanced and state-of-the-art GE SIGNA PET/MRI scanner, we acquired a comprehensive set of imaging data, comprising accurately captured and processed attenuation-corrected and reconstructed PET images, along with the invaluable gadolinium-enhanced T1-weighted images.
Our dataset encompasses a total of 207 meticulously selected digital imaging and communications in medicine (DICOM) images, forming the foundation for our rigorous image analysis endeavors. This intricate analysis process was meticulously carried out employing industry-standard tools such as MATLAB and the renowned imlook4d, ensuring the highest degree of precision and accuracy throughout the analytical pipeline.
To ensure a harmonious and coherent integration of the PET and T1-weighted images, a crucial preprocessing step involved the meticulous resampling of the PET matrix, precisely aligning it with the exact slice positions of the T1-weighted images. Subsequently, to facilitate standardized and consistent quantitative analysis, a vital step encompassed the normalization of voxel values to standardized uptake values (SUV), ensuring the establishment of a common metric for accurate assessment and comparison. This normalization process followed the formulation provided by Eq. (3), seamlessly integrating the essential mathematical framework into our analytical workflow.
While FLT and Gd have emerged as widely utilized PET tracer and MRI contrast agent, respectively, for the assessment of brain tumors, it is imperative to acknowledge their inherent limitations. Notably, FLT uptake, although serving as an indicator of cellular activity, lacks specificity when discerning malignant neoplasms, as it can be influenced by factors such as increased permeability resulting from blood-brain barrier disruption, which may also manifest in bone marrow and treatment-induced alterations. On the other hand, Gd, despite its established utility, necessitates careful chelation to ensure safe utilization in MRI due to its inherent toxicity. Moreover, differentiating between tumor tissues and surgical invasions poses a formidable challenge.
In this study, we employed 18 F-fluorothymidine (18 F-FLT) as the PET tracer for imaging glioblastoma multiforme (GBM). 18 F-FLT is a thymidine analog that functions as a proliferation-specific radiotracer by targeting thymidine kinase-1 (TK1), an enzyme upregulated during DNA synthesis in actively dividing cells. FLT is phosphorylated intracellularly and retained within proliferating cells, making it a valuable marker for assessing tumor cell proliferation. This characteristic renders 18 F-FLT a “tumor-specific” tracer, particularly advantageous for identifying active tumor regions beyond the contrast-enhancing zones visible on MRI. Unlike amino acid tracers such as 18 F-FET or 11 C-methionine, which accumulate based on increased transport in tumor cells, FLT provides more direct insight into mitotic activity, thereby offering complementary biological information that enhances the delineation of aggressive tumor subregions and contributes to more informed treatment planning and monitoring.
All imaging data were acquired using the GE SIGNA PET/MRI hybrid scanner, which integrates simultaneous PET and MRI acquisition. This system enabled exact co-registration between PET and MR images by capturing both modalities during a single imaging session without repositioning the patient. Consequently, issues related to alignment or time-lag variability between modalities were inherently minimized. The MRI component involved contrast-enhanced T1-weighted imaging, using gadolinium-based contrast agents to visualize the enhancing tumor core. Simultaneously, 18 F-FLT PET images were acquired to assess tumor proliferation. For PET imaging, attenuation correction was automatically performed using MRI-based correction algorithms native to the hybrid scanner. No separate image smoothing was applied during acquisition.
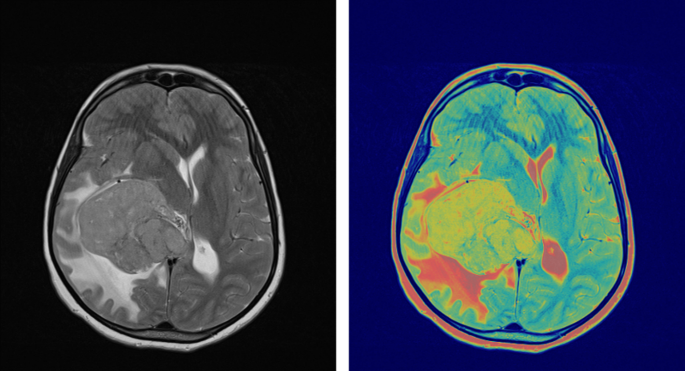
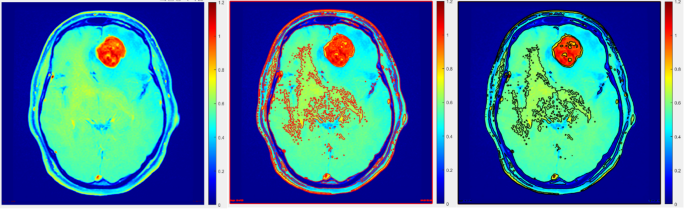
To evaluate surgical efficacy and determine the presence of any residual tumor tissue, the integration of follow-up MRI with contrast enhancement within a 48-hour timeframe following surgery assumes paramount importance. Such subsequent examinations often reveal contrast enhancement attributed to surgical intervention and the effects of radiotherapy. As shown in Fig. 1, pre-surgical FLT-PET/MRI brain imaging highlights glioblastoma contrast enhancement on Gd-enhanced MRI and FLT-PET activity concentration. The PET image was normalized to create a Gd-enhanced T1-weighted MRI matrix. While FLT PET and contrast-enhanced MRI images of GBM offer invaluable insights and information, it is crucial to consider and account for the aforementioned limitations. Therefore, exploring alternative imaging methodologies and approaches is imperative to enhance the accuracy of diagnosis and improve the efficacy of treatment monitoring, ultimately augmenting patient outcomes and prognoses.
Pre-surgical FLT-PET/MRI brain imaging showing glioblastoma contrast enhancement on Gd-enhanced MRI and FLT-PET activity concentration. PET image was normalized to create a Gd-enhanced T1-weighted MRI matrix.
The normalization process followed the formulation provided by Eq. (3), which can be expressed as:
$$SUV=~frac{{{I_{PET}}}}{{{C_t}{text{*}}{A_{inj}}*W*D}}$$
Where:
(SUV) represents the Standardized Uptake Value. ({I_{PET}}) denotes the measured intensity in the PET image. ({C_t}) stands for the tissue concentration of the tracer. ({A_{inj}}) represents the injected activity concentration. W denotes the weight of the patient. D represents the quantity of tracer injected adjusted for decay.
In this equation, the measured PET image intensity represents the pixel intensity value obtained from the PET image. The tissue concentration of the tracer refers to the concentration of the radiotracer within the tissue of interest. The injected activity concentration denotes the concentration of the injected radiotracer dose. The patient’s weight is the weight of the individual undergoing the PET scan. Lastly, the injected fluid tracer accounts in the the decay-corrected for the radioactive decay of the tracer over time.
Digital image processing
ROI selection
In the realm of brain tumor imaging, the current study has made significant advancements in the methodologies employed for precise delineation of tumor regions within PET and MRI images through a series of preprocessing steps. Nonetheless, the task of accurately delineating regions of interest (ROIs) in PET images presents challenges due to the influence of the partial volume effect (PVE), which impacts the resolution of PET cameras and results in a low signal-to-noise ratio.
To mitigate these challenges, a meticulous approach was adopted wherein tumor regions were delineated on each transaxial slice of the PET and MRI scans. Notably, the MRI scans exhibited superior resolution and contrast properties, enabling enhanced visualization of tumor regions within the ROIs.
Partial Volume Effect (PVE) Correction Equation:
$$PV{E_{Correcte{d_{PET}}}}=frac{{PET_intensity~}}{{PVE_Factor}}$$
Where:
(PET_Intensity) represents the intensity measured in the PET image. (PVE_Factor) denotes the correction factor accounting for the partial volume effect.
In order to establish initial delineation of PET ROIs, two distinct methods were devised. The first method involved excluding meninges and skull bone when tumors were situated in proximity to these areas. Conversely, the second method entailed comparing the affected cerebral hemisphere with its contralateral counterpart in instances where regions of heightened radiotracer uptake were not located near the proximity to the skull bone or meninges. Subsequently, a delineated ROIs were subjected to adaptive thresholding techniques, refining the initial approximation. In the image analysis phase, a synergistic combination of both delineation methods was employed to improve the accuracy of tumor delineation and achieve robust ROIs for subsequent volume of interest statistics and standardized uptake value (SUV) analyses. This study underscores the significance of advancing tumor imaging techniques and highlights the potential advantages associated with utilizing a comprehensive amalgamation of methodologies to surmount limitations such as the PVE. By refining and optimizing these techniques, it becomes conceivable to enhance the precision and specificity of brain tumor diagnosis and treatment monitoring, thereby yielding improved patient outcomes.
Adaptive Thresholding Equation:
$$Threshold=Mean+k*Standard~Deviation$$
Where:
(Mean) represents the mean intensity within the delineated region. (Standard~Deviation) denotes the standard deviation of intensity within the delineated region. k represents a constant multiplier used to adjust the threshold.
To enhance the precision of tumor delineation in PET/MRI imaging, it is essential to refine the imaging process by excluding structures such as the skull bone and meninges. As shown in Fig. 2, this refinement involves copying the PET delineation onto the MRI image to define initial boundaries (Fig. 2a and b). Subsequently, the MRI is employed to exclude the skull bone and meninges from the region of interest (ROI) (Fig. 2c). The delineation is further enhanced using adaptive thresholding techniques (Fig. 2d). These refinements are critical for achieving accurate boundary definitions and improving diagnostic precision.
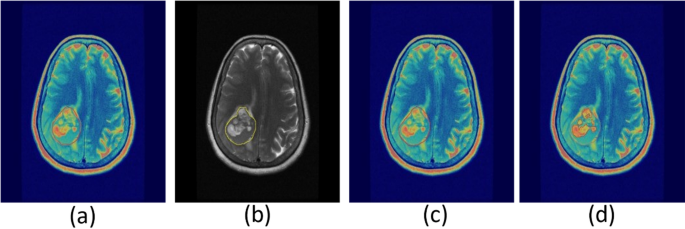
Refining PET/MRI imaging tumor delineation by excluding skull bone and meninges. PET delineation (a) copied onto MRI image (b) for defining boundaries. MRI used to exclude skull bone and meninges from ROI (c), followed by refinement with adaptive thresholding (d).
Contrast-enhanced MRI and FLT-PET imaging provide complementary insights into tumor characterization. As illustrated in Fig. 3, the blue areas in the contrast-enhanced MRI image (Fig. 3a) represent active tumor regions identified through increased uptake of the contrast agent. Meanwhile, the red delineated regions in the FLT-PET image (Fig. 3b) highlight tumors with high proliferative activity, offering a distinction from the surrounding tissues. This combined imaging approach enhances the accuracy of tumor detection and characterization, aiding in treatment planning and monitoring.
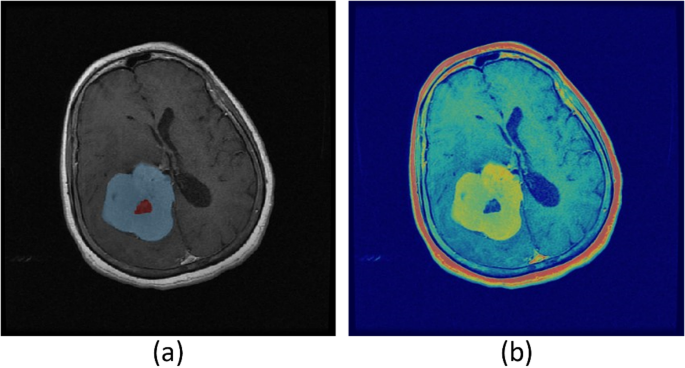
(a) The blue areas in the image represent active tumor regions detected through contrast-enhanced MRI, where tumor tissues show increased contrast agent uptake. (b) The red delineated regions in the FLT-PET image indicate tumors with high proliferative activity, distinct from surrounding tissues.
For tumor volume delineation, distinct segmentation strategies were applied to PET and MRI modalities. The MRI tumor volumes were manually segmented on contrast-enhanced T1-weighted images using the imlook4d analysis platform by two independent expert radiologists with over five years of neuroimaging experience. To reduce inter-observer variability, consensus segmentation was used for final volume generation. The inter-observer agreement was assessed using the Dice Similarity Coefficient (DSC), yielding an average Dice score of 0.88 ± 0.04 across subjects. For PET imaging, an adaptive thresholding approach was used to delineate the metabolic tumor volume (MTV). Specifically, regions with uptake values exceeding 40% of the lesion’s SUV_max were classified as tumor regions, in accordance with previously published clinical guidelines. This method has been shown to provide robust segmentation for 18 F-FLT PET imaging in glioma patients. The thresholding algorithm was implemented in MATLAB and validated internally through comparison with manually segmented test cases. To quantify the spatial agreement between PET- and MRI-derived tumor volumes, the Dice Similarity Coefficient was computed for each subject. The average Dice coefficient observed across all patient examinations was 0.42 ± 0.09, consistent with prior reports indicating limited spatial overlap between functional (PET) and structural (MRI) imaging in GBM. This reinforces the complementary nature of the two modalities and highlights the clinical relevance of multimodal imaging in glioblastoma assessment.
Consistency of inter observer
To assess the reliability and reproducibility of manual tumor delineation, a rigorous examination was conducted, involving a subset of four randomly selected patients from the overall cohort. In this evaluation, three proficient individuals expertly delineated regions of interest (ROIs) in a total of 20 MRI examinations, thereby yielding a comprehensive dataset of 60 MRI examinations for the purpose of consistency analysis. The degree of similarity between the segmented tumor volumes was quantitatively assessed by means of the Dice index, a widely recognized metric for measuring spatial overlap between binary segmentations.
Dice Index Equation:
$$Dice_Index=~frac{{2*left| {RO{I_1} cap RO{I_2}} right|}}{{left| {RO{I_1}} right|+left| {RO{I_2}} right|}}*100%$$
Where:
(RO{I_1}) and (RO{I_2}) represent two segmented tumor volume. (left| {RO{I_1} cap RO{I_2}} right|) denotes the intersection of the two segmented volumes. (left| {RO{I_1}} right|) and (left| {RO{I_2}} right|) represent the total volume of each segmented tumor. The Dice Index quantifies the extent of spatial intersection between the two segmented tumor volumes, represented in percentage terms.
In order to gain deeper insights into the consistency of the manual delineation process, the coefficient of variation (CV) was employed to calculate the relative standard deviation of the segmented tumor volumes. This statistical measure allowed for a comprehensive analysis of the degree to which the delineated tumor volumes deviated from the mean volume. By examining the mean tumor volumes associated with different delineated ROIs for each examination, the CV served as a valuable indicator of the degree of clustering or dispersion of the data points around the mean volume.
Coefficient of Variation (CV) Equation:
$$CV=frac{{Standard~Deviation}}{{Mean~Volume}}*100%$$
Where:
(Standard~Deviation) represents the standard deviation of the segmented tumor volumes. (Mean~Volume) denotes volume of the tumor being segmented with highlighted mean. The (CV) calculates the relative standard deviation of the segmented tumor volume as a percenatage of the mean volume.
This meticulous evaluation shed light on the subjective nature of manual segmentation in tumor delineation. It became evident that the manual approach introduced a certain level of variability, highlighting the need for more objective and standardized methods in the realm of tumor delineation. The findings underscored the importance of adopting quantitative and reproducible techniques to enhance the accuracy and reliability of tumor delineation processes, ultimately contributing to improved diagnostic and treatment outcomes.
Patient cohort and study design
This was a prospective observational study conducted at the Institute of Radiotherapy and Nuclear Medicine (IRNUM), Khyber Pakhtunkhwa, Pakistan, with institutional ethical approval obtained prior to data collection. All patients provided written informed consent in accordance with the Declaration of Helsinki. The study enrolled 22 patients diagnosed with histologically confirmed glioblastoma multiforme (GBM), who were undergoing initial staging and treatment planning. Inclusion criteria comprised: (1) newly diagnosed and treatment-naïve GBM patients; (2) availability of both pre-treatment PET and MRI scans; and (3) no prior radiotherapy, chemotherapy, or neurosurgical intervention except for biopsy. Patients were excluded if they had incomplete imaging data, motion artifacts, or were lost to follow-up. Ultimately, a total of 18 patients met all inclusion criteria and were analyzed. All imaging was conducted within a narrow time window, with PET and MRI scans performed within 48 h of each other to minimize temporal variations in tumor volume. Both imaging modalities were acquired before initiation of any radiochemotherapy or surgical resection to ensure a consistent baseline across the cohort. This approach eliminated potential confounding factors related to treatment-induced changes in enhancement or uptake patterns. Potential biases were mitigated by adopting strict inclusion criteria and standardized imaging protocols. However, we acknowledge that selection bias may persist, as patients undergoing both PET and MRI are often those with more complex or ambiguous presentations. This limitation is discussed in the concluding section. Nevertheless, the consistency in disease stage and imaging timelines across the included patients enhances the reliability of volume comparisons between modalities.
Segmentation performance evaluation
The inherent limitations of imaging systems, particularly their restricted spatial resolution, give rise to partial volume effects (PVEs) that engender spill-out phenomena in small objects or regions, as vividly depicted in Fig. 4. Consequently, when delineating ROIs for analysis, the pervasive influence of PVEs must be duly taken into account. In order to establish a reliable reference point for accurate measurements, a ground truth image was meticulously constructed by amalgamating PET images with predetermined standardized uptake values (SUVs) corresponding to distinct anatomical components, such as the tumor, regions with elevated tumor activity, skull bone, and adjacent background areas. These ground truth images serve as invaluable benchmarks, enabling precise quantification of object dimensions within the imaging domain.
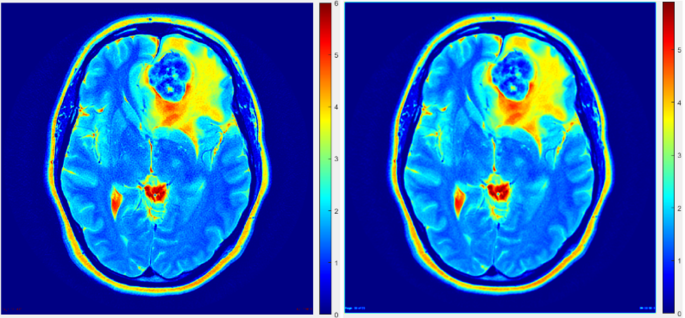
Constructed phantom with precise dimensions (left) and original PET image with blurred object boundaries and loss of activity in small objects due to PVE (right, white arrow).
Figure 4 serves as a visual illustration, juxtaposing a phantom image on the left and a conventional PET image on the right. Evidently, the PET image exemplifies a discernible attenuation of activity in diminutive entities, such as the high tumor spots region, which regrettably fails to manifest in the phantom image as prominently indicated by the absence of its characteristic red coloration. Furthermore, a notable discrepancy in spatial resolution is discernible between these two images, underscoring the criticality of addressing PVEs within imaging systems to foster enhanced precision in ROI calculations and tumor delineation endeavors.
By actively mitigating the deleterious effects of PVEs through judicious methodological interventions, one can effectively ameliorate the impact of spatial resolution constraints, thereby bolstering the accuracy and reliability of ROI determinations. This imperative pursuit toward PVE-aware imaging practices holds considerable promise in refining tumor delineation methodologies, ultimately facilitating more robust and dependable analyses with significant ramifications for diagnostic and therapeutic decision-making.
The impact of partial volume effects (PVE) on imaging accuracy can be observed in a constructed phantom study. As shown in Fig. 4, the phantom with precise dimensions is depicted on the left, while the original PET image on the right demonstrates blurred object boundaries and a loss of activity in small objects (indicated by the white arrow) due to PVE. This highlights the need for advanced imaging techniques to mitigate PVE and improve resolution and activity quantification in PET imaging.
To appraise the efficacy and discriminatory capabilities of diverse segmentation algorithms, a comprehensive assessment was conducted utilizing a meticulously constructed phantom and the generation of two synthetic PET images that faithfully emulated the salient characteristics of a genuine PET image dataset. With a meticulous attention to detail, these synthetic images were meticulously engineered to exhibit high and low tumor-to-background ratios (TBR), while maintaining a pixel size of 0.4883 mm in both the x- and y-directions, along with a slice spacing in the z-direction up to 1 mm. Notably, the “Uptake” values for FLT corresponding to each TBR configuration were meticulously determined and tabulated for reference in Table 1, serving as invaluable benchmarks for subsequent analyses1.
To faithfully replicate the inherent blurriness that frequently plagues real-world PET images, a Gaussian smoothing filter was judiciously employed to deliberately introduce blur effects onto the synthetic images. Specifically, the input parameters for the full width at half maximum (FWHM) of the Gaussian smoothing filter were diligently set at 3.5 mm in both the x- and y-directions, with a corresponding value of 5 mm in the z-direction. Such deliberate manipulation effectively induced blurred boundaries, faithfully mirroring the commonplace phenomenon encountered in actual PET images1.
By subjecting these meticulously crafted synthetic PET images to a comprehensive evaluation, profound insights were gleaned regarding the performance characteristics of the segmentation algorithms under scrutiny. Specifically, the algorithms’ capacity to accurately discern tumor activity from background activity was scrutinized, shedding light on their respective strengths and limitations1. This rigorous evaluation process constitutes an invaluable contribution to the field, offering crucial guidance and empirical evidence to guide the selection and refinement of segmentation algorithms in pursuit of heightened accuracy and reliability in tumor delineation endeavors.
Within the confines of Table 1, an intricate compilation of four distinct anatomical regions is presented, accompanied by their respective FLT uptake values crucial for the creation of PET images boasting divergent tumor-to-background ratios. With meticulous attention to detail, these FLT uptake values are meticulously expressed in kilobecquerels per milliliter (kBq/mL), precisely reflecting the standardized units inherent to PET imaging. It is noteworthy that the high uptake tumor spots, in particular, manifest significantly elevated FLT uptake values when juxtaposed with the remaining regions, possibly indicative of a more pronounced presence of metabolically active tumor tissue within these localized areas. Conversely, the values assigned to the skull bone and background regions exhibit an identical manifestation in both the high and low FLT uptake images, effectively indicating a relative paucity in terms of activity levels within these anatomical regions.
To comprehensively evaluate the segmentation accuracy of diverse thresholding methodologies, a meticulous analysis was conducted employing two distinct synthetic PET images thoughtfully engineered to encapsulate disparate tumor-to-background ratios, as comprehensively expounded upon in Sect. 3.2.4. In order to gauge the precision of the segmentation techniques under scrutiny, the Dice index, renowned for its efficacy in quantifying the degree of similarity between the segmented volume and the ground truth volume, was deftly harnessed for evaluation purposes. In accordance with established conventions, this Dice index was diligently calculated by multiplying twice the cardinality of the common elements shared by both the segmented and ground truth volumes, subsequently dividing this product by the element’s total cardinalities of the within respective group. Mathematically articulated the Dice (V1, V2) = 2 × (|V1 ∩ V2″https://www.nature.com/”V1| + |V2|)17, this esteemed metric definitively enabled the precise quantification of the segmentation accuracy achieved by each thresholding methodology under scrutiny, thereby facilitating an informed assessment of their relative efficacy.
Methods of PET volume segmentation
Medical Image segmentation, a fundamental aspect of medical image processing, assumes paramount significance in facilitating subsequent computational analysis. Its underlying objective entails partitioning images into distinct regions or segments to enable efficient handling of individual components. Among the manifold techniques employed for this purpose, thresholding emerges as a prominent approach, particularly adept at converting grayscale images into binary counterparts. This transformative process involves assigning foreground or background values to pixels whose intensity surpasses or equals a predetermined threshold value, thereby generating a binary mask that selectively designates pixels of interest as 1 while relegating others to a value of 0.
Within the scope of the present research endeavor, the paramount focus revolves around accurately delineating FLT-PET target cross-sections and effectively characterizing tumor volumes. To achieve this crucial objective, a comprehensive evaluation encompassing three distinct thresholding segmentation methodologies was undertaken, meticulously tailored to the specific nuances of the PET image dataset at hand. Notably, this discerning analysis incorporated two conventional thresholding techniques, esteemed for their established efficacy, alongside an adaptive thresholding technique, celebrated for its capacity to dynamically adapt to the unique characteristics inherent to the dataset under scrutiny. By judiciously applying these diverse segmentation approaches, the research aimed to achieve precise and robust tumor volume definition, thus paving the way for subsequent comprehensive analysis and interpretation of the FLT-PET image data.
The conventional thresholding methods conventionally employed a uniform threshold value applied to all pixels within the image, assuming a homogeneous response across the entire image domain. However, the efficacy of this approach is contingent upon various image attributes such as texture, noise characteristics, and the employed image reconstruction techniques. Recognizing the inherent limitations of a global thresholding strategy, an innovative and advanced adaptive thresholding technique was incorporated, wherein distinct threshold values were assigned to individual pixels based on their specific image properties.
This adaptive thresholding methodology, distinguished by its intrinsic adaptability to account for spatial variations in image illumination, proved to be remarkably robust and well-suited for the PET dataset under investigation. Unlike fixed threshold approaches, which faltered in the face of inherent spatial differences in image illumination, the adaptive thresholding method adeptly responded to such variances, facilitating accurate and refined segmentation outcomes. Notably, the adaptive thresholding algorithm was applied to the initial rough delineation of the regions of interest (ROIs), as visually depicted in Fig. 5.
Segmentation accuracy comparison using traditional and adaptive thresholding methods on a transaxial slice.
In order to ascertain the fidelity and precision of the segmentation achieved through the diverse segmentation methods, a pivotal metric known as the Dice index was leveraged. This quantitative index, extensively employed in the field of image segmentation, facilitated a comprehensive evaluation of the segmentation accuracy vis-à-vis the ground truth-constructed tumor volume. By quantifying the overlap and concordance between the segmented regions and the true tumor volume, the Dice index served as an indispensable tool in assessing the reliability and robustness of the employed image segmentation techniques.
The implementation of adaptive thresholding, an intricate technique rooted in the concept of local mean intensity surrounding each pixel, was realized in MATLAB through the utilization of the integral image method. A critical aspect of this approach involved determining the optimal sensitivity factor, which played a pivotal role in delineating the pixels deemed to belong to the foreground. To determine the most suitable sensitivity factor, an exhaustive evaluation of the PET imaging dataset was undertaken, employing two distinct PET images, each encompassing regions of varying TBR. Notably, these PET images were accompanied by preliminary delineations of the regions of interest (ROIs) to guide the analysis.
Within this evaluation framework, a comprehensive range of sensitivity factors spanning the spectrum of 0.1 to 0.9 was systematically explored. The accuracy and fidelity of tumor boundaries were meticulously assessed using a robust metric known as the Dice index. Through the rigorous analysis, the adaptive thresholding method emerged as the paradigmatic choice, yielding the most precise and reliable segmentation outcomes for the lesions under scrutiny.
It is worth emphasizing that the accurate definition of the ROIs assumes paramount significance, as even minute errors or inaccuracies within the delineated margins can impart substantial repercussions on crucial metrics such as SUV and TLA-based metrics. Thus, with utmost meticulousness, the SUV parameters were diligently calculated employing the well-established Eq. (3). Furthermore, the computation of the TLA further enriched the analytical repertoire, affording a more profound and nuanced comprehension of the tumor’s intricate characteristics.
These noteworthy findings not only contribute valuable insights to the existing body of knowledge pertaining to PET imaging data and tumor volume estimation through image segmentation but also hold substantial promise in informing and shaping future endeavors within this domain. Segmentation accuracy plays a critical role in the precise delineation of tumor boundaries in imaging studies. As demonstrated in Fig. 5, a transaxial slice comparison highlights the difference between traditional and adaptive thresholding methods. The adaptive approach shows improved accuracy in defining tumor regions, underscoring its potential for enhancing imaging precision and clinical decision-making.
Image features extraction
Sophisticated algorithms were meticulously crafted to extract intricate features from the PET and MRI image datasets, facilitating a comprehensive analysis of the distinctive characteristics and commonalities in tumor features. A central focus of this investigation was to evaluate the degree of tumor volume overlap (referred to as Voverlap) observed in both modalities. Precisely quantifying Voverlap entailed assessing the segmented volume shared by the VPET and VMR images. Furthermore, the analysis encompassed discerning the distinct volumes unique to each modality, denoted as VonlyPET and VonlyMR, respectively. It is crucial to comprehend that PET imaging enables the acquisition of information at an earlier stage in tumor development compared to MRI. Thus, VonlyPET signifies the tumor exhibiting active growth discernible solely through PET imaging, not yet manifest in MRI. Similarly, VonlyMR represents the active and necrotic tumor volume exclusively visualized through MRI imaging. By judiciously amalgamating the segmented volumes attributed to either VPET or VMR or both, their volume of tumor in combination, portrayed in MR and PET images can be ascertained. This comprehensive information significantly contributes to a more profound understanding of tumor growth dynamics and provides crucial insights into potential avenues for treatment optimization. The segmentation of tumor volumes across PET and MR modalities provides valuable insights into spatial overlap and modality-specific differences. As illustrated in Fig. 6, the segmented volumes for PET and MR are displayed, highlighting their spatial overlap (Voverlap) as well as unique volumes identified exclusively by each modality (VonlyPET and VonlyMR). This comparison underscores the complementary nature of PET and MR imaging for comprehensive tumor characterization.
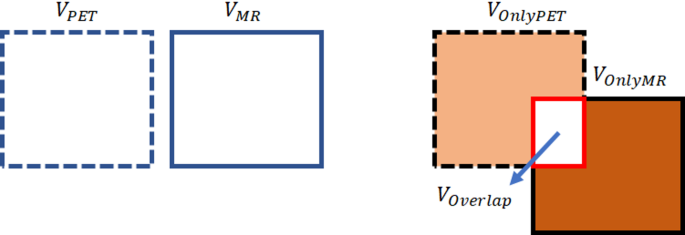
Illustrates the segmented volumes for PET and MR modalities, their spatial overlap as Voverlap, and the unique volumes as VonlyPET and VonlyMR.
Figure 7 exhibits a meticulously selected axial slice of the brain, ingeniously captured utilizing MRI with contrast enhancement. This striking visualization distinctly showcases the derived tumor volumes, meticulously delineating the distinct regions exclusively revealed through PET imaging (referred to as PET-only), the unique areas solely visible in MR imaging (referred to as MR-only), and the captivating overlapping tumor volumes that are prominently observed in both modalities. This comprehensive illustration provides a profound visual representation of the intricate interplay between PET and MR imaging in capturing and characterizing tumor volumes, thereby enriching our understanding of the multifaceted nature of these tumors.
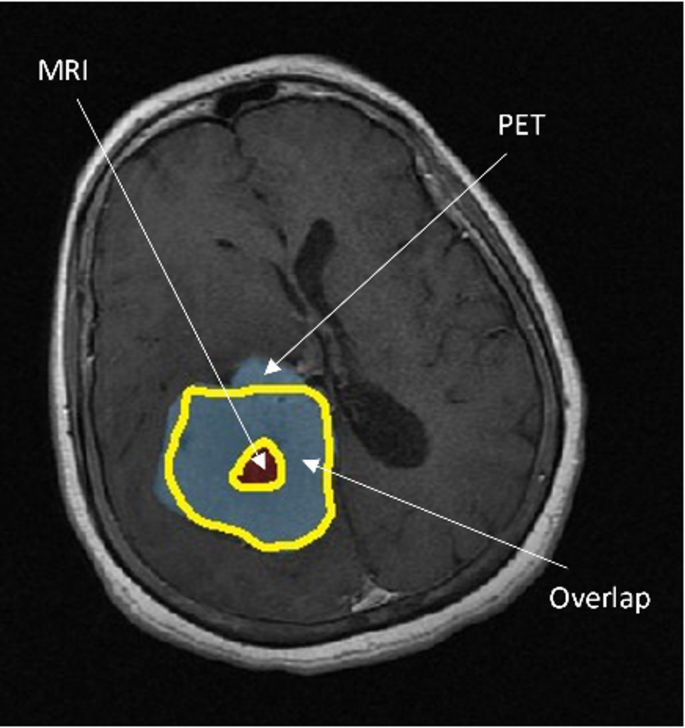
Axial slice of the brain obtained using contrast-enhanced MR, showing PET and MRI-derived tumor volumes: Voverlap, VonlyPET, and VonlyMR.
Statistical analysis
All statistical analyses were performed using MATLAB and SPSS. To quantitatively compare tumor volumes derived from PET and MRI, we applied both descriptive and inferential statistical tests. A paired t-test was used to evaluate whether statistically significant differences existed between PET-derived and MRI-derived tumor volumes across matched examinations. For datasets violating normality assumptions (as verified using the Shapiro-Wilk test), the Wilcoxon signed-rank test was employed as a non-parametric alternative. A two-tailed significance level of p < 0.05 was considered statistically significant. The relationship between PET and MRI tumor volumes was assessed using Pearson’s correlation coefficient (r). In cases of non-normal data distribution, Spearman’s rank correlation (ρ) was used. However, we acknowledge that correlation reflects association and not agreement.
To assess the level of agreement and identify any systematic bias between PET and MRI tumor volumes, we conducted a Bland-Altman analysis. Bland-Altman plots were generated to illustrate the mean difference (bias) between modalities and the 95% limits of agreement, defined as the mean difference ± 1.96 standard deviations. This approach provided a visual and statistical measure of proportional bias and potential outliers. For each comparison, 95% confidence intervals were reported alongside p-values to support the interpretation of effect sizes and measurement variability.
Given the limited cohort size, we treated statistical outcomes as preliminary. We explicitly note the limited statistical power and advocate for further validation using larger patient cohorts in future studies. As shown in Fig. 8, the Bland-Altman analysis illustrates a mean bias of 3.0 cm3, indicating that PET tends to slightly overestimate tumor volume compared to MRI. As summarized in Table 2, statistical analysis revealed a significant difference between PET- and MRI-derived tumor volumes, with PET consistently measuring larger volumes.
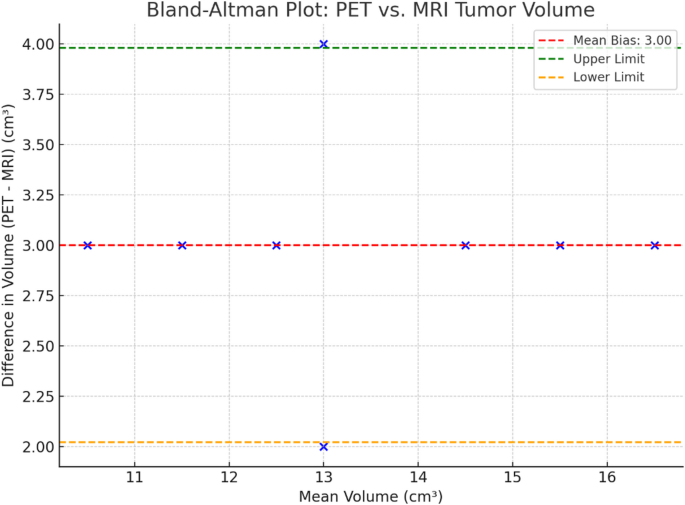
Bland-Altman plot showing the agreement between PET- and MRI-derived tumor volumes, with a mean bias of 3.0 cm3 and limits of agreement indicating PET tends to slightly overestimate tumor size.
Imaging protocol and PET tracer details
All imaging was conducted using a hybrid GE SIGNA PET/MRI scanner at the Institute of Radiotherapy and Nuclear Medicine (IRNUM), enabling simultaneous acquisition of PET and MRI data to eliminate registration errors and temporal discrepancies. PET and MRI scans were performed on the same day during each of the four scheduled examination sessions.
We employed the radiotracer 3’–deoxy-3’–[^18F]fluorothymidine (FLT), an ^18F-labeled thymidine analog, as the PET tracer. FLT is a tumor-specific proliferation marker that accumulates in actively dividing cells by mimicking endogenous thymidine, a DNA synthesis substrate. Due to its uptake via thymidine kinase-1 (TK1), which is upregulated in proliferating glioma cells, FLT-PET provides a reliable assessment of tumor growth and cellular activity. For the PET acquisition, approximately 370 MBq (10 mCi) of ^18F-FLT was intravenously administered, followed by a 60-minute uptake period prior to scanning. PET data were acquired in 3D mode for 20 min and corrected for attenuation using MRI-based attenuation maps. MRI scans included a T1-weighted post-contrast sequence (Gd-enhanced) with the following parameters: repetition time (TR) = 500 ms, echo time (TE) = 15 ms, slice thickness = 1 mm, field of view (FOV) = 256 × 256 mm. The contrast agent used was gadolinium-DTPA, administered at a dose of 0.1 mmol/kg body weight immediately prior to scanning. All PET and MRI images were preprocessed using MATLAB and imlook4d, including intensity normalization, motion correction, and resampling to a common voxel size. For PET-MRI co-registration, the hybrid system enabled automatic alignment, and further manual adjustments were made when necessary to ensure spatial fidelity.