The 66m tonnes of pollution from plastic packaging that enters the global environment each year could be almost eliminated by 2040 primarily by reuse and return schemes, significant new research reveals.
In the most wide-ranging analysis of the global plastic system, the Pew Charitable Trusts, in collaboration with academics including at Imperial College London and the University of Oxford, said plastic, a material once called revolutionary and modern, was now putting public health, world economies and the future of the planet at risk.
If nothing is done, plastic pollution will more than double in the next 15 years to 280m metric tonnes a year, the equivalent to a rubbish truck full of plastic waste being dumped every second. Much of the waste is made up of packaging.
This will damage every aspect of life; from the economy, to public health, to climate breakdown, the report, Breaking the Plastic Wave 2025, said.
“This rapid growth will harm human health and livelihoods through increased levels of land, water and air pollution, exposure to toxic chemicals, and risk of disease, and lead to higher rates of ingestion and entanglement among other species, resulting in more animals suffering illness, injury and death,” the authors said.
The production of plastic, which is made from fossil fuels, is expected to go up by 52% from 450m tonnes this year to 680m tonnes in 2040, twice as fast as the waste management systems across the world, which are already struggling to cope.
It is the packaging sector, an industry that creates items such as soft film, bags, bottles and rigid tubs for vegetables, margarines, drinks, fish and meat, that is causing plastic production increases. Packaging used more plastic than any other industry in 2025 and will continue to do so in 2040, the report found.
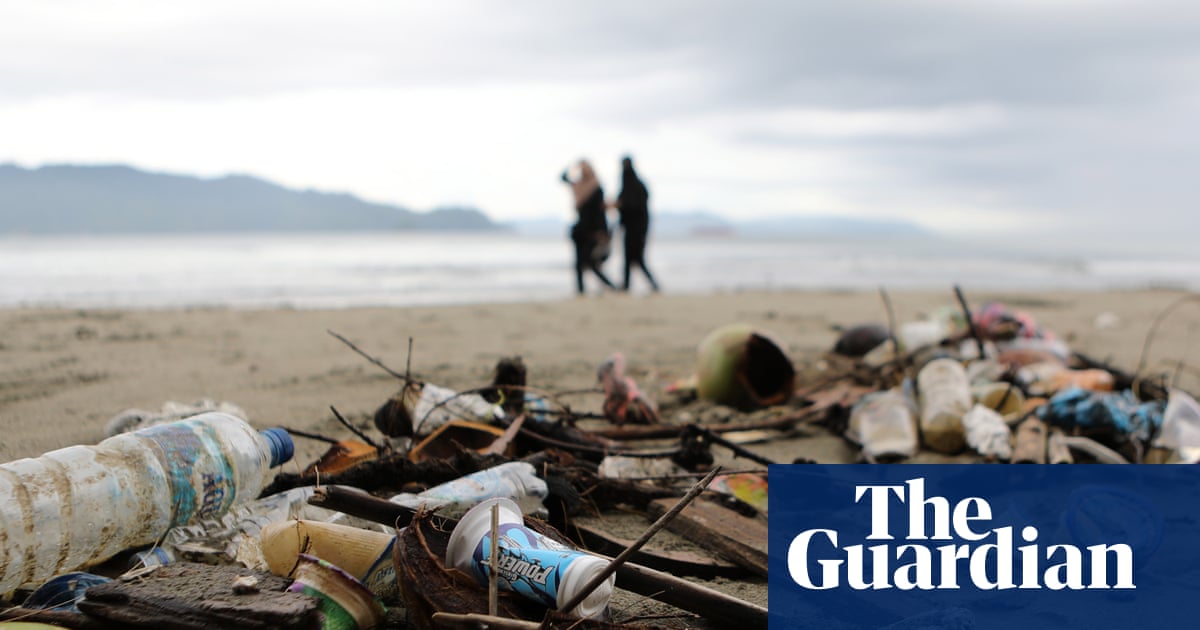
The single largest source of plastic waste across the world comes from packaging, which is used once then thrown away, and much of which is not recyclable. In 2025 it made up 33% globally of plastic waste, causing 66m tonnes of pollution to enter the environment each year.
But packaging pollution could be almost eliminated with concerted action such as deposit return schemes and reuse – where consumers take empty boxes or refillable cups to supermarkets and cafes. Combined with bans on certain polymers and substituting plastic for other materials, plastic pollution could be cut by 97% in the next 15 years, the research found.
“We have the ability to transform this, and nearly eliminate plastic pollution from packaging,” said Winnie Lau, project director, preventing plastic pollution, at the Pew Foundation.
“There are two key tools to decrease pollution from plastic packaging by 97% by 2040. The biggest of these are reuse and return systems, which will remove two-thirds of the pollution. The second is the reduction of plastic production for packaging and the use of other materials like cardboard, glass, metal and banning certain polymers.”
As well as polluting the environment, human contact with plastic – from children playing with toys, to people living next to petrochemical plants – is causing serious health problems.
“Plastic products contain more than 16,000 intentionally added chemicals as well as myriad unintentionally added contaminants,” the report said.
“Studies have already linked many of these chemicals to a range of health effects, such as hormone disruption, decreased fertility, low birth weights, cognitive and other developmental changes in children, diabetes and increases in cardiovascular and cancer risk factors.”
The global plastic system’s annual greenhouse gas emissions are also expected to rise from 2.7GtCO2e (gigatonne CO2 equivalent) in 2025 to 4.2 GtCO2e in 2040, an increase of 58%. If plastic production were a country, its emissions would be equivalent to the third-largest emitter by 2040, behind only China and the US.
But transformation is possible, the authors say. If interventions in waste management, production cuts, and reuse and return systems take place, plastic pollution could be reduced by 83%, greenhouse gas emissions by 38%, and health impacts by 54%. This would save governments globally $19bn (£14bn) each year in spending on plastic collection and disposal by 2040.
“Hope remains,” said Tom Dillon, of Pew Charitable Trusts. “The global community can remake the plastic system and solve the plastic pollution problem in a generation, but decision-makers will need to prioritise people and the planet.”