Our results show that the optimised YOLOv5-small model, trained on citizen science images, correctly localised 91.21% and classified 80.45% of Hymenoptera individuals, as well as localized 80.69% and classified 66.90% of Diptera individuals. Detection performance was weaker for other flower visitors (OtherT), which were typically smaller and blurrier. However, their higher accuracy (92.51%) shows the model mislabels Hymenoptera or Diptera as OtherT less frequently.
To meet the demands of real-world pollinator monitoring, we chose lightweight models, as they promise energy-efficient deployment in field settings. Among those tested, YOLOv5-small, with the highest parameter count, outperformed others in F1 score, aligning with prior findings that greater model capacity (i.e., more trainable parameters) enhances performance26,54a trend also observed in our previous study32. Future work could explore higher-capacity architectures compatible with in situ hardware constraints. A critical consideration for on-device deployment is inference (prediction) time, particularly rapid inference being indispensable for real-time tracking to accurately estimate visitor numbers per target flower. For example, Sittinger et al.55 reported a maximum attainable inference time of 49 frames per second (approximately 0.02 sec. per image) for a single-class YOLOv5-nano detector (“blob” format) running at a 320 × 320 image resolution on an autonomous camera with a dedicated GPU, specifically for tracking insects landing on a platform. Since image resolution impacts inference time, our models, though trained for a 640 × 640 resolution, could be retrained and converted to run inference at 320 × 320, potentially achieving similar performance on such custom camera hardware. For devices without a dedicated GPU, such as those equipped solely with CPUs, inference times are longer. Our previous work32 reported estimates for inference times (localisation and classification in one step) on a single core of a AMD EPYC 7551P 2.0 GHz CPU (within a server) for a 640 × 640 input resolution: YOLOv5-nano processed an image in 0.1893 sec., while YOLOv5-small took 0.4833 sec. per image (“PyTorch” format). Although a field device’s CPU would be less powerful and it would also handle essential tasks like image capture and operating system functions, reducing effective inference speed, future studies could test if these models can be adapted (e.g., via pruning and quantization56 to run in the background or overnight on CPU-based systems to filter out images devoid of arthropods, exploring viable solutions for large-scale data pre-processing.
The grid search NMS optimisation, maximising the F1 score of arthropod detectors on the unseen OOD image dataset under complex field conditions, has practical implications for camera system design. For instance, adapting Sittinger et al.’s55 setup for monitoring flower visitors could enhance on-device detection performance beyond default NMS values. This optimisation reflects dataset-specific tuning, as evidenced by comparing prior and current studies. In our earlier work with citizen science test images32a higher NMS-IoU suited dense, overlapping bounding boxes of ants and bugs (e.g., images near ant colonies). Conversely, the OOD flower-visit dataset, dominated by images containing single arthropods, favoured a lower NMS-IoU, with performance declining at higher values (Fig. 3a, c). A higher NMS-IoU threshold permits overlapping boxes, aiding detection of closely spaced arthropods, whereas a lower threshold enhances precision by minimising redundant predictions for solitary arthropods.
Our pollinator localisation tests have practical implications, demonstrating the potential of object detection models trained on citizen science images to assist in annotating time-lapse field datasets, where most frames lack arthropods (e.g., over 90%375758). Even by enabling a single prediction per sequence, these models could allow annotators to target relevant frames, bypassing manual review of arthropod-free images. Manual annotation of a 460,056-image time-lapse dataset previously required approximately 1,000 hours37whereas the YOLOv5-small model, performing both localization and classification, processed 23,899 OOD images in 419 sec. (~ 0.0175 sec. per image) on an NVIDIA RTX A6000 GPU, a desktop-grade component, suggesting around 2.24-hours runtime for the larger dataset, assuming fast image access. However, we noted that false positive (FP) rates on OOD images, including floral-only backgrounds, surpassed those on citizen science images, which more closely resemble the training set32. Our primary evaluation utilised an eval-IoU threshold of 0.5, consistent with standard practice59 and our previous work32as this threshold emphasizes the precise localisation of arthropods. Nevertheless, we observed that allowing larger predicted bounding boxes with using sub-0.5 IoU (e.g., Fig. 5) could enhance overall localisation and reduce FPs (e.g., results at eval-IoU 0.1 in Supplementary Table S2). This suggests that a lower eval-IoU may be beneficial when prioritizing the localisation of arthropods over highly accurate bounding box alignment. To further reduce FP rates and improve precision, including floral backgrounds without pollinators in training may prove beneficial. Another challenge is that smaller, less sharp arthropods are more likely to be missed. While the model effectively localised larger, common Hymenoptera and Diptera pollinators, it struggled with other flower visitors in the OOD dataset, which tended to be smaller and blurrier.
After localisation, classifying flower visitors challenged the model more, with significant bidirectional Hymenoptera and Diptera misclassifications outnumbering those to other categories, alongside reduced performance for other arthropods. While it distinguished these categories effectively on in-distribution images32this proficiency declined on the OOD dataset, where arthropods were on average 4.5 times smaller than in-distribution counterparts and sometimes occluded by flower parts (e.g., Fig. 5). This aligns with studies reporting reduced generalisation on organisms across new locations, time-frames, and sensors27,31,57,60,61,62alongside pollinator-specific occlusion challenges63,64,65. Moreover, the pretrained models were not trained with more images of either Hymenoptera or Diptera than other categories, ruling out dataset bias as a cause of cross-order misclassifications. This is further supported by the fact that, despite Lepidoptera being the majority class (nearly twice as abundant) in the training data32the model was robust against this class imbalance and rarely mislabelled Hymenoptera (the majority class in the OOD test set) or Diptera (the second most abundant class) as Lepidoptera (e.g., Supplementary Table S3). Likewise, the higher accuracy for OtherT flower visitors shows the model less often mislabels Hymenoptera or Diptera as OtherT.
Given these, Syrphidae mimicry most likely exacerbates the significant Hymenoptera-Diptera confusion, with syrphids like Eristalis spp. and Volucella bombylans resembling bees (e.g., Apis mellifera66 and red-tailed Bombus (e.g., B. lapidarius, B. pratorum67, respectively, mimicking their warning signals to deter predators. In the OOD dataset, larger or sharper arthropod instances exhibited significantly distinct distributions from smaller or blurrier counterparts for both localisation and classification. However, Apis mellifera and red-tailed Bombus, misclassified as Diptera, were as large and sharp as correctly classified cases, and the model was equally confident in these misclassifications most likely due to mimicry. In contrast, cross-order misclassified taxa not mimicked by Syrphidae (e.g., Halictidae, Cynipidae in Hymenoptera) and a few small, coarsely identified Diptera, had significantly higher model confidence in correct classifications. Their misclassified cases tended to be smaller and blurrier than correctly classified ones, likely explaining the mislabelling. Syrphidae misclassified as Hymenoptera were as large and sharp as correctly classified cases, but the model was significantly less confident in misclassifications. While these results might suggest that mimicry confuses the model more in one direction, with mimicked Hymenoptera more likely to be misclassified as Diptera than mimicking Syrphidae as Hymenoptera, we cannot say this conclusively due to the smaller sample size of Syrphidae individuals that were misclassified as Hymenoptera.
To improve localisation and classification, we consider several steps for future research. First, integrating citizen-science and field images, as in recent studies68,69would enhance model generalisation for real-world pollinator monitoring using time-lapse photography. Given that multiple studies have highlighted the scarcity of annotated field datasets for small arthropods, including pollinators23,25,70,71our study addresses this gap by providing the OOD dataset (cropped and full-frame images) for training arthropod detectors for custom field cameras. Our OOD dataset provides complex floral backgrounds, reflecting the variability inherent in automated pollinator monitoring, where images are captured passively with a fixed smartphone setup, without real-time human selection, curation or framing. The OOD dataset is however characterised by a natural class imbalance, with the majority class represented by Hymenoptera, followed by Diptera. Therefore, models trained with this dataset should be deployed at locations where similar arthropod distributions are expected. Fortunately, Hymenoptera and Diptera are common orders of pollinators in Europe, often dominating sampled plant-pollinator networks72. Class imbalance is nevertheless a source of bias and this could be mitigated by sampling underrepresented classes from available citizen science sources and/or applying more data augmentation on those classes. At the same time, maintaining a clear separation between training and test sets is essential because time-lapse image sequences can introduce a risk of data leakage73,74 if highly similar frames are split between these sets, potentially inflating model performance. In such cases, the network may rely on shortcut learning28recognising near-identical images based on superficial visual similarities (e.g., background patterns, nearly identical insect poses) rather than developing a truly generalisable understanding of arthropod features. To mitigate this, careful dataset partitioning is needed to prevent the model from exploiting temporal redundancies (e.g., highly similar consecutive frames depicting the same individual arthropod should be kept within a single set, either training, validation, or test, rather than split across them).
Second, model performance could improve through a two-steps approach, as suggested in other studies55,57,62,68,75. For example, an initial single-class object detector, such as YOLO76could localise arthropods (e.g., arthropod vs. background), followed by a classifier to identify their cropped images at finer taxonomic levels. In this study, the predicted labels were disregarded for the purpose of the arthropod localisation task, in line with our objective to develop a generic single-class arthropod detector. This two-steps approach also allows the community to choose object detectors suited to their field hardware while leveraging diverse classification methods in post-processing, such as region-specific classifiers trained on continuously expanding datasets77taxon-specific classifiers78 (that can be applied at specific locations or time frames to accommodate class imbalance due to natural variation), large multimodal models79or hierarchical classification via custom classifier68,80,81 and vision foundation models capable of learning hierarchical representations82. Furthermore, integrating object detection with segmentation has been shown to improve bumblebee species identification by removing noisy backgrounds and focusing classifiers on the most relevant features83. Additionally, citizen science platforms encourage users to upload cropped images of organisms34providing a rich source of training data for such classifiers. Another advantage is the potential for multi-view classification84leveraging sequential images of the same arthropod. Similar to how taxonomists examine multiple frames (e.g., Fig. 5) to improve identification despite occlusions or lower-quality frames, a multi-view CNN could refine predictions. In our study, we simplified this by assigning the label with the highest confidence score across a sequence, but a dedicated multi-view CNN could further enhance performance.
Third, preprocessing time-lapse images to highlight arthropod features against the background63 could enhance localisation if compatible with low-energy field cameras, or, if too energy-intensive, applied later on stored images rather than in real-time.
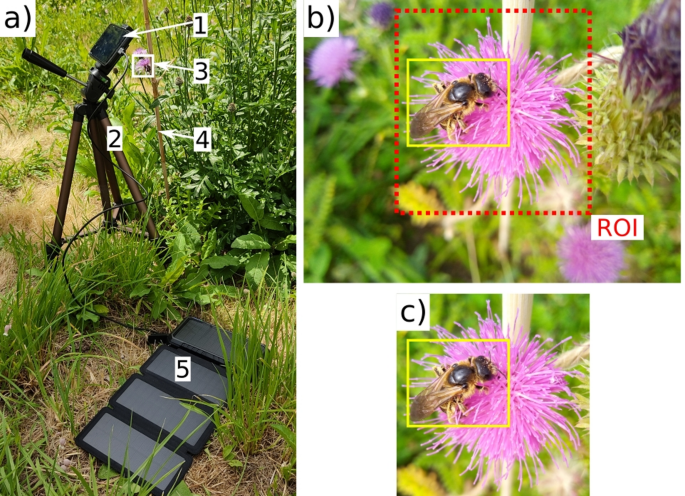
Fourth, our results confirm arthropod size and image sharpness as important factors to localisation and classification, aligning with Nguyen et al.’s70,85 findings on small-object detection challenges. The correlation between size and sharpness indicates also that arthropods further from the camera, or small arthropods in general, are most likely to be out of focus. Optimising image capture thus involves defining a region of interest and focusing on the target flower or inflorescence segment within, to maximise arthropod size in the frame. The region of interest can be defined via flower detection, segmentation, or pre-defined at the start of the recording session. This also aligns with future research where we aim to develop custom cameras based on the technology proposed by Sittinger et al.55that focus solely on target flowers, discarding noisy backgrounds that may contain out-of-focus flowers or cluttered patches of vegetation, which could confuse the models. Fixed focus is also crucial, and we adopted it when collecting the OOD dataset to prevent autofocus from shifting to background and blurring arthropods, as observed by Bjerge et al.63. Additionally, including blurred images in training datasets could further improve generalisation, as shown in larval fish detection86.
Lastly, tiling full-frame images for detection could improve small-object localisation87,88 by preserving details without downscaling to detector’s resolution. However, sliced inference like SAHI87 increases computational demands on low-power field devices. While not our primary focus, our preliminary SAHI test with YOLOv5-small on the OOD dataset showed slight F1 gains, but increased false positives and processing time (Supplementary Table S6). Still, fine-tuning SAHI could aid annotation of high-resolution time-lapse datasets when real-time processing is not required.
Implementing these proposed steps could enhance the detection of flower visitors, thereby facilitating the tracking of individual pollinators and enabling estimates of floral visit abundance, a key goal for automated pollinator monitoring. Examples of insect tracking can be found in recent studies55,64,89.