Isolation of WJ-MSCs
Discarded human umbilical cords were obtained at the University Hospital Plzen (Plzen, Czech Republic) from healthy full-term neonates (N = 4) after spontaneous delivery, according to all ethical guidelines. About 10 cm of the umbilical cord was aseptically collected, placed in sterile PBS with antibiotic–antimycotic solution at 4 °C, and transported to the laboratory within 24 h. After washing several times in PBS and brief exposure to 10% Betadine (EGIS Pharmaceuticals PLC, Budapest, Hungary), blood vessels were removed, the remaining Wharton’s jelly tissue was chopped into small fragments and the cells were isolated by enzymatic digestion in PBS-AA solution containing 0.26 U/ml Liberase-TM™ (Roche Custom Biotech, Mannheim, Germany) and 1 mg/ml hyaluronidase at 37 °C with constant shaking for 2 h. After removing undigested fragments with 40-µm cell strainers, cells were centrifuged at 450 × g for 10 min6,38.
Isolation of AT-MSCs
AT samples were obtained from healthy volunteers (N = 4) who had undergone liposuction procedures for aesthetic reasons and processed as previously described6. Briefly, the lipoaspirate was repeatedly washed in PBS and enzymatically digested by 0.3 PzU/ml collagenase type I (Thermo Fisher Scientific) at 37 °C for 2 h with constant shaking. After centrifugation at 200 × g for 10 min, the stromal vascular fraction was washed twice with PBS and expanded.
Cell culture and expansion
Primary cell suspensions were diluted in a complete culture medium containing α-MEM (Gibco®, Thermo Fisher Scientific), 5% human platelet lysate (HPL, Bioinova a.s.), penicillin/streptomycin (Gibco®, Thermo Fisher Scientific), and GlutaMAX (Gibco®, Thermo Fisher Scientific). Cells were cultured at 37 °C in a humidified atmosphere with 5% CO2. Regular media changes were done twice a week. After reaching near-confluence, cells were harvested using the 0.05% Trypsin/EDTA solution (Gibco®, Thermo Fisher Scientific) and reseeded onto a fresh plastic surface (Nunc, Roskilde, Denmark) at a density of 5 × 10³ cells/cm2. Cells in passage 2 were cryopreserved in culture medium, supplemented with 10% DMSO, using a 1 °C/min cooling rate down to 80 °C, and stored at -196 °C until further use. Before use, the cryopreserved cell cultures were thawed at 37–40 °C and additionally expanded in the α-MEM medium containing GlutaMAX, supplemented with 10% fetal bovine serum (FBS), 100 units/mL of penicillin, and 100 µg/mL of streptomycin (all from Gibco®, Thermo Fisher Scientific). Cells from passages 3–5 were used for subsequent experiments.
Adipogenic differentiation
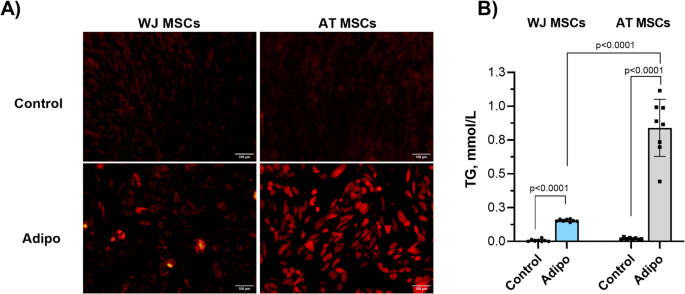
For adipogenic differentiation, AT- and WJ-MSCs were cultured for 21 days in a medium composed of α-MEM, containing 10% FBS, penicillin/streptomycin, GlutaMAX, 0.5 mM 3-isobutyl-1-methylxanthine, 0.1 µM dexamethasone, 0.1 mM indomethacin, and 10 µg/ml insulin (all from Merck KGaA, Darmstadt, Germany). The medium was replaced every 3 days.
In separate experiments, the induction medium was additionally supplemented by 100 µM Oleic Acid (OA, Merck KGaA), 100 µM Linoleic acid (LA, Merck KGaA), or their mixture (50 µM each). Before the application, OA and LA were dissolved in DMSO and then complexed with albumin in FBS, resulting in an estimated BSA: FA ratio of ~ 2.4:1 to minimize toxicity while ensuring efficient binding and a minimal amount of unbound fatty acids. The final DMSO concentration during cell culture comprised 0.1%. After 21 days of culture, WJ-MSCs were harvested by trypsinization and centrifuged. The pellets were washed once with PBS and stored at − 80 °C for subsequent qPCR analysis. The other part of cell cultures was used for Nile red staining and TG content determination.
Nile red staining and fluorescence microscopy
MSCs were fixed in a 4% buffered formalin for 30 min at 4 °C and stained with a Nile Red (1 µg/ml in PBS) solution (Merck KGaA) according to the manufacturer’s instructions. The cells were assessed using a fluorescent microscope (Leica, Germany).
Determination of intracellular triglyceride content
The triglyceride (TG) content in AT- and WJ-MSC culture after adipogenic differentiation was determined using the Triglycerides Quantification Kit (Thermo Fisher Scientific) according to the manufacturer’s instructions. Briefly, the adherent cells were washed twice with PBS and lysed using the lysis buffer provided in the kit, followed by incubation on ice for 10 min to ensure efficient cell disruption. The lysates were centrifuged at 12,000 × g for 10 min at 4 °C, and the supernatants were collected for analysis. Triglyceride levels were measured using a colorimetric assay in the Tecan Infinite 200 (Tecan, Männedorf, Switzerland) microplate reader at 540 nm absorbance. TG concentrations were calculated from a standard formula:
$$:TG:left(frac{mmol}{L}right)=:frac{ODSample:-:ODBlank}{ODStandard:-:ODBlank}times:Cstand:times:f$$
where
Cstand: Concentration of standard (2.26 mmol/L);
f: Dilution factor of the sample before the test (equals 1 in our experiments).
The data was presented as Mean ± SD of 4 independent donor samples assessed in duplicates.
Analysis of lipidomic profile
The lipidomic profile of cells was explored by the liquid chromatography-mass spectrometry (LC-MS) in the Service Department of Metabolomics of the Institute of Physiology of the CAS, Prague, Czech Republic. Briefly, cells were grown on 6-well plates, treated as required, quickly washed with PBS, snap-frozen, and stored at − 80 °C. Metabolites were extracted using a biphasic solvent system of cold methanol, methyl tert-butyl ether, and water39.
An aliquot of the bottom (polar) phase was collected and cleaned using an acetonitrile/isopropanol mixture. After evaporation, the dry extract was resuspended in 5% methanol with 0.2% formic acid, followed by separation in an Acquity UPLC HSS T3 column (Waters, Milford, MA, USA). Another aliquot of the bottom phase was evaporated, resuspended in an acetonitrile/water mixture, and separated in an Acquity UPLC BEH Amide column. Metabolites were detected in negative and positive electrospray ion mode (Thermo Q Exactive Plus instrumentation)40. Signal intensities were normalized to the respective total ion count (TIC) before subsequent statistical analysis.
Quantitative real-time PCR
To assess the efficacy of adipogenic differentiation, specific human marker genes were selected:
-
CEBPA(CCAAT/enhancer-binding protein alpha, Hs.PT.58.4022335.g),
-
PPARG(Peroxisome proliferator-activated receptor gamma, Hs.PT.58.25464465),
-
FABP4(Fatty Acid Binding Protein 4, Hs.PT.58.20106818),
-
LPL(Lipoprotein lipase, Hs.PT.58.45792913).
Total RNA was extracted from cell pellets using the Total RNA Purification Kit (Norgen Biotek Cor., Canada), following the manufacturer’s protocol. The concentration and purity of RNA were assessed using a NanoDrop™ 2000/2000c Spectrophotometer (Thermo Fisher Scientific). The RNase-Free DNase I Kit (Norgen Biotek Corp., Canada) was used to improve RNA purity. RNA samples with an absorbance ratio (A260/A280) between 1.9 and 2.1 were used for subsequent experiments.
For the quantitative conversion of RNA into single-stranded cDNA, we applied a High-Capacity cDNA Reverse Transcription Kit (Thermo Fisher Scientific). RNA samples were normalized to the same amount of input RNA for reverse transcription. Reverse transcription was performed using the C1000 Touch™ Thermal Cycler (Bio-Rad, USA) set to these conditions: 25 °C for 10 min, 37 °C for 120 min, 85 °C for 5 min, and 4 °C for the end.
Quantitative real-time PCR was carried out using the CFX384 Touch Real-Time PCR Detection System (Bio-Rad, USA) following these cycling conditions: initial denaturation at 95 °C for 30 s, followed by 44 cycles of denaturation at 95 °C for 5 s, and annealing at 60 °C for 30 s extension for 72 °C for 10 s.
The following primer pairs (PrimeTime® qPCR Primers, IDT) were used in the study:
|
Genes |
Forward primers (5´-3´) |
Reverse primers (5´-3´) |
|---|---|---|
|
CEBPA |
CCACGCCTGTCCTTAGAAAG |
CCCTCCACCTTCATGTAGAAC |
|
PPARG |
GTTTCAGAAATGCCTTGCAGT |
GGATTCAGCTGGTCGATATCAC |
|
LPL |
GAGAAGCTATCCGCGTGA |
CCTTGGAACTGCACCTGTAG |
|
FABP4 |
ACTTGTCTCCAGTGAAAACTTTG |
ATCACATCCCCATTCACACT |
|
PPIA |
GTGGCGGATTTGATCATTTGG |
CAAGACTGAGATGCACAAGTG |
The expression of target genes was normalized to PPIA, which was selected as the housekeeping gene due to its stable expression across conditions.
Statistical analysis
Multivariate analysis of lipidomic data was performed in MetaboAnalyst 5.029. Shares of fatty acids and various TG species in non-induced WJ-MSCs and AT-MSCs were compared using an unpaired t-test. For multiple group comparisons in experiments involving induced cell cultures, ordinary one-way ANOVA followed by Sidak’s post hoc test was performed. Data analysis and visualization were done using Prism 10.2.3. Statistically significant p-values are presented in figures as follows: *p < 0.05, **p < 0.01, ***p < 0.001, ****p < 0.0001.