This section outlines the deception detection methodology proposed in this study. It discusses the traditional SQM metrics, as well as the MuSD and MuSDA metrics and their threshold calculation methods. Additionally, the computation process of the WMA-BC algorithm is also examined.
Spoofing detection process
The spoofing detection process (Fig. 2) follows a sequential workflow: First, the GNSS receiver demodulates the intermediate frequency (IF) signal. Then, multiple correlators process this signal to generate correlator outputs, which are used to calculate two key metrics—MuSDA and MuSD. These metrics undergo further processing through the WMA-BC algorithm for enhanced detection capability. Finally, the processed metric values (M_{x}) are compared against thresholds (theta_{x}) for spoofing signals to determine whether the received signal is authentic or spoofed.
Flowchart of WMA-BC for GNSS spoofing detection.
Expressions of the monitoring metrics
Monitoring metrics utilize the correlator output parameter with different composition methods to detect spoofing signals. To understand the metrics, the statistical characteristics must be known. The mean value and noise variance of the metrics can be obtained through calculations, and differences in the signal-to-noise ratio, correlation integral time, and correlator positions can change the noise variance of the metrics. We considered six SQM metrics for comparison: the ELP, ratio, delta, double delta, slope, and double slope metrics. The detailed derivation of the noise variance of each metric is presented in the Appendix.
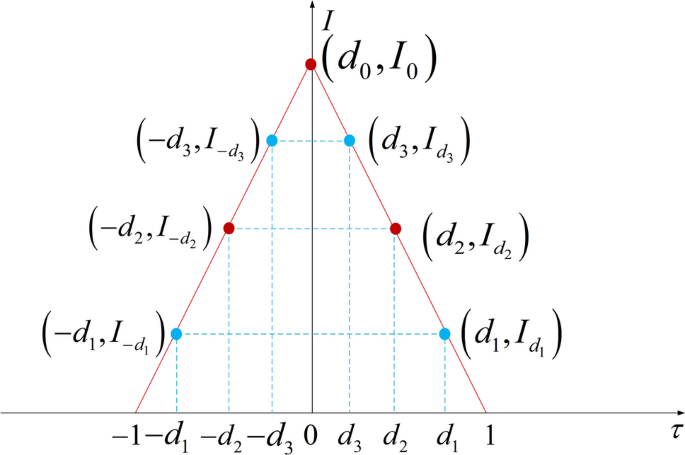
Table 1 summarizes the definitions and statistical characteristics of the SQM metrics. ({{I_{E} } mathord{left/ {vphantom {{I_{E} } {Q_{E} }}} right. kern-0pt} {Q_{E} }}) and ({{I_{L} } mathord{left/ {vphantom {{I_{L} } {Q_{L} }}} right. kern-0pt} {Q_{L} }}) are the values of the early/late correlator in the in-phase/quadrature correlators, where (E) and (L) are 0.5 and -0.5, respectively. (I_{0}) denotes the output value of the maximum correlator; (I_{{d_{1} }}), (I_{{d_{2} }}), (I_{{ – d_{1} }}) and (I_{{ – d_{2} }}) are the output values of the additional correlators, where the negative sign represents early and no negative sign represents late, (d) denotes the spacing between the correlators and the maximum correlator, and the numbers are used as identifiers. The unit of (d) is chips.
MuSD and MuSDA metrics
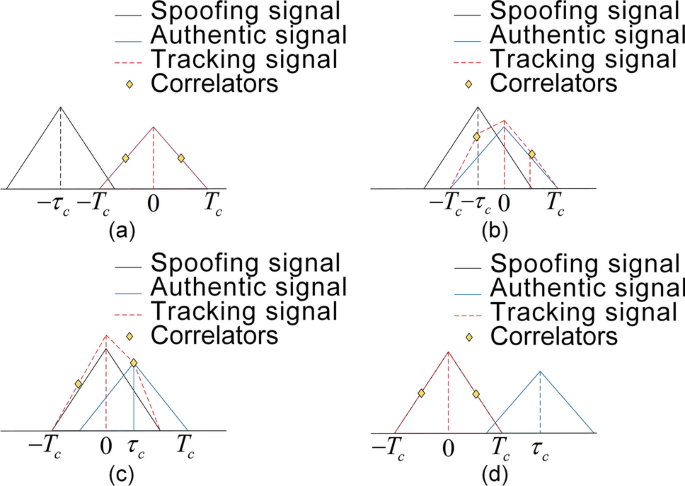
This section describes the NeSD, MiSD, FaSD, MuSD, and MuSDA metrics. Correlators at different locations have distinct offset detection advantages. NeSD, MiSD, and FaSD have complementary properties because the correlators used are at specific locations. However, relying solely on the correlators used by NeSD, MiSD, or FaSD to obtain spoofing detection results is unreliable. MuSD and MuSDA effectively utilize all the different correlators used by NeSD, MiSD, and FaSD by aggregating slope information from correlators at different offsets. This method leverages this diversity to build a more comprehensive signal integrity profile, efficiently increasing the spoofing detection range and preventing, slope, ratio, and ELP from effectively detecting only significant changes at the top or both sides of the correlation peak.
The correlators needed to construct the metrics are shown in Fig. 3. The MiSD correlator (d_{2} = 0.5) chips, which is the (E – L) correlator of the receiver, and (d_{0} = 0) chips, which is the prompt correlator of the receiver. The NeSD and MiSD correlators are located on either side of the (E – L) correlator. The correlator spacing is (d_{1} > d_{2} > d_{3} > d_{0}) , which is determined based on the offset detection advantages of using correlators at different locations.
Correlator locations for NeSD, MiSD, FaSD, MuSDA and MuSD. The blue dots indicate added correlators, and the red dots indicate the original E, L, P correlators of the receiver.
The (d_{3}) correlator of NeSD is effective for monitoring the ACF near-point distortion by very small code phase difference spoofing and low power spoofing due to its proximity to the prompt correlator. The NeSD can be expressed as
$$M_{NeSD} = frac{{I_{{ – d_{3} }} – I_{0} – left( {I_{0} – I_{{d_{3} }} } right)}}{{I_{0} }}$$
(10)
Intermediate code phase difference spoofing causes ACF distortion near the correlator, reducing the spoofing detection capability of NeSD for middle and far distortion points. MiSD utilizes the receiver’s original (E – L) correlator to supplement the NeSD performance. The metric is defined as
$$M_{MiSD} = frac{{I_{{ – d_{2} }} – I_{0} – left( {I_{0} – I_{{d_{2} }} } right)}}{{I_{0} }}$$
(11)
Due to correlation limitations, NeSD and MiSD have difficulty detecting small ACF distortions at far points. Thus, to prevent spoofing leakage detection, the far point correlator (d_{1}) is deployed beyond the (E – L) correlator, and the FaSD metric is defined as follows:
$$M_{FaSD} = frac{{I_{{ – d_{1} }} – I_{0} – left( {I_{0} – I_{{d_{1} }} } right)}}{{I_{0} }}$$
(12)
MuSD is a joint decision metric that is not directly obtained by the correlators but is jointly determined by the NeSD, MiSD, and FaSD results through logical association operations. The MuSD metric is expressed as follows:
$$H_{MuSD} { = }left{ {begin{array}{*{20}c} {H_{1} , , H_{NeSD} cup H_{MiSD} cup H_{FaSD} } \ {H_{0} ,{text{ others }}} \ end{array} } right.$$
(13)
where (H_{SDN}), (H_{SDI}), and (H_{SDF}) are the NeSD, MiSD, and FaSD decision results, respectively.
The MuSDA metric is derived from the receiver’s E, L, and P correlators, as well as additional correlators, using the mean-value difference method, and the MuSDA metric is defined as
$$M_{MuSDA} = sumlimits_{i = 1}^{3} {left| {frac{{I_{{ – d_{i} }} – I_{0} – left( {I_{0} – I_{{d_{i} }} } right)}}{{3I_{0} }}} right|}$$
(14)
MuSD and MuSDA use the same correlator and can therefore be used simultaneously to detect spoofing.
Theoretical thresholds and decision rules for metrics
The threshold for the metrics can be adaptively calculated based on the desired false alarm rate and the statistical characteristics. For satellite navigation signals, the hypothesis testing theory of signal processing is used to identify spoofing signals, with a null hypothesis (H_{0}) indicating that no spoofing signal exists and an alternative hypothesis (H_{1}) indicating that a spoofing signal exists. Assuming that the probability density function of the noise in the case of (H_{0}) follows a normal distribution with mean (mu_{x}) and standard deviation (delta_{x}), the false alarm rate (P_{fa}) is expressed as
$$P_{fa} = rho (left| {M_{x} } right| > left. {theta_{x} } right|H_{0} ) = int_{{theta_{x} }}^{infty } {frac{1}{{sqrt {2pi } delta_{x} }}e^{{ – frac{{(x – mu_{x} )^{2} }}{{2delta_{x}^{2} }}}} dx}$$
(15)
Assuming that (t = {{left( {x – mu_{x} } right)} mathord{left/ {vphantom {{left( {x – mu_{x} } right)} delta }} right. kern-0pt} delta } = {{left( {theta_{x} – mu_{x} } right)} mathord{left/ {vphantom {{left( {theta_{x} – mu_{x} } right)} delta }} right. kern-0pt} delta })
$$begin{gathered} P_{fa} = rho (left| {M_{x} } right| > left. {theta_{x} } right|H_{0} ) = int_{{frac{{theta_{x} – mu_{x} }}{{delta_{x} }}}}^{infty } {frac{1}{{sqrt {2pi } }}e^{{ – frac{{t^{2} }}{2}}} dt} hfill \ { = }qleft( {frac{{theta_{x} – mu_{x} }}{{delta_{x} }}} right) = frac{1}{2}erfcleft( {frac{{theta_{x} – mu_{x} }}{{sqrt 2 delta_{x} }}} right) hfill \ end{gathered}$$
(16)
where (q(x) = int_{x}^{infty } {{1 mathord{left/ {vphantom {1 {left( {2pi } right)^{{{1 mathord{left/ {vphantom {1 2}} right. kern-0pt} 2}}} exp left[ {{{ – t^{2} } mathord{left/ {vphantom {{ – t^{2} } 2}} right. kern-0pt} 2}} right]dt}}} right. kern-0pt} {left( {2pi } right)^{{{1 mathord{left/ {vphantom {1 2}} right. kern-0pt} 2}}} exp left[ {{{ – t^{2} } mathord{left/ {vphantom {{ – t^{2} } 2}} right. kern-0pt} 2}} right]dt}}}) is the complementary cumulative distribution function of the standard normal distribution and (erfc(x) = {2 mathord{left/ {vphantom {2 {pi^{{{1 mathord{left/ {vphantom {1 2}} right. kern-0pt} 2}}} }}} right. kern-0pt} {pi^{{{1 mathord{left/ {vphantom {1 2}} right. kern-0pt} 2}}} }}int_{x}^{infty } {exp left[ { – t^{2} } right]} dt) is the complementary error function. For all of the metrics, the threshold (theta_{x}) can be expressed as
$$theta_{x} = sqrt 2 sigma_{x} erfc^{ – 1} (2P_{fa} ) + mu_{x}$$
(17)
where (erfc^{ – 1} (x)) is the inverse function of (erfc).
The false alarm rate can be flexibly adjusted according to the specific requirements of different application scenarios. For instance, high-risk scenarios may tolerate a slightly higher false alarm rate to ensure critical events are not missed, whereas low-risk applications require stricter control over the false alarm rate to avoid unnecessary disruptions.
Similarly, the detection rate can be expressed as
$$P_{d} = rho (left| {M_{x} } right| > left. {theta_{x} } right|H_{1} )$$
(18)
In the spoofing monitoring process, the decision is divided based on the results of the comparison between the metric measurement and its threshold. The discriminant is as follows:
$$H_{decition} { = }left{ {begin{array}{*{20}c} {H_{1} {, }left| {M_{x} } right| > left| {theta_{x} } right|} \ {H_{0} {text{, others }}} \ end{array} } right.$$
(19)
If the metric measurements exceed the thresholds, there is a spoofing signal; otherwise, there is no spoofing signal.
Weighted moving average bias correction
Noise, spoofing signals and other interference sources all cause transient or short-term fluctuations in metric data. When the spoofed signal operates in the frequency unlocking mode, the relative carrier phases of the real and spoofed signals change over time, leading to significant oscillations in the monitoring metrics and causing unnecessary false alarms33. To reduce the influence of noise interference, we propose the weighted moving average bias correction algorithm, which can be applied to metric data. This approach considers recent data obtained over time, smooths the curve of the monitoring data, reduces the influence of random interference, and improves the robustness and detection performance of the metrics. This subsection describes the computational process and analyzes the simulation results obtained with this method. The traditional weighted moving average algorithm (WMA) expression is
$$P_{t} = beta P_{t – 1} + (1 – beta )M_{t}$$
(20)
where (P_{t}) and (P_{t – 1}) are the predicted values of the monitoring data at moments (t) and (t – 1) , respectively.(M_{t}) is the measured value at moment (t), where (beta) represents the rate of the decay weights, and its expression is
$$beta = 1 – frac{1}{{T_{c} }}$$
(21)
The moving window size in the WMA-BC algorithm is directly related to the receiver’s PIT, as (T_{c}) represents the minimum time interval over which coherent signal accumulation occurs. Therefore, we set the window size equal to the PIT.
During the receiver’s operation, we adopt an adaptive PIT adjustment strategy based on the scene type to optimize system performance. This mechanism determines the current scene type (low-speed/static or dynamic) by analyzing the Doppler rate (Delta {text{f}}) of change and dynamically adjusts the PIT. When the Doppler rate of change is less than or equal to 2 Hz/s, the system identifies the scene as low-speed/static, and the PIT is set to 10 ms to save computational resources and improve response speed. When the Doppler rate of change exceeds 2 Hz/s, the system identifies the scene as dynamic, and the PIT is adjusted to 100 ms to accommodate environments with large frequency fluctuations. The PIT can be expressed as:
$$T_{c} = left{ {begin{array}{*{20}c} {10 , ms, , Delta {text{f}} le {text{2 Hz/s}}} \ {100 , ms, , Delta {text{f > 2 Hz/s }}} \ end{array} } right.$$
(22)
According to (20), we obtain the following expression:
$$P_{t} = (1 – beta )left[ {M_{t} + beta M_{t – 1} + beta^{2} M_{t – 2} + beta^{3} M_{t – 3} ldots + beta^{t – 1} M_{1} } right]$$
(23)
The WMA algorithm smooths ACF data by averaging past observations, giving more weight to recent data. While this reduces jitter, it can introduce bias due to small initial values. To address this, we propose the WMA-BC algorithm, which adds a bias correction step to reduce the discrepancy between smoothed and actual values, improving prediction accuracy. The WMA-BC algorithm is as follows:
$$P_{{biased_{t} }} = frac{{P_{t} }}{{1 – beta^{t} }}$$
(24)
where (P_{{biased_{t} }}) is the weighted moving average bias correction, (P_{t}) is the predicted weighted moving average.
Experimental results and discussion
Performance of the WMA-BC algorithm
To evaluate the performance of the WMA-BC algorithm, we conducted experiments on the TEXBAT dataset. In the TEXBAT dataset, Cases 2–8 are examples of synchronized spoofing intrusions, while Case 1 is an example of spoofing switching34.
In Case 2, the spoofed signal has a higher power (+ 10 dB) than does the authentic signal, and the spoofers operate in frequency-unlocked mode (the carrier phase difference between the spoofed and authentic signals is not fixed). Case 3 differs from Case 2 in that the spoofed signal operates in frequency-locked mode (the carrier phase difference between the spoofed and authentic signals is fixed), and the power is reduced from 10 dB to 1.3 dB.
We compared the spoofing detection rates of SQM metrics using WMA-BC, WMA, MA-based, and MV-based algorithms, as well as MuSDA and MuSD metrics in Case 2 (Fig. 4(a)) and Case 3 (Fig. 4(b)). The spoofing detection times ranging from 60 to 300 s and the predetection integration time (T_{c} = 100ms), and (P_{fa} le 10^{ – 7}). The detection rate is defined as
$${text{detection rate}} = frac{{text{Samples that exceed the detction threshold}}}{{text{Samples in which deception exists}}}$$
(25)
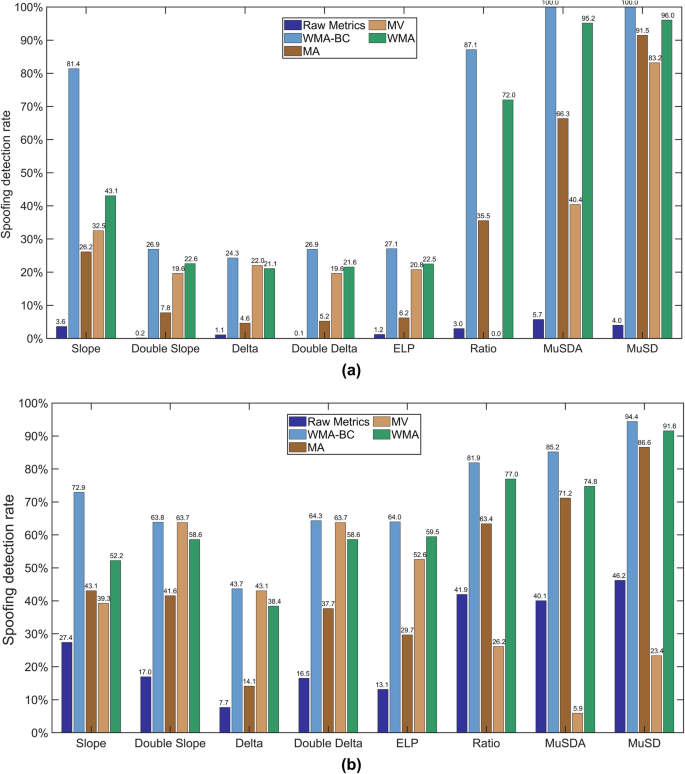
(a) Detection rates of the SQM MuSDA and MuSD metrics with the WMA-BC algorithm. (Case 2,(T_{c} = 100ms), and (P_{fa} le 10^{ – 7}) ). (b) Detection rates of the SQM MuSDA and MuSD metrics with the WMA-BC algorithm. (Case 3,(T_{c} = 100ms), and (P_{fa} le 10^{ – 7}) ).
In Case 2, the detection rates of the metrics obtained based on the WMA-BC algorithm are all improved, but the effect differs for different metrics, with the detection rates of the slope, ratio, MuSDA and MuSD metrics significantly improved by more than 70%. As the detection rates of the double slope, delta, double delta, and ELP metrics were originally close to 0, the improvement in the detection rate was limited. Case 3 shows results similar to those of Case 2; the metrics obtained based on the WMA-BC algorithm have higher detection rates, and the detection rates of the metrics improve by approximately 22% to 53%.
Experimental data analysis shows significant performance differences among the four methods in the spoofing detection task. In Case 2 testing, the WMA-BC method performed the best, achieving detection rates of 100% and 81.4% for the MuSDA and slope metrics, respectively, which represents an improvement of 4.8% and 38.3% compared to the WMA algorithm. In comparison, the MA method only reached 66.3% and 26.2%, while the MV method achieved 40.4% and 32.5%. Notably, the MV method completely failed on the ratio metric (0% detection rate), whereas WMA-BC maintained an effective detection rate of 87.1%, which is an improvement of 15.1% compared to WMA.
Further analysis of the Case 3 data reveals that the advantage of WMA-BC is even more pronounced on the slope metric, where its detection rate was more than 30% higher than both the MA and MV methods, with an improvement of about 5% to 20% compared to the WMA method. This method also maintained stable performance on the double slope, delta, MuSDA, and MuSD metrics, demonstrating strong overall performance. In contrast, while the MA method performed reasonably well on the ratio and MuSD metrics, it achieved only a 14.1% detection rate on the delta metric, showing clear performance limitations. The MV method exhibited unbalanced characteristics: it performed excellently on the double slope (63.7%), double delta (63.7%), and ELP (52.6%) metrics but underperformed on key metrics such as ratio (26.2%), MuSDA (5.9%), and MuSD (23.4%).
Overall, WMA-BC demonstrated clear advantages over WMA, MV and MA in terms of performance. The superior performance of WMA-BC is primarily attributed to its weighted computation mechanism, which dynamically adjusts weights over time, effectively enhancing feature differentiation. In contrast, the MA method, due to its simple mean calculation, is prone to losing crucial temporal information. The MV method, which treats all data points within the window equally, cannot implement variance calculations that incorporate features such as exponential decay weights, which are more suited to time-series characteristics, resulting in insufficient performance.
Quantitative analysis demonstrates that WMA-BC significantly enhances the discriminative capability of embedded GNSS systems, achieving more than a 70% improvement in detection rate for key signal metrics. For instance, in Case 2, the Slope metric shows a remarkable increase from 3.6% (raw metric) to 81.4% with WMA-BC, outperforming the MA approach at 26.2% and the MV method at 32.5%.
Despite the computational burden associated with multi-correlator architectures, such as MuSDA/MuSD, which require around 750 M floating-point operations per second (FLOPs), including an overhead of 200 M FLOPs due to additional correlators—WMA-BC introduces only a minimal overhead of 0.50 M FLOPs (just 0.07% of the baseline), along with an additional 48 kB of RAM usage (Table 2).
This efficiency makes WMA-BC, along with MuSD and MuSDA metrics, highly suitable for deployment on resource-constrained embedded platforms. For example, when implemented on the TMS320C6748 processor (clocked at 456 MHz with a peak performance of 3648 MFLOPs and a typical power consumption of 1.1W), the added computational load is relatively small, representing less than 5.5% of the total processing capacity. Moreover, WMA-BC maintains linear time complexity O(n), ensuring robust scalability for real-time applications—unlike MV, which has O(n2) complexity and incurs a 13 M FLOP overhead, approximately 72 times greater than that of WMA-BC.
These findings underscore WMA-BC’s unique ability to balance robust spoofing detection with stringent resource efficiency, fulfilling the demanding requirements of real-time GNSS spoofing detection systems in resource-constrained environments.
We calculated and plotted the receiver operating characteristic curves for Case 2 (Fig. 5(a)) and Case 3 (Fig. 5(b)), and performed statistical analysis (Table 3). In the experiments, (P_{d}) and (P_{fa}) were measured by continuously decreasing the metric thresholds. We evaluated the AUC, which is an important parameter for detection performance.
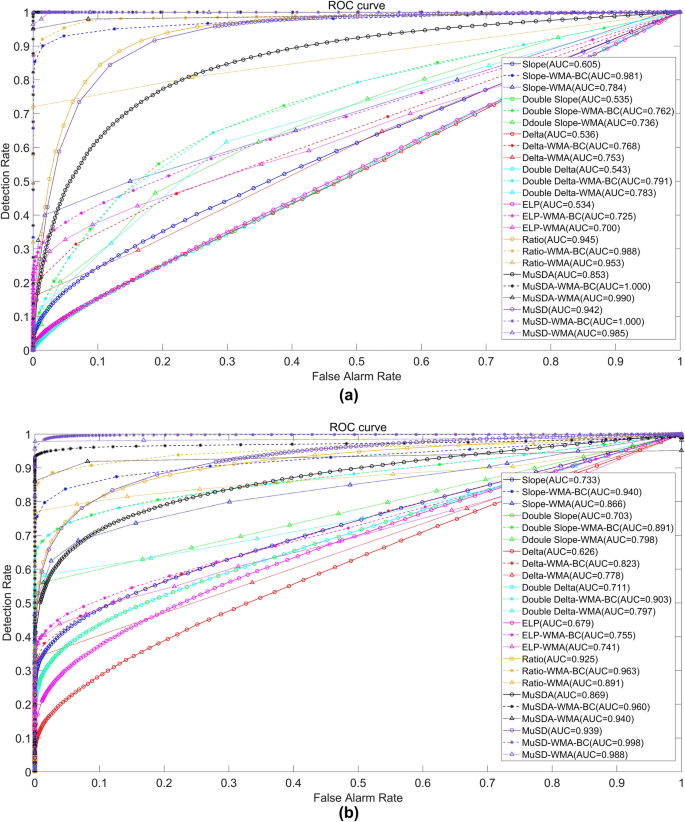
(a) Comparison of ROC curves for different metrics (Case 2). The solid lines with circles represent curves obtained without the WMA-BC algorithm, the dashed lines with asterisks represent curves obtained based on the WMA-BC algorithm, and the dot with a triangle indicates the curve obtained based on the WMA algorithm. (b) Comparison of ROC curves for different metrics (Case 3). The solid lines with circles represent curves obtained without the WMA-BC algorithm, the dashed lines with asterisks represent curves obtained based on the WMA-BC algorithm, and the dot with a triangle indicates the curve obtained based on the WMA algorithm.
In Case 2, the AUC values of the metrics obtained based on the WMA-BC algorithm are markedly larger than those of the metrics obtained without the WMA-BC algorithm and those using the WMA algorithm. The AUC area with the WMA-BC algorithm increased by 0.01 to 0.197 compared to the WMA algorithm, and increased by 0.043 to 0.376 compared to the original metrics. Additionally, the MuSDA metric obtained based on the WMA-BC algorithm has an AUC equal to 1, demonstrating a 100% detection rate with no false alarms. In Case 3, the AUC area of the metrics combined with the WMA-BC algorithm increased by 0.01 to 0.072 compared to the WMA algorithm, and the AUC increased by 0.038 to 0.207 compared to the original metrics, which also indicates that these metrics achieved stronger detection capabilities.
In summary, the WMA-BC algorithm-based metrics achieve enhanced spoofing detection rates and superior performance with minimal computational overhead. The GNSS receiver thereby attains improved ROC performance—regardless of whether spoofing signals operate in frequency-locked or frequency-unlock modes, and irrespective of spoofing signal power being higher than or approximately equal to authentic signals.
Spoofing detection experiments with different code phase offsets and carrier phase offsets
To examine the detection performance of various metrics in synchronized spoofing against different code phase offsets and carrier phase offsets (based on the WMA-BC algorithm), we perform experiments by simulating a GPS satellite with the following signal simulation parameters: ({C mathord{left/ {vphantom {C {N_{0} }}} right. kern-0pt} {N_{0} }}) is 45 dB, the C/A code phase difference (mathop tau limits^{ sim } = left| {tau_{s} – tau_{a} } right|) between the authentic signal and the spoofing signal ranges from 0 to 1 chip, with a step size of 0.005 chips, and carrier phase difference (mathop {theta_{s} }limits^{ sim } = left| {theta_{s} – theta_{a} } right|) ranges from 0 to 2π, with a step size of 0.1π, for a total of 4221 grid experiments. Due to the high similarity between spoofing signals and authentic signals in the experiment, and considering the tracking stability of the receiver and the timeliness of spoofing detection, (T_{c}) is 10 ms. The correlators used to obtain the MuSD and MuSDA metrics in the experiments are (d_{1} = 0.9) chips, (d_{2} = 0.5) chips, and (d_{3} = 0.1) chips.
The spoofing detection rates at the experimental grid points are demonstrated in Fig. 6, where the grid color indicates the spoofing detection probability. Each grid represents the detection rate in one experiment, and (P_{fa} le 10^{ – 7}), which can effectively reflect the detection sensitivity of the metrics obtained in each experiment. The detection rates of some metrics decrease in cases with long intrusion times, such as the slope, double slope, delta, and double delta metrics. This is because in the early stage of the spoofing attack, the output values of the early and late correlators change or differ significantly, and the detection difficulty is small. However, in the spoofing attack of the middle or late stages, the change in the output values of the early and late correlators decreases, and the detection difficulty increases. However, the MuSD and MuSDA metrics are obtained using multiple correlators, which can monitor small fluctuations in bilateral slopes at multiple points simultaneously, ensuring high sensitivity and detection rates.
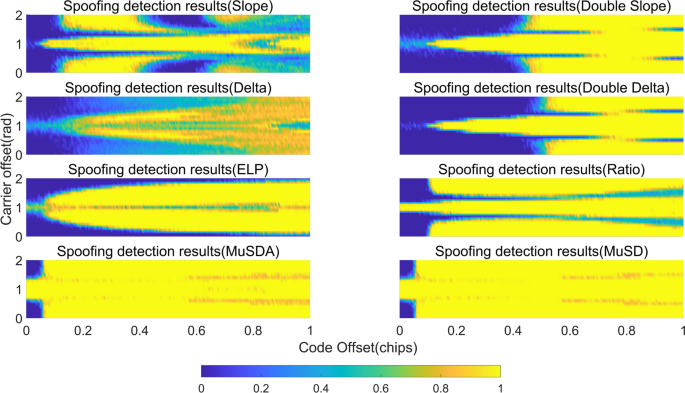
Detection rate of each metric in different code phase shift and carrier phase shift spoofing experiments. The code phase offset (mathop tau limits^{ sim }) ranges from 0 to 1 chip, and the carrier phase shift (mathop {theta_{s} }limits^{ sim }) ranges from 0 to 2π ((P_{fa} le 10^{ – 7})).
To evaluate the detection performance of the metric more objectively, we evaluated the detection coverage of each metric. The detection coverage is the ratio of the detectable area to the total area in a certain detection region. This value is a more comprehensive reflection of the performance of the metrics. The result of each experiment is 1 unit, and the total number of units is 4221. The detection coverage is defined as
$${text{detection coverage}} = frac{{text{Detectable area }}}{{text{Total area}}}$$
(26)
The detectable area in (26) is the sum of the detectable grid points, and we set a minimum acceptable detection rate of (P_{{d_{min } }}). If (P_{d} le P_{{d_{min } }}), the grid is undetectable, and its grid value is recorded as 0; otherwise, the grid value is set as 1.
Figure 7 shows the detection coverage of each metric when the minimum acceptable detection rate is set to 0.8. The yellow region in the figure represents the detectable region ((P_{d} ge 80%)), and the blue region represents the undetectable region. For both the slope and delta metrics with two correlators and the double slope and double delta metrics with four correlators, the detectable area is smaller than that of the other metrics, and the detection coverage is less than 60%. For the ELP and ratio metrics, undetectable grids are found at their edges or at the center in more places. In contrast, the MuSD and MuSDA metrics have mainly detectable areas, except for the undetectable areas at the edges of (mathop tau limits^{ sim } le 0.055) and (left{ {begin{array}{*{20}c} { , 0 le mathop {theta_{s} }limits^{ sim } le 0.6pi } \ {1.4pi le mathop {theta_{s} }limits^{ sim } le 2pi } \ end{array} } right.). The existence of this blind spot arises from the fact that when the code/carrier phase shift of the deception signal is extremely small, its impact on the correlation peak of the real signal is negligible, typically manifesting as a very weak “boost” or “distortion.”
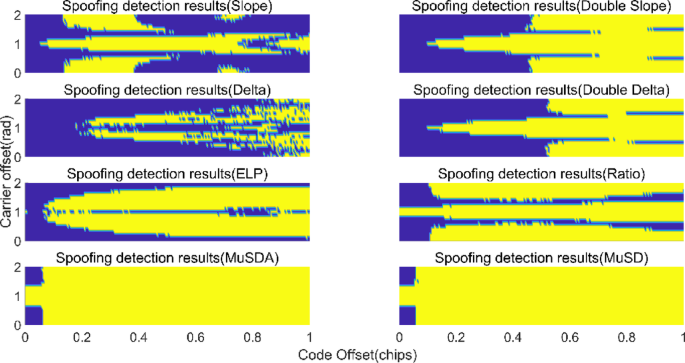
Detectable region of each metric in different code phase shift (mathop tau limits^{ sim }) and carrier phase shift (mathop {theta_{s} }limits^{ sim }) spoofing experiments. ((P_{min } = 80%)).
Under the stable operation of the receiver, the receiver experiences fluctuations such as thermal noise and quantization noise, which are very similar to the changes caused by spoofing signals. The adaptive threshold (theta_{x}) we set has a statistical fluctuation offset range given by
$$offset = sqrt 2 sigma_{x} erfc^{ – 1} (2P_{fa} )$$
(27)
When the spoofing signal is extremely similar to the true signal, the metric shift (Delta x) caused by the spoofing signal is very small, and the subtle changes induced by the spoofing signal are easily masked by the inherent noise. The expression is:
$$Delta x = left| {M_{spoofing} – mu_{x} } right|$$
(28)
where (M_{spoofing}) is the measured metric’ value when spoofing is present. Its shift mainly comes from the minor distortions of the signal generator and the additional noise introduced by the spoofing signal itself. When the metric shift (Delta x) caused by the spoofing signal is less than or equal to the statistical fluctuation range (offset) , the receiver cannot effectively detect the spoofing, leading to a detection blind spot.
The detection coverage of the eight detection metrics is summarized (Fig. 8), and the performance of the metrics can be ranked as follows: delta (26.4%) < slope (37.4%) < double delta (52.4%) < double slope (58.3%) < ELP (61.1%) < ratio (73.3%) < MuSDA (95.8%) < MuSD (96.1%). MuSD has the highest detection coverage of 96.1%, and MuSDA has a slightly lower detection coverage than the MuSD metric, with a value of 95.8%, which is approximately 22% to 69% higher than that of the other metrics. These results show that MuSDA and MuSD possess smaller blind zones and outperform the other metrics in terms of code phase offset and carrier phase offset detection.
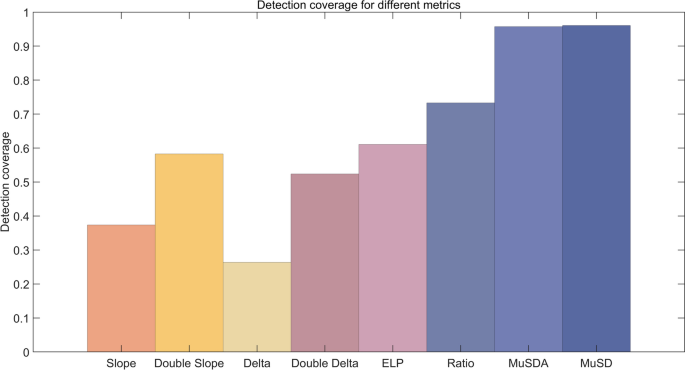
Detection coverage of different metrics ((P_{min } = 80%)).
We evaluated the performance of MuSD under different correlator spacing combinations (Table 4). The experimental results show that as (d_{1}) decreases and (d_{3}) increases (with the receiver’s inherent correlator spacing (d_{2} = 0.5)), the detection coverage of MuSD decreases significantly. In this experiment, the configuration (d_{1} = 0.9), (d_{2} = 0.5), and (d_{3} = 0.1) achieved the highest detection coverage (95.8%). This result indicates that this configuration effectively ensures high detection coverage of MuSD across different code phase offset and carrier offset experiments, demonstrating the strongest robustness.
Test with the TEXBAT dataset
To further validate the performance of the metrics (based on the WMA-BC algorithm), we used seven spoofing intrusion cases from the TEXBAT dataset as tests. The battery can be considered the data component of an evolving standard meant to define the notion of spoof resistance for civil GPS receivers. According to this standard, successful detection of or imperviousness to all spoofing attacks in TEXBAT, or a future version thereof, could be considered sufficient to certify a civil GPS receiver as spoof resistant34. It includes dynamic, static, power matching, carrier/code phase matching, and other scenarios (Table 5), among which the challenge of spoofing detection on a dynamic platform is to distinguish spoofing effects from natural fading and multipath.
We detected the signals from 60 to 300 s for each case (240 s in total) and selected the period from 120 to 300 s (spoofing intrusion phase) to calculate the spoofing detection rate. The PIT was set to (T_{c} = 100ms), and the false alarm rate (P_{fa} le 10^{ – 7}).
Through experiments based on the TEXBAT dataset, we visualized the detection rate for each metric (Fig. 9) and performed statistical analysis (Table 6). This result reflects the detection effectiveness in defending against deceptive intrusions. Case 2 is a time-specific attack. The detection rates of the slope, ratio, MuSDA, and MuSD metrics are relatively high, reaching greater than 80%, with MuSDA and MuSD reaching 100%. In contrast, the detection rates of the double slope, delta, double delta, and ELP metrics are not more than 25%. Case 3 is the same as Case 2 except that the power difference between the spoofed and authentic signals is reduced from 10 dB to 1.3 dB, and the spoofers operate in frequency-locked mode. The frequency-locked mode increases the change in the correlator detection value, which is favorable for spoofing detection. The detection rates of the double slope, delta, double delta, and ELP metrics are improved in this case, and the ratio, MuSDA, and MuSD metrics maintain high detection rates of 81.9%, 85.2%, and 94.4%, respectively. Case 4 is the same as Case 3 except that the power difference between the spoofed and authentic signals is reduced (from 1.3 dB to 0.4 dB), and the spoofed signals are position offset-type spoofs. Compared to the results in Case 3, the detection rates of the metrics decrease, while the MuSDA and MuSD metrics still maintain high detection rates of 92.9% and 99.1%, respectively. Case 5 is similar to Case 2, except that the receiver platform is changed from static to dynamic, and obvious changes in the power and phase values occur, making spoofing detection more difficult. The detection rates of the double slope, delta, and double delta metrics are close to 0 in this case. The detection rates of the slope and ratio metrics decrease to 10.3% and 48.7%, respectively, while the MuSDA and MuSD metrics maintain high detection rates of 97.6% and 99.9%, respectively. Case 6 is similar to Case 4, except that the receiver platform is changed from static to dynamic. In Case 6, the detection rates of the various metrics show different degrees of change, with the slope, double slope, delta, double delta, ELP, ratio, MuSDA, and MuSD metrics obtaining detection rates of 20%, 55.3%, 22.5%, 53.6%, 4.9%, 63.7%, 76.1%, and 98.8%, respectively. Case 7 is similar to Case 3, except that a carrier phase alignment strategy is implemented for the spoofed signals. In this case, the delta metric has a detection rate of 0%, the ELP metric has a detection rate of only 1.8%, the slope, double slope, and double delta metrics have detection rates between 50 and 51%, and the MuSDA and MuSD metrics have detection rates of 62.9% and 63.8%, respectively. In Case 8, zero-delay security code estimation and replay attacks are used. In this case, compared to those of Case 7, the double slope and ELP metrics still perform poorly, with detection rates of approximately 0, and the detection rates of the slope and ratio metrics decrease by 13.6% and 13.1%, respectively. The detection rates of the double slope, double delta, MuSDA, and MuSD metrics remain approximately unchanged, with MuSD showing the best detection rate of 63.3%.
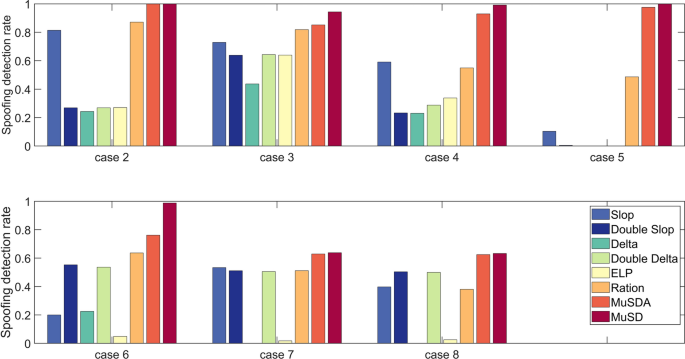
Detection rates of the different metrics based on the TEXBAT dataset (Cases 2 to 8). (T_{c} = 100ms),(P_{fa} le 10^{ – 7}).
Overall, among the eight metrics considered in the experiments, the MuSD and MuSDA obtained the best detection performance, showing the highest detection rates in all the experiments. The ratio and slope metrics showed the next best detection performance; although their detection capability was not as good as that of the MuSD and MuSDA metrics, they obtained good detection rates in all the cases. In contrast, the double delta, double slope, delta, and ELP metrics performed poorly, with detection rates close to 0 in some cases. The reason is that MuSD and MuSDA exploit advantages including the offset detection capability of complementary correlators, which comprehensively improves the detection capability of time-type and location-type spoofing signals, such as phase shifts, power suppression, and Earth-centered Earth-fixed coordinate deviations. It also solves the problem in that other metrics are not effective in detecting highly similar spoofing (the code phase, the carrier phase, and power are all very close), improving the spoof detection ability.