Performance characteristics of engine with and without coating
Brake thermal efficiency [BTE
The ratio of an engine’s output power to its chemical energy input from the fuel and air supply is known as its thermal efficiency. BTE also considers combustion efficiency, highlighting that not all the chemical energy of the fuel is transformed into heat energy during combustion. Figure 6(a–f) depict the variations in BTE at different CRs (16, 17.5, and 19 CR) for diesel and various blends. The analysis examines the increase in load for engines with both coated and uncoated components. The findings show that BTE progressively rises with increasing load for both diesel and SOME blends in Uncoated Engine (UCE) and Thermal Barrier Coated Engine (TBCE), due to increased fuel supply and decreased heat loss. At first, it was found that thermal efficiency remained similar to diesel when the amount of biodiesel in the fuel mixture was reduced. However, as the blend percentage of SOME exceeds 30% by volume, BTE consistently decreases under all load conditions compared to diesel. This trend is due to inadequate atomization, reduced vaporization, and suboptimal combustion caused by the higher density, viscosity, and lower volatility of SOME3. As illustrated in Fig. 6(a–c), increasing the engine’s compression ratio is associated with higher BTE for all tested fuels. This aligns with the principle that BTE tends to increase with compression ratio, as supported by previous research. When the CR increased from 16 to 17.5, the average BTE rise by 3.63%, 3.45%, 2.85%, 2.33%, 1.51%, and 3.66%, and when increased from 17.5 to 19, the average BTE increased by 6.38%, 6.67%, 4.01%, 3.49%, 3.45%, and 6.61% for 20%, 40%, 60%, 80%, and 100% of various biodiesel blend ratios and diesel, respectively, under operating load. Higher peak pressure, higher ID, and higher burning temperature are the causes of this improvement in BTE at higher CRs. At CR-19, the BTE for the B20 blend of SOME is the highest among all biodiesel blend samples, being only 0.307% less than pure diesel at maximum loading conditions55. Vijay Kumar et al. found that applying a 0.5 mm 3Al2O3–2SiO2 TBC in an LHR engine using Mahua Methyl Ester improved BTE by 13.65% at 25% load, enhanced SFC and BTE at full load, and reduced exhaust temperature, smoke, HC, and marginally CO emissions across all operating conditions13. Samuelraj et al. reported that Blend E, containing carbon black, n-pentanol, and soybean biodiesel, improved BTE by 4.90% and reduced BSFC by 25.31% at peak load in an LHR engine. CO, HC, NOx, and smoke emissions dropped significantly, while in-cylinder pressure and heat release rate increased by 4.52% and 8.87%, respectively, indicating enhanced combustion12. As shown in Fig. 6(d–f), BTE is higher for all test fuels in the mullite-coated engine compared to the uncoated engine at all investigated CRs. The mullite coating, with its low thermal conductivity, acts as an insulator, reducing heat loss to the coolant and surroundings, leading to more homogeneous combustion. As thermal energy accumulates in the combustion chamber, the temperature of the gas inside the cylinder and the cylinder walls rises, enhancing combustion efficiency and increasing BTE. Experimental results show that at maximum load, the BTE for the TBC-coated engine increases by 5.49%, 4.08%, 4.01%, 3.17%, 2.78%, and 6.4% at CR 17.5 and by 5.75%, 4%, 3.94%, 2.98%, 2.4%, and 7.51% at CR 19 for B20, B40, B60, B80, B100, and diesel, respectively, compared to the uncoated engine, as shown in Figure S-1. Various literature studies on biodiesel such as Rice Bran, Pongamia, Cashew Nutshell, Rubber Seed, Cotton Seed, Neem Kernel Oil, and Frying Oil used in TBC-coated engines reported an increase in BTE between 3.8% and 8.3%49.
(a–f) The variation of the BTE at various loads and CRs (16, 17.5 & 19) for SOME blends in both coated and uncoated engines.
Brake specific fuel consumption
During engine testing, fuel consumption is measured by the rate at which fuel is consumed, expressed as the mass of fuel per unit of time. BSFC measures the amount of fuel used (in g/h) to produce one unit of power (kW) and is inversely related to BTE. Figure 7(a–f) shows the variation of BSFC for both surface-treated and untreated diesel engines fueled with diesel and blends of SOME, under varying load conditions and CRs. BSFC decreases with an increase in load and CR for all samples in the uncoated engine. BSFC experiences a significant 60% reduction from no load to quarter load, with a slight decline noted at 25% load. Due to the reduced calorific value at higher blend percentages, biodiesel blends have slightly higher BSFC than pure diesel. Consequently, more fuel is required for combustion to produce 1 kW, leading to an increase in BSFC56,57. Biodiesel blends with proportions of 20%, 40%, 60%, 80%, and 100% in the uncoated engine showed an 8%, 7.69%, 7.41%, 3.44%, 6.66%, and 8% decrease in BSFC when the CR varied from 16 to 17.5, and a 4.17%, 4%, 8%, 11.53%, 7.14%, and 4.17% decrease in BSFC when the CR varied from 17.5 to 19, respectively (Fig. 7(a–c)). Increasing the CR leads to a decrease in BSFC for all samples, likely due to reduced ID and improved conversion of heat to mechanical work, resulting in smoother engine operation. The results indicate that biodiesel shows a better decrease in BSFC than diesel as the compression ratio increases, attributed to the lower volatility and higher cetane number of biodiesels, which enhance combustion at higher CRs compared to diesel45.
The variation of BSFC for the mullite-coated diesel engine at varying loads for all test samples and CRs is displayed in Fig. 7(d–f). For all test samples, mullite-coated engines had lower BSFC than the uncoated engine across all CRs and engine load. Improved heat retention in the combustion chamber raises in-cylinder gas and wall temperatures, which improves fuel burning due to heat insulation in the coated condition. The ID period lowers as LHR engine cylinder and wall temperatures rise, improving fuel atomization and air-fuel blending. Consequently, the improved combustion conditions favor reduced amounts of test fuel, positively affecting both physical and chemical delays. Comparing the coated engine to the conventional diesel engine, this causes a drop in BSFC for all test samples at different CRs. For B20, B40, B60, B80, B100, and diesel in the coated engine, BSFC decreases by 4.7%, 4%, 3.84%, 7.84%, 3.44%, and 8.69% at CR-17.5, and by 9.09%, 8.69%, 4.17%, 4%, 7.69%, and 14.28% at CR-19, respectively, compared to the uncoated engine, as depicted in Figure S-258. In this study, the BSFC reduction reached up to 9.09% for B20 blend and 14.28% for diesel in the TBC engine, which is consistent with the reductions reported by (6.5%)43. The observed BSFC improvement is notably higher than that reported by Soudagar et al.59(3.5–5.6%) and contrasts with Muralidharan et al.60, who observed an increase of 9–10% in BSFC with biodiesel blends. These improvements in the present study can be attributed to the synergistic effects of the optimized compression ratio, enhanced combustion due to the mullite thermal barrier coating, and the favorable fuel properties of scum oil methyl ester. Various studies have reported a significant improvement of around 4.8% in LHR engines using different biodiesels, which is consistent with the findings of the current study32.
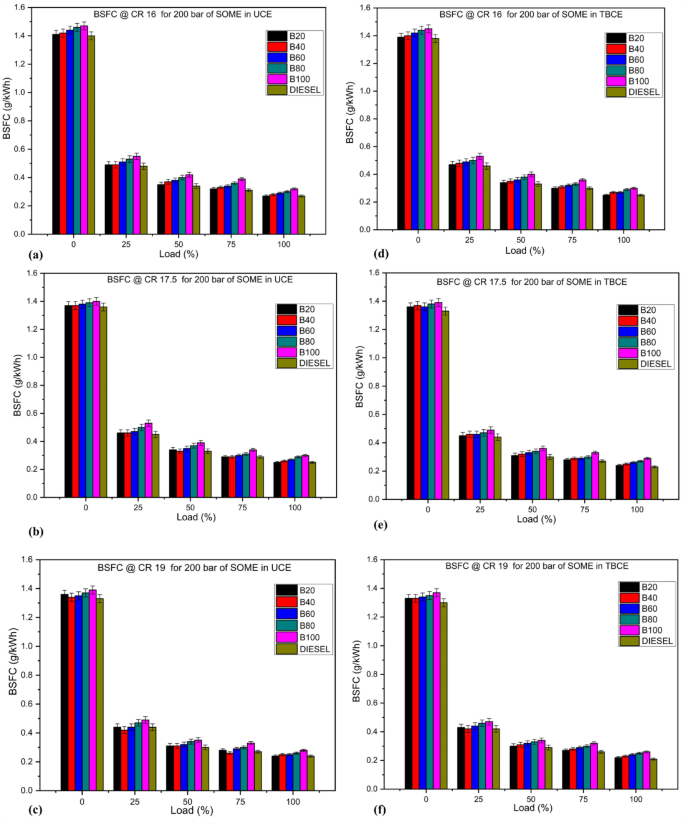
(a–f) The variation of the BSFC at different loads and CRs (16, 17.5 & 19) for SOME blends in both coated and uncoated engines.
Brake specific energy consumption (BSEC)
BSEC is defined as the metric that quantifies the efficient energy produced from the combustion of fuel to generate unit brake power within a specific timeframe. The determination of BSEC is a more realistic parameter compared to BSFC for assessing the performance of a CI engine running on various test samples with different densities and lower heating values45. BSEC is typically calculated as the product of the fuel’s lower heating value and BSFC, as shown in Eq. (7).
$$BSEC=Low{text{ }}calorific{text{ }}value{text{ }} times {text{ }}BSFC{text{ }}$$
(7)
Figure 8(a-f) illustrates the variation in BSEC values for both uncoated and mullite-coated VCR engines fueled with diesel and SOME blends at different CRs under varying loads. Essentially, BSEC decreases with an increase in load and CR, mirroring the trends observed in the BSFC figures for all tested fuel samples. From Figs. 9(a-f), it is evident that conventional diesel fuel has a lower BSEC than all biodiesel blend samples across different engine loads. However, B100 shows the highest BSEC value among the biodiesel samples due to its higher BSFC, lower calorific value, longer ID, higher flash point temperature, and poorer atomization properties43. Under peak engine load conditions, the average decrease in BSEC was 8.05%, 7.87%, 7.44%, 3.48%, 6.69%, and 7.99% when CR increased from 16 to 17.5, and similarly, the average decrease in BSEC was 3.13%, 3.8%, 8.05%, 11.57%, 7.09%, and 4.22% when CR increased from 17.5 to 19 for B20, B40, B60, B80, B100, and diesel, respectively, in the uncoated diesel engine, as shown in the BSEC graphs. The results indicate that increasing the compression ratio (CR) leads to a consistent reduction in Brake Specific Energy Consumption (BSEC) across all fuel samples, primarily due to enhanced thermal efficiency and shorter ignition delay, contributing to smoother engine operation. Fuel consumption showed a notable dependency on CR under varying engine conditions, directly influencing BSEC values. CR 17.5 served as the reference operating condition, while a further increase to CR 19 resulted in lower fuel consumption, likely due to improved combustion efficiency and optimized in-cylinder thermodynamic conditions, despite slightly reduced air availability from altered cylinder volume. In contrast, at CR 16, higher volumes of both fuel and air were required to maintain the rated power output, indicating suboptimal combustion. Interestingly, as shown in Fig. 8(c), BSEC values for B20 closely matched those of diesel at higher CRs, attributed to reduced fuel usage driven by better Brake Thermal Efficiency (BTE) and superior fuel–air mixing characteristics61.
Figure 8(d-f) describes the variation in BSEC for the LHR diesel engine at different CRs and varying loads for various fuel samples. The graphs show that BSEC decreases for the mullite-coated engine compared to the uncoated engine as engine load and CRs increase for all test samples. This is attributed to higher combustion chamber temperatures, improved fuel atomization, reduced ID, enhanced vaporization rate, and lower fuel consumption exhibited by the thermally coated diesel engine. These factors further decrease BSEC at higher CRs for all fuel samples in the thermally coated engine compared to the uncoated CI engine9,61. At maximum engine load, BSEC values in the coated engine are 10.14, 10.51, 10.86, 11.22, 11.98, and 9.77 MJ/kWh at CR-17.5, and 9.29, 9.67, 10.03, 10.39, 10.74, and 8.92 MJ/kWh at CR-19 for B20, B40, B60, B80, B100, and diesel, respectively. At 100% engine load, a reduction in BSEC of 4.14%, 3.9%, 3.87%, 7.39%, 3.42%, and 8.8% at CR-17.5 and 10.22%, 8.79%, 4.09%, 3.94%, 7.73%, and 14.35% at CR-19 for B20, B40, B60, B80, B100, and diesel, respectively, was observed in the thermally coated engine compared to the uncoated diesel engine, as shown in Figure S-3. The use of the mullite-coated engine resulted in a significant reduction in BSEC values of 5.25% at CR-17.5 and 8.18% at CR-19 with SOME blends, consistent with the findings of Karthikeyan et al.45.
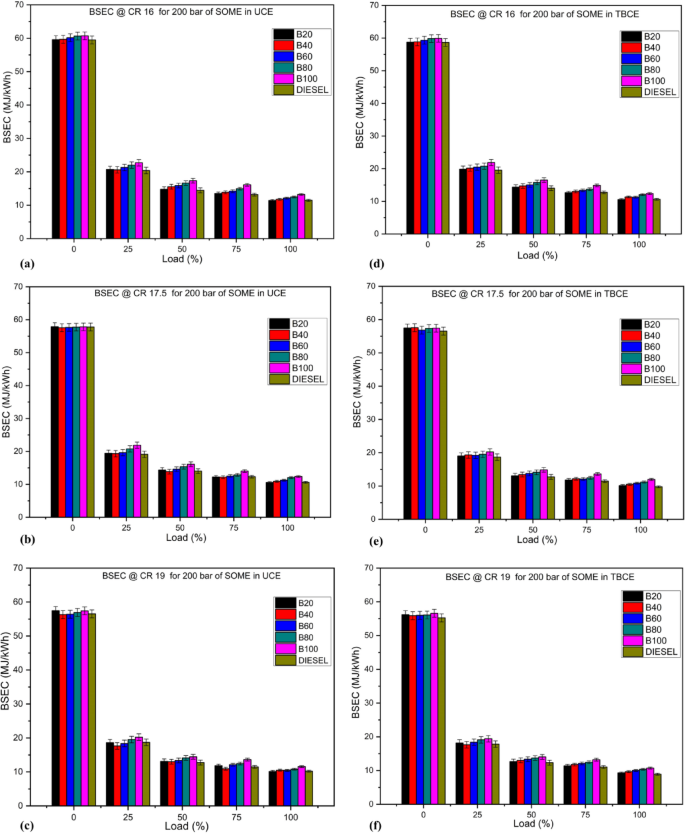
(a–f) The variation of the BSEC at various loads and CRs (16, 17.5 & 19) for SOME blends in both coated and uncoated engines.
Exhaust gas temperature
The exhaust gas temperature (EGT) is a significant measurement that can be used as proxy for combustion quality inside the cylinder and is directly related to the in-cylinder temperature at the time of combustion. From Fig. 9(a–f), it is observed that EGT always increases with load for all test fuels and CRs, whether it is in uncoated and LHR diesel engines. This increase is due to a higher load more fuel is injected per unit time, in which heat release is increased to maintain sustain torque output. Nevertheless, blends of higher quantities of SOME biodiesel presented systemically slightly lower EGT than diesel, this tendency was more accentuated at higher CR. This decrease is due to the lower heating value and the higher oxygen content of biodiesel which lead to more complete combustion though at lower peak flame temperatures. At the lowest CR (16:1), in particular, EGT values were higher for all fuels. At 17.5 and 19 CR, EGT values of biodiesel blends are less than those of diesel which gives better thermal efficiency with increased CR8. At CR-17.5 EGT for diesel is 368.93 °C, for B20: 363.67 °C and for B100: 344.68 °C. Similarly, at CR-19 EGT for diesel is 363.67 °C, for B20: 360.09 °C and for B100: 342.46 °C, at operating conditions. The decrease in EGT at greater CRs can be ascribed to various variables, such as the reduced calorific value, increased oxygen content, elevated flash point, and diminished end-of-compression temperature of certain mixed fuel in comparison to diesel. The combustion temperature is a critical factor in understanding the generation of NOx inside the engine cylinder. Performance may increase due to lower exhaust loss62. As the CR increases, the volume of EGT at peak load decreases. This is due to improved fuel atomization and air-fuel ratio. In comparison of EGT in LHR and uncoated engine, an increase of 3.91%, 4.85%, 4.9%, 5.21%, 4.97% and 3.72% at CR-17.5 and 1.83%, 1.49%, 1.87% 0.93%, 0.99% and 2.47% at CR-19 for B20, B40, B60, B80, B100 and diesel respectively, at peak load condition were determined. According to these results, it is seen that the increase in EGT is more noticeable in LHR engines than uncoated engines, as the loss of heat to the coolant and surroundings decrease significantly in LHR engines. This amount of heat is transferred to the exhaust gas because TBC can give off maximum temperature48,63. The variation of EGT with CRs at peak load for all test samples in both uncoated and TBC engine is shown in Figure S-4.
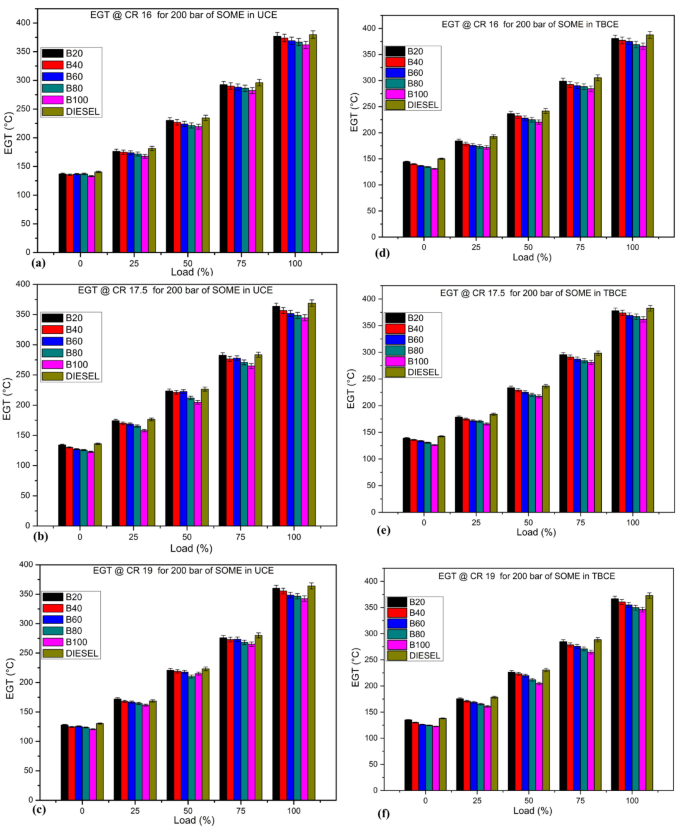
(a–f). The variation of the EGT at various loads and CRs (16, 17.5 & 19) for SOME blends in both coated and uncoated engines.
Combustion characteristics
Combustion cylinder pressure (CCP)
The amount of fuel burned during the premixed combustion phase, the first stage of combustion, has an impact on the CCP in a direct injection diesel engine. The characteristics of cylinder pressure reflect the fuel’s ability to mix with air and combust. The combustion process in CI engines consists of two main phases: the premixed phase and the diffusion phase. The premixed phase begins immediately after fuel injection, where the fuel and air mix thoroughly to form a highly flammable mixture before ignition. A critical aspect of this process is the ID, the time interval between the SOI and the SOC. During ignition, this fuel mixture reacts quickly. After the oxygen in this combination is burned, the combustion process enters the diffusion phase, governed by fuel-air mixing64. For an optimum TBCE configuration at CR 17.5, pressure rise was early and peak cylinder pressure was advanced compared to UCE, indicating shorter ignition delay due to higher in-cylinder thermal conditions. This thermally promoted shift of combustion phasing increases pressure–temperature coupling and may lead to an increase in thermal efficiency, particularly for biodiesel-enriched blends53.
The diffusion phase is much longer than the premixed phase65. The fluctuations in CCP relative to CA under rated load (100%) conditions for different CRs across various blends of SOME and diesel are depicted in Fig. 10(a-f) for both LHR and uncoated engines. Diesel has a higher peak cylinder pressure than biodiesel at all engine loads and CRs in both uncoated and coated engines. The peak cylinder pressure for B20, B40, B60, B80, B100 and diesel where 72.36 bar, 71.26 bar, 70.76 bar, 69.48 bar, 67.33 bar and 73.54 bar at CR-17.5 and 73.68 bar, 72.79 bar, 72.31 bar, 71.95 bar, 71 bar and 74.94 bar at CR-19 respectively, at crack angle between (7–10°) away from Top Dead Center (TDC) in uncoated engine. Every occurrence of maximum pressure was seen to take place distinctly after the TDC, which indicates that the engine was operating safely and efficiently. Alternatively, if the maximum pressure occurs near or prior to the TDC position, it can result in significant engine knocking, which in turn can negatively impact the longevity of the engine. Diesel has the highest peak pressure than biodiesel blends, because diesel fuel has higher ignition period with lower viscosity and cetane number in which fuel air mixes readily resulting in proper combustion leading to higher cylinder pressure at peak load. Figure S-5(a – f) describes the fluctuation in cylinder pressure with load (0-100%) for different test fuels at varying CRs in both coated and uncoated engine using SOME blends. When CR increased from 16 to 19, biodiesel blends had more benefits than diesel. Because of their low volatility, biodiesel blends have higher viscosity, better atomization, faster mixing of air fuel, and shorter ID due to higher cetane number and oxygen fortification. Additionally, higher peak pressure is caused by less penetration with increased cone angle66.
For LHR engine peak pressure will be higher at all CRs with rises in load for all the samples when compared to uncoated engine. In TBC, the engine burning starts earlier than for uncoated engines at all engine loads and CRS with a decrease in ignition period and advanced injection timing. Consequently, the maximum cylinder pressure reaches an elevated level for all test fuels and further observed that CA position came very close to TDC in the expansion stroke. The Fig. 10(d – f) shows that peak pressure for TBC engine was recorded to be 73.54 bar, 72.36 bar, 71.26 bar, 70.76 bar, 69.48 bar and 74.55 bar at CR-17.5 and 74.94 bar, 73.87 bar, 72.75 bar, 72.29 bar, 71.95 bar and 76.58 bar at CR-19 for B20, B40, B60, B80, B100 and diesel respectively at 100% load between the CA position (6–8°) after TDC. In TBC engine peak cylinder pressure is measured at the CA between (6–8°) ATDC, but for uncoated engine it is shifted slightly away from TDC (8–10°) for all test fuels and CR at maximum load. In the present work, the TBC engine had presented a higher maximum cylinder pressure of 76.58 bar for diesel, and 74.94 bar for B20 between 6–8° ATDC. This is related to the improving CR and the heat insulation effect caused by the mullite coating, which leads to higher in-cylinder temperature and faster heat release39. On the other hand, uncoated engines had the trend of delayed peak pressure (8–10° ATDC). The reduction in ignition delay and improved combustion with SOME blends further support this trend, aligning well with previous findings. Similar improvements have been also reported by the authors earlier during studies on biodiesel in TBC-fitted engine32.
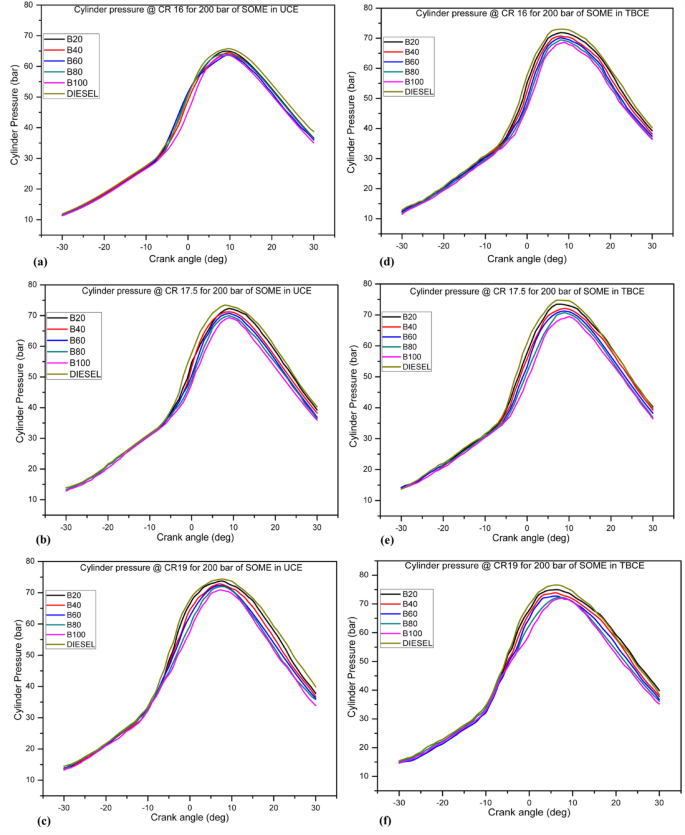
(a–f). The variation of cylinder pressure with CA and CRs (16, 17.5 & 19) for SOME blends in both coated and uncoated engines.
Heat release rate
The HRR is used to determine the SOC, quantify the amount of fuel burned, and identify variations in the fuel’s combustion rate. The cetane number of the fuel indicates its ignition quality; a higher cetane number results in a shorter ID period. The chemical and physical processes occurring during the ID period are generally endothermic, causing the combustion model to exhibit negative heat release during this period, which quickly turns positive upon auto-ignition. After the ID, the pre-mixed air-fuel mixture burns rapidly, producing the first peak in the HRR. Once premixed combustion is completed, the process transitions to the diffusion phase, where the burning rate is maintained by the presence of a combustible mixture67. Figure 11(a-f) compares the effects of CR on the HRR with diesel and scum oil biodiesel blends in relation to CA for both TBC and uncoated engine operations. As illustrated in Fig. 11(a–c), with the increase of scum oil biodiesel blend, a shorter ID period occurred than that of diesel. As a result, the maximum rate of heat release during the combustion phase, when fuel and air are mixed, gradually decreases and shifts to earlier points in the engine’s rotation. The observed result can be ascribed to the decreased fuel injection quantity during the shorter period between ignition and combustion, as well as the lower energy content of the scum oil biodiesel68.
It has been observed that the maximum HRR decreases at lower compression ratio and gradually increases at higher compression ratio for all test fuels at max load. However, the peak HRR for convention fuel is larger than that of biodiesel blends at all CRs. This is due to the extended period it takes for the ignition to occur, which leads to a greater buildup of the fuel-air combination within the cylinder. The reduced density and viscosity of diesel fuel enable enhanced fuel mixing and atomization, resulting in a greater rate of heat release. The max HRR are 46.97, 44.78, 43.12, 39.87, 36.34 and 47.49 J/°CA at CR 17.5 and 45.82, 44.12, 41.85, 41.79, 41.23 and 47.97 J/°CA at CR 19 for B20, B40, B60, B80, B100 and diesel respectively under max load condition in uncoated engine. During peak load, the mullite-coated engine fueled with diesel exceeds SOME mixes in terms of highest HRR, regardless of the CRs. The variation is due to the extended period it takes for diesel fuel to ignite, along with its greater energy content, as well as the higher operating temperature that is typical of engines equipped with TBC.
From Fig. 11(d–f) it was noted that at higher engine load, the HRR for coated engine is greater and occurs at a CA very close to TDC i.e., between (2 − 0°) BTDC (before top dead centre). As seen in the graphs the net HRR was marginally higher for coated engines than engines with uncoated, and it increases with rise in compression ratio. In uncoated engine retardation of injection timing increases the ignition period due to which premixed combustion phase is shortened resulting in lower HRR. The max HRR for LHR engines is 46.6, 45.97, 44.78, 43.12, 39.87 and 47.97 J/°CA at CR-17.5 and 48.68, 45.82, 44.12, 41.85, 41.79 and 49.61 J/°CA at CR-19 for B20, B40, B60, B80, B100 and diesel respectively at peak load. In the present study, the maximum HRR in TBC engine was found at 49.61 J/°CA and 48.68 J/°CA for diesel and B20 at a compression ratio 19, respectively. These values are in agreement with the previously reported HRR rise of 4.9–7.8% when coated engines are compared to uncoated69. The enhanced HRR and earlier combustion peaks in this study result in better combustion quality (i.e., more efficient combustion), which can be attributed to an optimized compression ratio, lower thermal loss resulting from the mullite coating and the excellent ignition quality of scum oil methyl ester, which collectively facilitate rapid and complete combustion. The combustion span graphs for different biodiesel blends and diesel with different compression ratio for with and without coated engine are illustrated in Figure S-6 (a-f) which is presented in supplementary material.
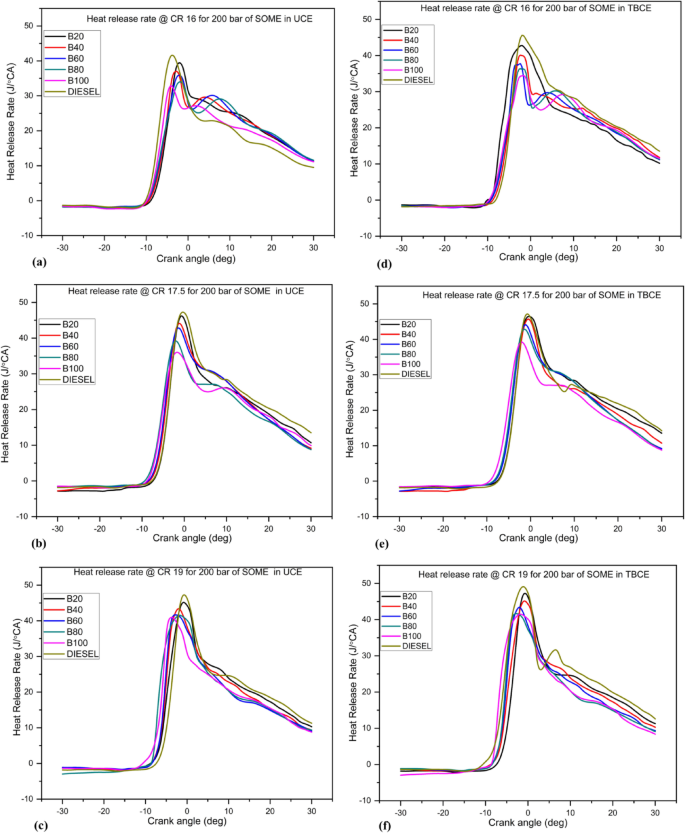
(a–f). The variation of HRR with CA and CRs (16, 17.5 & 19) for SOME blends in both coated and uncoated engine.
Combustion parameters
In compression ignition (CI) engines, combustion is typically characterized by key sequential phases: ignition delay (ID), premixed combustion, diffusion combustion, and afterburning. The nature and efficiency of these phases largely depend on the physicochemical properties of the fuel used. In the current study, critical combustion parameters such as start of injection (SOI), start of combustion (SOC), ignition delay (ID), combustion duration (CD), and cumulative heat release rate (CHRR) were systematically evaluated for various blends of Scum Oil Methyl Ester (SOME) and diesel under different compression ratios (CRs) and engine configurations (uncoated and thermal barrier-coated). The determination of SOI was based on a threshold needle lift of 0.01 mm, marking the onset of dynamic fuel injection70. The injection delay (IND), defined as the difference between static and dynamic fuel injection timing, and SOC were derived using pressure derivative analysis. The SOC corresponds to the crank angle (CA) at which the second derivative of in-cylinder pressure crosses zero prior to its maximum slope an indicator of rapid combustion initiation63.
Ignition delay, the interval between SOI and SOC, is a crucial parameter influenced by the fuel cetane number, viscosity, density, and oxygen content. It plays a pivotal role in shaping combustion characteristics such as peak cylinder pressure (PCP), HRR, and SOC timing. In this study, biodiesel blends exhibited moderately delayed SOI compared to diesel, with observed delays of −2.635°CA and − 1.06°CA at CR 16 under full load in uncoated and coated engines, respectively71. This delay is primarily due to the higher viscosity and bulk modulus of SOME, leading to increased nozzle pressure and slower fuel response. As CR increased, SOI timing in uncoated engines aligned more closely with the manufacturer specification, deviating only by 0.751°CA at CR 17.5 and − 0.212°CA at CR 19. In contrast, TBC engines showed slight advancement in SOI by 0.766°CA at CR 17.5 and 0.682°CA at CR 19 reflecting the impact of increased cylinder wall temperature and reduced viscosity of biodiesel during injection. The higher cetane number and lower aromatic content of SOME contributed to earlier SOC, reducing ID in both engine configurations, especially at higher loads and CRs54.
The combustion duration (CD) measured between CA05 (start of combustion) and CA90 (end of combustion) was generally longer for biodiesel blends compared to diesel, primarily due to their lower heating value and higher vaporization enthalpy. Despite this, increasing CR led to improved atomization and air-fuel mixing, which in turn shortened CD in both uncoated and TBC engines. In uncoated engines, the CD reduction from CR 16 to 17.5 ranged between 2.43°CA and 3.99°CA across all blends and further decreased by 2.29°CA to 5.66°CA when CR increased to 1964. Similarly, in TBC engines, CD was reduced further by 0.94°CA to 3.89°CA at CR 17.5 and by 0.31°CA to 3.89°CA at CR 19 compared to uncoated counterparts. These improvements in CD are attributed to the enhanced combustion environment in TBC engines, which promote higher cylinder temperature, better atomization, and faster oxidation, leading to more complete combustion. These trends were consistent with other studies involving TiO2-coated engines running on Pongamia-based biodiesel blends56,61.
The rate of pressure rises (RoPR), an indicator of combustion intensity and knocking tendency, increased with both engine load and CR in all test conditions. However, diesel consistently showed a higher RoPR than biodiesel blends due to its lower cetane number and longer ID, which allows for a larger fuel-air premix before ignition. In uncoated engines, the average RoPR increased by 0.2 bar/°CA when CR was raised from 16 to 17.5 and by 0.76 bar/°CA when increased to CR 19. In TBC engines, the mean RoPR increased by 0.27 bar/°CA and 0.25 bar/°CA at CR 17.5 and CR 19, respectively, compared to uncoated engines48,67. These results align with previous findings in engines using Karanja and roselle biodiesel blends, also demonstrated a rise in RoPR with CR. Cumulative heat release rate (CHRR), representing the total energy released during combustion, is a key metric for assessing combustion efficiency. Across all test fuels and configurations, CHRR increased with CR. Diesel consistently exhibited higher CHRR than biodiesel blends due to its higher calorific value and superior atomization characteristics. SOME blends showed comparatively lower CHRR because of their higher density, viscosity, and oxygen content, which leads to slower and more diffused combustion58,68.
Nonetheless, TBC engines showed enhanced CHRR across all fuel blends due to increased combustion chamber temperature, better premixed zone formation, and improved oxidation. At full load in uncoated engines, CHRR increments from CR 16 to 17.5 ranged from 24.3 J to 29.98 J across blends, and from 17.08 J to 29.27 J when CR increased to 19. In TBC engines, the CHRR gains were even more notable ranging from 3.52 J to 8.55 J at CR 17.5 and from 5.78 J to 7.88 J at CR 19, depending on the blend. These enhancements confirm that thermal barrier coating, combined with higher CR, can significantly improve the combustion efficiency of biodiesel blends, narrowing the performance gap with diesel65. The observed trends in CHRR also correlate well with in-cylinder pressure, RoPR, and BTE values, reinforcing the mechanistic consistency of the results. Overall, this study demonstrates that biodiesel blends, particularly B20, can perform comparably to diesel in both standard and TBC engines when operated at higher CR. The application of thermal coating helps offset the limitations of biodiesel, such as lower calorific value and higher viscosity, by enhancing the combustion environment. Improved SOC, reduced ID, shorter CD, and elevated CHRR in coated engines support the viability of biodiesel as a sustainable alternative fuel, especially when paired with engine design modifications like LHR and TBC configurations28.
Ignition lag
Ignition delay (ID) is a critical phase in compression ignition (CI) engines, representing the interval between the start of fuel injection and the onset of combustion. It is composed of both physical and chemical delay periods. The physical delay involves atomization, vaporization, air–fuel mixing, and heating of fuel droplets, while the chemical delay refers to the time required for pre-flame reactions to progress toward auto-ignition72. The ignition characteristics are influenced by several physico-chemical fuel properties, including cetane number, viscosity, density, latent heat of vaporization, surface tension, and in-cylinder thermodynamic conditions such as pressure and temperature. A higher cetane number typically indicates a shorter ignition delay, which is especially important in optimizing engine performance and emissions73. In this investigation, ignition delay was experimentally evaluated for uncoated and mullite-coated (TBC) CI engines operating under various compression ratios (CR = 16, 17.5, and 19) and engine loads using diesel and scum oil methyl ester (SOME) blends. The variation in ignition delay as a function of crank angle (CA) was plotted in Fig. 12(a–f), and supporting data is presented in Tables 5 and 6.
Across all tested fuel blends, results demonstrated that ID decreased with increasing load and compression ratio. At higher engine loads, elevated in-cylinder temperature and residual gas content promoted faster ignition due to favorable thermal conditions. Moreover, the oxygen-rich nature and higher cetane number of SOME contributed to consistently shorter ignition delay than diesel across all CRs and loads74. For instance, in uncoated engine at full load, the ID decreased as CR increased from 16 to 17.5 and then to 19. For B20, ID dropped from 16.24° to 15.62° CA (CR 16 to 17.5), and further to 14.82° at CR 19. Similar trends were observed for B40, B60, B80, and B100. Diesel also showed a reduction, but ID remained higher than that of SOME blends due to its lower cetane number and lack of intrinsic oxygen content. The coating of engine components with mullite further influenced ID behavior. The ceramic layer enhanced in-cylinder temperature retention, improving fuel vaporization and promoting earlier combustion. In TBC engines, ignition delay periods were significantly reduced for all fuels. At full load and CR 19, ID for B20 decreased from 15.62° (uncoated) to 13.62° CA (coated), indicating a marked improvement in ignition characteristics due to thermal insulation and improved combustion chamber conditions. This trend held true across other blends as well ID for B100 at CR 19 fell from 14.75° (uncoated) to 12.75° (coated)75. These observations confirm that the combination of biodiesel with ceramic-coated combustion chamber leads to faster ignition, especially at higher CRs and loads. The shortened ID facilitates an earlier start of combustion (SOC), as evident in Figs. 10 and 11, contributing to a higher peak pressure and a more efficient premixed combustion phase. This is particularly important in engine operating with SOME, where chemical reactivity is enhanced due to high oxygen availability and lower aromatic content, promoting rapid flame propagation.
The rise in compression ratio also plays a pivotal role. It leads to increased air temperature during compression, lowering the fuel auto-ignition threshold. Combined with the TBC insulating effect, this results in more favorable condition for auto-ignition. Furthermore, reduced viscosity and better atomization at high temperatures facilitate finer fuel dispersion and better mixing with air, which collectively support faster combustion initiation. The study also showed that the ignition delay is longer for diesel under all conditions due to its relatively inferior volatility, lower cetane index, and absence of internal oxygen. In contrast, SOME and its blends demonstrate consistently shorter delay periods due to better pre-flame chemistry and enhanced molecular oxygenation, especially under thermally optimized conditions provided by the TBC engine configuration13,15. Experimental comparisons also revealed that ID variation correlates with changes in other combustion parameters such as cylinder pressure, heat release rate (HRR), and combustion duration (CD). A shorter ID typically resulted in earlier and more intense HRR peaks, improving thermal efficiency while minimizing unburned fuel residues58. In summary, this investigation confirms that ignition delay is significantly influenced by fuel composition, engine coating, compression ratio, and load. The combination of biodiesel blends with ceramic-coated engine at higher CR fosters rapid ignition, enhancing combustion efficiency. The synergy between fuel properties and engine design parameters offers a viable path for cleaner and more efficient CI engine operation, with particular promise for sustainable biodiesel application.
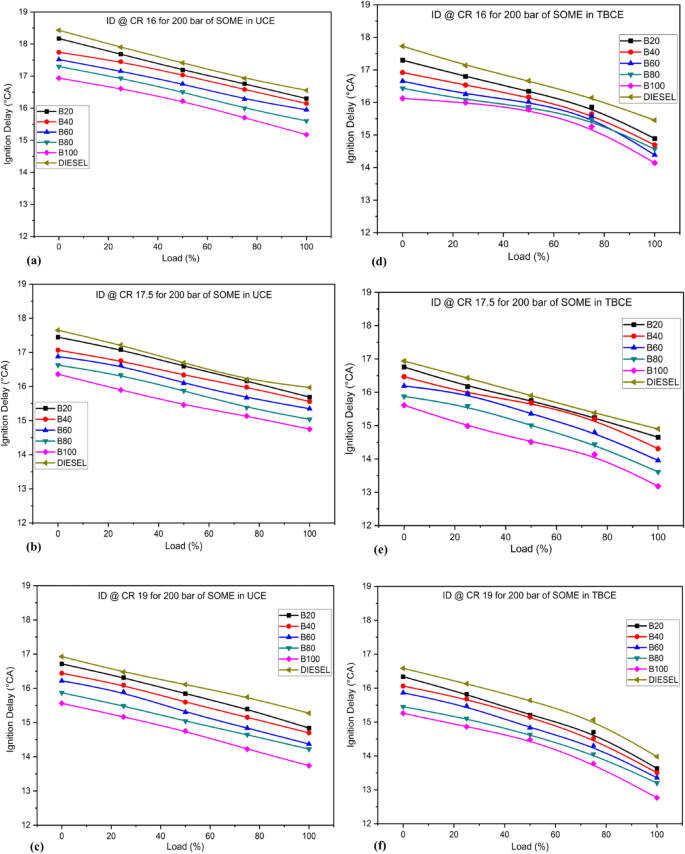
(a–f) The fluctuations in ID at various loads and CRs (16, 17.5, & 19) for blends of SOME in both coated and uncoated engines.
Emission characteristics
According to theory, the ideal combustion of the fuel-air mixture in the diesel engine cylinder would result in the formation of just CO2 and water (H2O), as shown in Eq. 8. Nevertheless, attaining full combustion in real-world situations is difficult due to a range of engine operating factors. The parameters encompassed in this set are the fuel-air equivalency ratio, fuel type, combustion chamber design, oxygen availability, autoignition temperature of the fuel, ignition lag, and fuel vaporization ratio. Fluctuations in various operational parameters lead to energy wastage from the fuel provided. Equation 9 shows that when fuel undergoes incomplete combustion, it produces damaging pollutants including CO, CO2, NOx, HC, and other substances.
$${C_x}{H_y}+z({O_2}) to aleft( {C{O_2}} right)+bleft( {{H_2}O} right)+Energy{text{ }}$$
(8)
where, x = a, y = 2b and z = 2a + b.
$${C_x}{H_y}+z({O_2}) to aleft( {C{O_2}} right)+bleft( {{H_2}O} right)+cleft( {CO} right)+dleft( {HC} right)+eleft( {PM} right)+Energy{text{ }}$$
(9)
Emission like CO and HC in the exhaust is very important because which indicates that fuel is not completely utilized such that less chemical energy obtained from the fuel76. Emissions such as CO2 and NOx emitted by CI engine will greatly affect the ozone layer and on human health. The diesel engine emission in with and without coated engine with diesel and SOME blends were evaluated in terms of CO, CO2, O2, NOx, HC and smoke opacity at various CRs (16,17.5 and 19) and at various loading conditions of the engine.
Carbon monoxide (CO)
Carbon monoxide (CO) emissions in CI engines arise primarily from incomplete combustion, often due to insufficient oxygen availability, poor fuel–air mixing, suboptimal injection timing, low injection pressure, and engine design limitations. CO is a harmful, odorless, and colorless gas that must be strictly minimized. Experimental results presented in Fig. 13(a–f) show that CO emissions were consistently lower for all SOME blends compared to diesel across various compression ratios (CRs) in both uncoated and thermal barrier-coated (TBC) engines. At light and medium loads, SOME blends produced noticeably lower CO levels. However, under peak load, CO emissions rose due to richer mixtures and reduced combustion duration. The additional oxygen content in SOME improves oxidation reactions, leading to cleaner combustion. Increasing the biodiesel proportion in the blend further lowered CO emissions, confirming the emission-reducing potential of oxygenated fuels like SOME in LHR and standard CI engines77. Furthermore, under steady-state engine operating conditions, the oxygen content of biodiesel increases the oxidation of CO to CO2, as demonstrated by Eqs. 10 and 11. Despite higher BSFC, biodiesel blends exhibit lower CO emissions due to their inherent oxygen content, higher cetane number, and improved combustion phasing, which collectively enhance oxidation efficiency. Additionally, elevated in-cylinder temperatures in LHR engines accelerate CO-to-CO₂ conversion, further reducing CO emissions even under rich or high-load conditions78.
$$xleft( {CO} right)+Y({O_2}) to left( {C{O_2}} right)+Energy{text{ }}$$
(10)
where, (y=frac{x}{2})
$$C+{O_2} to C{O_2}+Energy{text{ }}$$
(11)
Blends of biodiesel contain higher cetane number, which lowers the probability of fuel rich-zones formation and with advanced injection and combustion when using biodiesel justify the reduction of CO emission37,38. As scrutinized from the Fig. 13(a – f) showed reduced CO emission for all tested samples at increasing CR from 16:1 to 19:1 at maximum load in with and without coated engine. When the CR increased from 16 to 17.5, the CO emission decreased by 9.09%, 15.79%, 25%, 13.33%, 17.14%, and 7.41% for the blends of B20, B40, B60, B80, B100, and diesel respectively at full load for an uncoated engine. Similarly, when the CR is increased from 17.5 to 19, the CO emission decreased by 10%, 11.76%, 6.67%, 25%, 40%, and 12.5% for the same blends. The likely cause for this pattern is the rise in CR and engine load while maintaining the same injection time, resulting in elevated cylinder pressure and air temperature within the cylinder. Which improves atomization for a large amount of fuel and consequently reduces the ignition day period causing improved combustion process which results in reduced CO emission at higher CR. Hirkude et al.79 and Sivaramakrishnan78 reported that CO emission level decrease with increasing biodiesel percentage and compression ratio. As shown in Fig. 13(d–f), mullite-coated diesel engines had greater combustion efficiency for all fuels, reducing CO emissions. Average CO emission reduce in the coated engine was determined to be 10%, 11.76%, 6.67%, 15.38%, 16.67% and 8% at CR-17.5 and 5.26%, 6.25%, 7.14%, 9.09%, 3.09% and 9.09% at CR-19 for B20, B40, B60, B80, B100 and diesel respectively at peak load when compared to uncoated engine. In this study, carbon monoxide (CO) emissions decreased significantly by up to 40% for SOME blends and 12.5% for diesel when the compression ratio increased from 17.5 to 19. Overall, a 20–50% reduction in CO emissions was observed in the Low Heat Rejection (LHR) engine as compression ratio rose from 16 to 19, as shown in Figure S-8. This trend is similar to the results found by Ramasamy et al., where Y2O3–ZrO2 and Al2O3–SiO2 coatings on palm biodiesel-fueled engines effectively lowered CO levels80. The decline in CO emissions is primarily attributed to enhanced in-cylinder heat retention from the mullite-based thermal barrier coating (TBC), improved combustion due to higher wall temperatures, and the inherent oxygen content in SOME, all of which promote more complete combustion and reduced heat loss to the coolant and ambient surroundings.
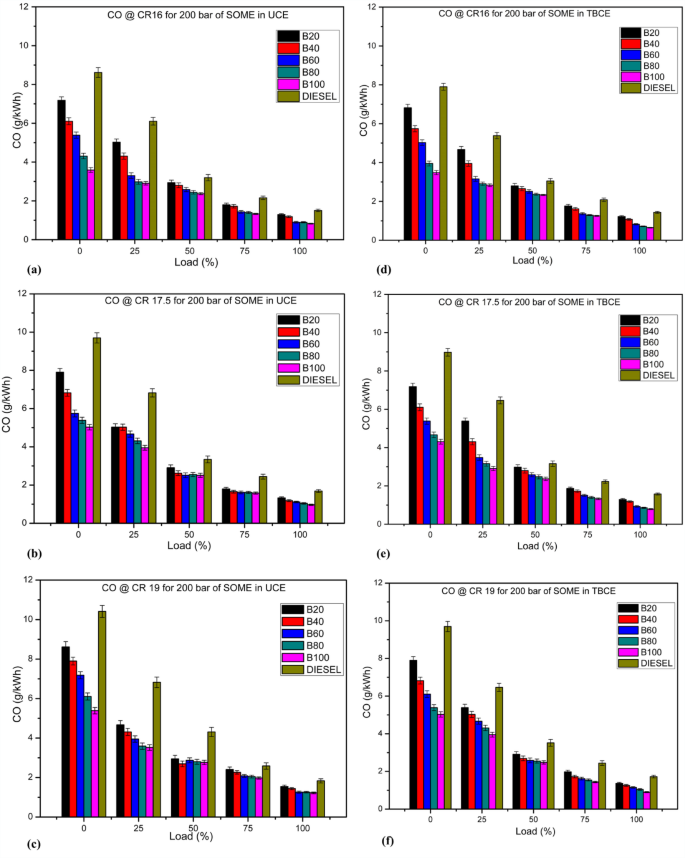
(a–f). The variation of the CO at different loads and CRs (16, 17.5 & 19) for SOME blends in both coated and uncoated engines.
Hydrocarbon (HC) emission
Hydrocarbons (HCs) are mainly caused by incomplete combustion of petroleum diesel fuels, and are typically quantified as parts per million (ppm) of carbon atoms. These hydrocarbons are regarded as exhaust gases and are a matter of environmental concern. Major sources of HC emissions are unburnt fuel-air mixtures, HC emissions bleeding out from engine lubricating oil as well as suboptimal mixing and combustion. The chemical composition of the fuel plays a crucial role in the magnitude of these emissions fuels rich in aromatics and olefins typically produce more reactive hydrocarbon species. Variation of unburned hydrocarbon (UHC) emissions with compression ratio (CR) and engine load is illustrated in Figure 14 (a–f) for mullite-coated (TBC) and uncoated engines operated with SOME-diesel blends. At all test operating modes, SOME blends had lower HC emissions compared to neat diesel. The decrease was likely due to the higher oxygen content (10–13 wt%) in SOME, which leads to an improved combustion of the fuel and its higher cetane number, which shortens ignition delay. Such properties enhance complete combustion and the consequent reduction of fuel-rich and over-lean areas leading to higher HC emissions81.
Typically, HC emissions are a significant problem at very high loads in diesel engines. At high loads, a larger amount of fuel is injected onto the cylinder surface, causing improper fuel distribution with less surplus air and higher wall temperatures, leading to regions where the fuel-air mixture may survive and escape into the exhaust manifold as HC emissions. This study’s results indicate that HC emissions decrease with an increase in compression ratio for all tested fuels in both LHR and uncoated engines82. Hydrocarbon emissions for B20, B40, B60, B80, and B100 decreased by 14%, 18.75%, 18.75%, 12.28%, and 26.67% at CR-17.5 and by 4.44%, 9.3%, 17.5%, 30.55%, and 42.42% at CR-19 compared to diesel in an uncoated engine at full load. Similar results were obtained at a compression ratio of 16. The probable reason for the decrease in HC emissions at higher CRs is that biodiesel blends reach ignition temperature due to the higher wall temperature and pressure inside the engine cylinder, enabling the oxidation reaction with more O2 molecules, which promotes complete combustion. The reductions in hydrocarbon emissions at 100% load when the CR varied from 16 to 17.5 were 20%, 12.5%, 4.17%, 4.26%, 0%, and 19.29%, and when the CR varied from 17.5 to 19, the reductions were 11.11%, 11.63%, 20%, 30.56%, and 21.28% for B20, B40, B60, B80, B100, and diesel, respectively, in an uncoated engine.
Results show that HC emissions are lower in the TBC engine compared to the uncoated engine for all test fuels at maximum load and different CRs, as demonstrated in Figure S-9. Hydrocarbon emissions from the mullite-coated engine decrease significantly compared to the uncoated engine due to the shorter quenching distance, increased after-combustion temperature, and lower flammability limit associated with the TBC engine, resulting in reduced heat loss to the cooling system. By harnessing thermal energy within the combustion chamber, the combustion of the fuel-air mixture is enhanced, leading to decreased HC emissions83. The reductions in HC emissions at full load in the LHR engine are 4.17%, 6.67%, 9.09%, 17.5%, 18.42%, and 7.55% at CR-17.5 and 7.14%, 7.55%, 5.26%, 5.88%, 10%, and 6.82% at CR-19 for B20, B40, B60, B80, B100, and diesel, respectively, compared to the standard diesel engine. In the present study, HC emissions were reduced by 42.42% for B100 and 26.67% for B20 with increased CR from 17.5 to 19, with overall reductions ranging from 12 to 42% in the uncoated engine and 5–18% in the LHR engine. These results are in close agreement with previous studies, including 39.1% with Orange Peel biodiesel in TBC engine69,80. The improved performance in the mullite-coated engine is primarily due to higher in-cylinder and gas temperatures, which promote efficient oxidation. This results in a more complete combustion, especially on oxygen rich SOME blends, leading to lower unburned hydrocarbon emissions.
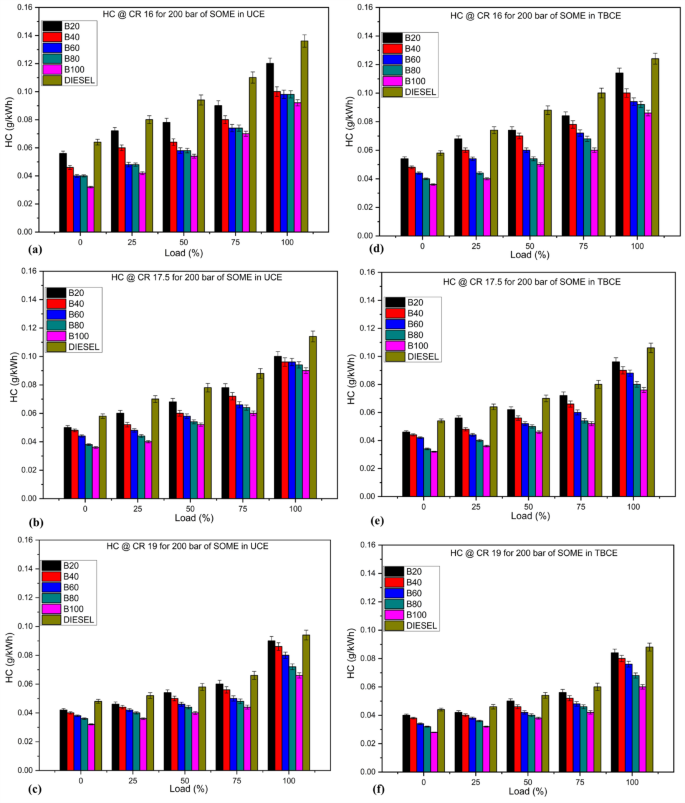
(a–f). The variation of the HC at different loads and CRs (16, 17.5 & 19) for SOME blends in both coated and uncoated engines.
Nitrogen oxide (NOx) emission
Nitrogen oxides (NOx) have been and continue to be one of the most challenging and complex emissions faced by biodiesel and its blends in compression ignition (CI) engines. NOx is generated mostly by thermal oxidation of atmospheric nitrogen, promoted at high in-cylinder temperatures (usually above 1500 K), high oxygen levels and long combustion times. These conditions facilitate the Zeldovich mechanism, the dominant pathway for NOx formation84. The oxygen content, cetane number of biodiesels, and its properties such as density, viscosity, and compressibility have a considerable effect on fuel atomization, injection pressure, and combustion characteristics, leading to NOx emission. Figure 15(a-f) depicts the influence of engine load on NOx emission for different SOME-diesel fractions at different compression ratios (CRs) for uncoated and TBC engines. NOx emissions had a tendency to increase with increased CRs and increasing biodiesel contents, as a result of the higher combustion temperature and more complete fuel oxidation. Also, the decreased soot generation with biodiesel, known as combustion heat absorber, increases flame temperature for NOx formation. The contribution to higher adiabatic flame temperatures is due also to the existence of unsaturated bonds in SOME. In general, although combustion efficiency is enhanced due to biodiesel oxygenated composition of fuel and its thermal behavior, NOx abatement becomes a major issue with the use of oxygen-based biodiesel especially under high CRs85,86.
For uncoated engines, NOx emissions for B20, B40, B60, B80, B100, and diesel increased on average by 21.38%, 22.49%, 23.33%, 22.27%, 14.97%, and 20.27%, respectively, when the CR was increased from 16 to 17.5. With a further increase in CR from 17.5 to 19, the corresponding values were 6.21%, 5.49%, 4.72%, 4.15%, 4.41%, and 6.77%, respectively. This indicates that higher CR benefit biodiesel more than conventional diesel, due to its volatility, higher viscosity, density, and cetane number, which enhance performance at higher CRs. Diesel and SOME blends exhibit higher NOx emissions in LHR engines at all CRs compared to uncoated engines, as shown in Fig. 15(d–f). The increased NOx formation in TBC engines is due to higher post-combustion temperatures and longer combustion periods, causing an earlier SOC and shifting the peak temperature and pressure closer to TDC64. Consequently, most of the fuel burns in the premixed stage, leading to increased NOx formation. Even in coated engines, NOx emissions for SOME blends are higher than for diesel fuel due to the higher oxygen content in vegetable oils and traces of nitrogen in biodiesel78. NOx emissions for B20, B40, B60, B80, B100, and diesel were found to be 827, 840, 855, 855, 871, 894, and 814 ppm at CR-17.5, and 838, 852, 868, 882, 915, and 826 ppm at CR-19, respectively, for mullite-coated engines at higher load. This shows that for coated engines, NOx emissions increased by 1.59%, 1.45%, 1.78%, 1.87%, 2.76%, and 2.26% at CR-17.5, and by 2.07%, 2.16%, 2.12%, 2.2%, 3.16%, and 1.97% at CR-19 compared to uncoated engines. Finally, SOME and its blends used in both LHR, and standard diesel engines result in higher NOx formation compared to diesel, as shown in Figure S-10, consistent with findings from various studies. To mitigate NOx emissions without compromising engine performance, strategies such as Exhaust Gas Recirculation (EGR), injection timing retardation, split injection, and water or steam injection can effectively lower peak combustion temperatures. In thermal barrier-coated engines, where in-cylinder heat retention is higher, post-combustion control technologies like Selective Catalytic Reduction (SCR) and Lean NOx Traps (LNTs) become essential for achieving further NOx reduction87.
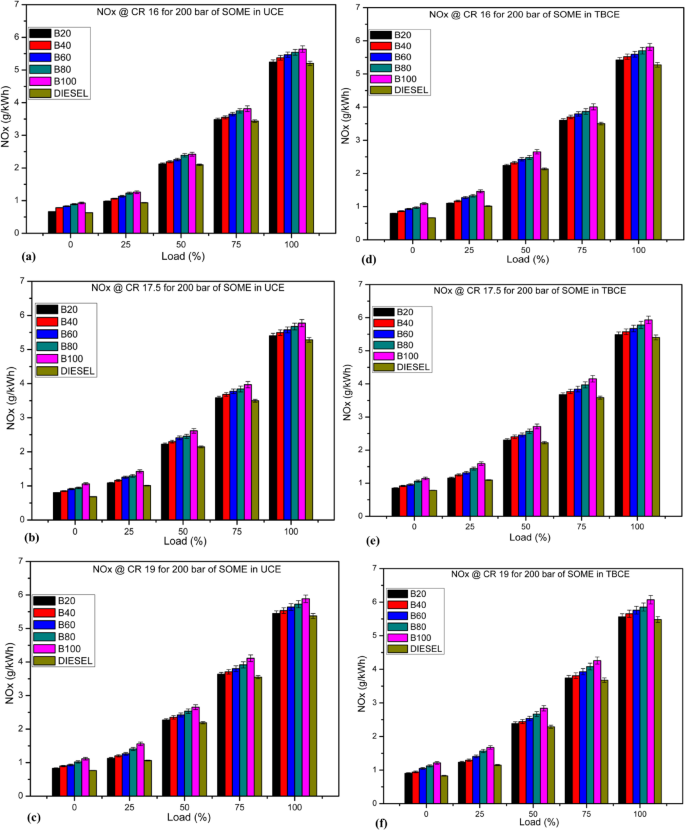
(a–f) The variation of the NOx at different loads and CRs (16, 17.5 & 19) for SOME blends in both coated and uncoated engines.
Smoke opacity
Smoke opacity is significant because it gives indication of the concentration of pollutants due to soot particle formation with the dearth of oxygen content and their oxidation rate even in the presence of some hydrocarbon, paying way for higher smoke emission which leaves smokestack. Higher smoke emission is generated when fossil fuels are burnt in the diesel engine due to extreme air deficiency. In CI engine, the main combustion of fuel occurs via diffusion mechanism during which the atomized fuel particles are broken down into two primary elements as carbon (soot formation) that will be oxidized in the reaction zone (soot oxidation)88. If there is deficiency of oxygen content and if combustion temperature does not support the oxidation process, smoke (carbonaceous particle) will be released in the exhaust gaseous. Fuels with higher viscosity tend to increase smoke emissions due to a lower air-fuel mixing rate and larger mean fuel spray droplet size. Smoke emission from diesel engines results from incomplete combustion, which can lead to higher fuel consumption and oil loss at elevated temperatures. Figure 16(a–f) illustrates the relationship between smoke opacity emissions and load for all tested fuels (SOME) at various CRs in both uncoated and coated engines. Using biodiesel blends, there is a significant reduction in smoke output in both LHR and uncoated engines when the CR rises from 16 to 19, irrespective of load level. Fuel consumption decreases due to better combustion efficiency and more oxygen-rich molecules, which enable more complete combustion. The decrease in smoke emission with higher biofuel percentages is due to the reduced carbon content in blended fuels, which have fewer C-C bonds compared to diesel, leading to lower smoke opacity. The impact of biodiesel addition on smoke emission is more significant at higher loads because the premixed combustion fraction decreases as the diffusion CD increases87. At maximum load, for every 20% increase in biodiesel blending in diesel, the smoke opacity reduction at CR-17.5 is 8.09%, 13.64%, 12.74%, 17.17%, and 24.76%, and the corresponding values at CR-19 are 5.27%, 9.91%, 15.19%, 17.45%, and 24.79% lower than standard diesel. Figure S-11 shows that at peak load, smoke opacity is lower at higher CRs compared to lower ones. This is because higher CRs increase the operating temperature and pressure, enhancing combustion efficiency. Improved reaction between fuel and air reduces smoke emissions in both coated and uncoated engines. Smoke emissions in the LHR engine decreased by 5.94%, 5.37%, 12.82%, 12.45%, 11.23%, and 8.8% at CR-17.5 and by 6.95%, 5.62%, 7.66%, 12.33%, 12.41%, and 8.12% at CR-19 for B20, B40, B60, B80, B100, and diesel, respectively, compared to the uncoated engine. These values show that all biodiesel blends in the coated engine reduce smoke opacity, despite SOME’s higher viscosity and molecular weight. The excess heat in the TBC engine raises combustion chamber temperature, oxidizing soot and promotes complete combustion due to abundant oxygen, minimizing smoke emissions. These findings align with other studies in the literature4,29.
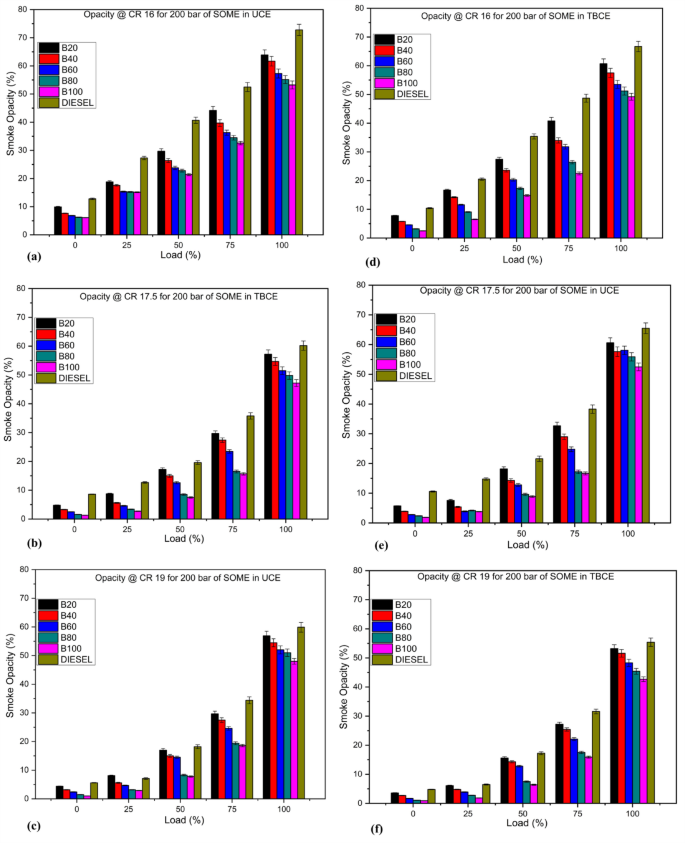
(a–f). The variation of the smoke opacity at different loads and CRs (16, 17.5 & 19) for SOME blends in both coated and uncoated engines.
Carbon dioxide (CO2)
CO2 emissions in CI engines result from the thorough burning of traditional fuels, functioning as a measure of combustion effectiveness. CO2 is a significant greenhouse gas contributing to global warming. Higher CO2 concentrations in the exhaust indicate improved combustion efficiency, contrasting with CO emissions. Factors influencing CO2 emissions include viscosity, density, combustion chamber design, air-fuel equivalence ratio, SOI, fuel line pressure, and engine speed. The CO2 emissions from biodiesel combustion are less impactful on the atmosphere since they are primarily absorbed by plants, trees, and crops. The simultaneous reduction in CO and CO2 emissions for biodiesel blends is attributed to their inherent oxygen content, which promotes complete combustion with lower carbon intensity per unit energy. Despite improved oxidation, the overall CO2 output remains lower due to biodiesel’s lower carbon content and biogenic origin, resulting in a reduced net greenhouse gas impact29.
Figure 17(a–f) presents the results of CO2 emissions for different engine loads and CRs in both uncoated and coated engines using blends of SOME and diesel fuel. The data shows that CO2 concentrations rise with increasing load and CRs for all test fuels in both engine types. Additionally, CO2 emissions decrease with higher proportions of SOME blends compared to diesel fuel. Several studies have demonstrated a decrease in CO2 emissions while utilizing biodiesel blends in diesel engines. This reduction can be due to the presence of 10–12% excess oxygen molecules in biodiesel. The highest CO2 emission values for diesel were 10.12% at CR-17.5 and 10.57% at CR-19, while for B20, B40, B60, B80, and B100 at CR-17.5, the values were 9.95%, 9.7%, 9.22%, 9.07%, and 8.93%, respectively. At CR-19, the values were 10.21%, 9.63%, 9.42%, 9.11%, and 8.92%, respectively, all lower than those for diesel at full load in an uncoated engine. The increase in CO2 emissions with load is due to the higher amount of fuel injected, leading to increased combustion temperature and oxidation rates. Higher CRs elevate post-combustion temperatures and, with sufficient oxygen in the engine chamber, enhance CO2 emissions, indicating efficient burning5.
Engines with mullite coating show further increases in CO2 emissions for all samples at rated engine load. CO2 formation in LHR engines at operating load is 10.24%, 9.88%, 9.48%, 9.21%, 8.96%, and 10.64% at CR-17.5 and 10.43%, 10.12%, 9.74%, 9.55%, 9.15%, and 10.97% at CR-19 for B20, B40, B60, B80, B100, and diesel, respectively, as shown in Fig. 18(d–f). There is a slight increase in CO2 emissions in LHR engines, with values of 2.91%, 1.85%, 2.82%, 1.54%, 0.33%, and 5.14% at CR-17.5 and 2.15%, 5.08%, 3.39%, 4.83%, 2.57%, and 3.78% at CR-19, respectively, compared to uncoated engines, as depicted in Figure S-12. Various studies have shown that using biodiesel can reduce global greenhouse gas emissions, leading to a 50–80% decrease in CO2 emissions compared to fossil fuels9.
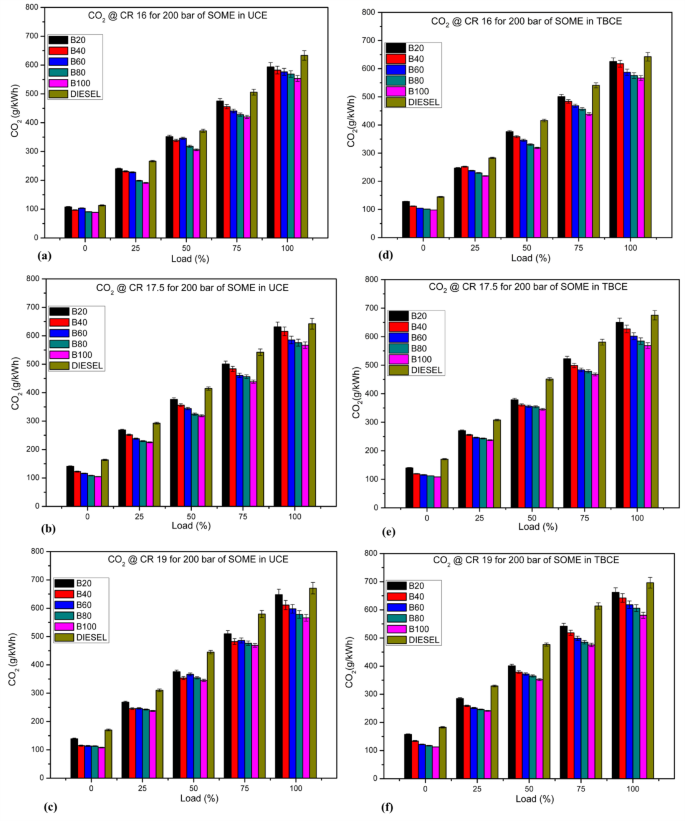
(a–f). The variation of the CO2 at different loads and CRs (16, 17.5 & 19) for SOME blends in both coated and uncoated engine.
Table S-6 in the supplemental paper details the experimental results for performance, combustion, and exhaust gas emission parameters of mullite-coated CI engines at CR 19 for all fuel samples (B20, B40, B60, B80, B100, and Diesel). The comparison is conducted at peak load, ranking the results from highest to lowest. Figure S-13 illustrates the average percentage differences in performance, combustion, and exhaust emission parameters for the test samples B20, B40, B60, B80, and B100 at maximum load compared to conventional diesel fuel (D100). This comparison applies to both coated and uncoated CI engines at CR 17.5 and 19.