Patient characteristics
This study included 36 LSCC patients with lymph node metastasis and 72 without lymph node metastasis. The demographic characteristics of the study cohort are presented in Table 1. There were no significant differences between the two groups in terms of age, sex, smoking status, or alcohol consumption (P > 0.05). The clinical data of the patients are summarized in Supplementary Table S2.
Comparison of microbial diversity between LSCC patients with and without lymph node metastasis
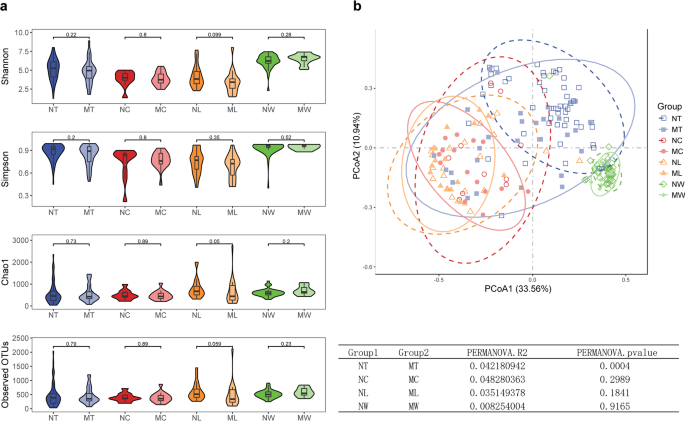
We assessed the microbial diversity in the LN + and LN- groups of LSCC across different sample types. For α-diversity, compared to LN- patients, LN + patients exhibited lower microbial richness in tumor tissues, adjacent normal tissues, and lymph node tissues, whereas the inverse trend was observed in oral rinse samples, as measured by Shannon, Simpson, Chao1, and Observed OTUs indices. However, none of these differences reached statistical significance (Fig. 1a). For β-diversity, PCoA based on Bray-Curtis distances at the genus level revealed distinct clustering between LN + and LN- groups in tumor tissues (P = 0.0004, PERMANOVA), whereas adjacent normal tissues and lymph node tissues showed no significant compositional differences (Fig. 1b). Additionally, compared to tissue samples, microbial taxa in oral rinse samples from both groups exhibited a closer clustering pattern.
Microbial diversity in tumor tissues, adjacent normal tissues, lymph node (LN) tissues, and oral rinses samples of LSCC patients with (LN+) and without (LN-) lymph node metastasis. (a) Comparison of α-diversity between groups. P values were calculated using the Wilcoxon rank-sum test. (b) Principal coordinate analysis (PCoA) plot. P values were derived from permutational multivariate analysis of variance (PERMANOVA). P < 0.05 was considered statistically significant. NT, tumor tissues from LN- patients; MT, tumor tissues from LN + patients; NC, adjacent normal tissues from LN- patients; MC, adjacent normal tissues from LN + patients; NL, non-metastatic lymph node tissues; ML, metastatic lymph node tissues; NW, oral rinses from LN- patients; MW, oral rinses from LN + patients.
Microbial structural discrepancy in lymph node metastasis and non-metastasis groups of LSCC
We compared the relative abundances of the top 15 genera across different sample types (tumor tissues, adjacent normal tissues, lymph node tissues, and oral rinses) in LSCC patients with and without lymph node metastasis (Fig. 2). In tumor tissues, significant differences in microbial composition were observed between the LN + and LN- groups. Specifically, Ralstonia accounted for a substantially higher proportion in LN + tumor tissues compared to LN- tumors (0.172 ± 0.212 (mean ± SD) vs. 0.034 ± 0.079, LN + vs. LN- tumor tissues), whereas Fusobacterium was more prevalent in LN- tumors (0.044 ± 0.077 vs. 0.138 ± 0.169). In contrast, adjacent normal tissues and lymph node tissues exhibited similar microbial profiles between groups, with Ralstonia remaining the most abundant genus in both sample types, regardless of metastatic statu. For oral rinse samples, the overall microbial composition was more similar between LN + and LN- patients. Streptococcus, Neisseria, and Prevotella_7 were consistently the top three abundant genera in both groups. Full statistical data, including percentage distributions and P values for all genera across comparative groups (Supplementary Table S3).
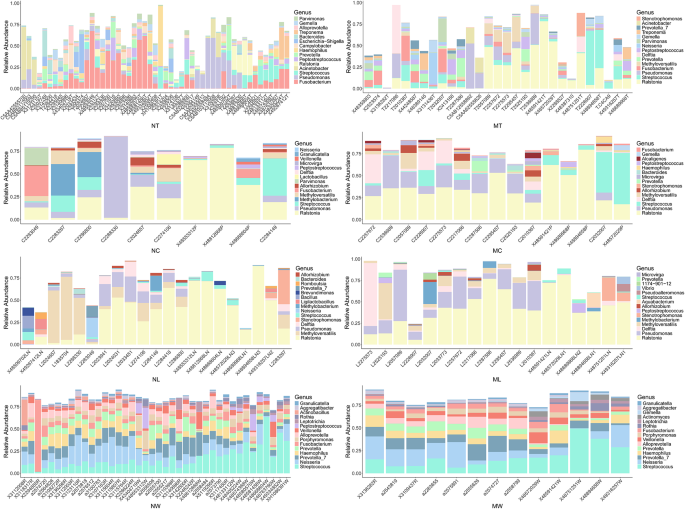
The relative abundance of the top 15 genera in tumor tissue, adjacent normal tissue, lymph node (LN) tissue, and oral rinse samples. NT, tumor tissues from LN- patients; MT, tumor tissues from LN + patients; NC, adjacent normal tissues from LN- patients; MC, adjacent normal tissues from LN + patients; NL, non-metastatic lymph node tissues; ML, metastatic lymph node tissues; NW, oral rinses from LN- patients; MW, oral rinses from LN + patients.
LEfSe analysis identified differentially abundant genera between LN + and LN- groups across various sample types, with heatmaps illustrating relative abundance patterns (Fig. 3). In tumor tissues, the relative abundance of Ralstonia, Methyloversatilis, Delftia, Lactobacillus, and Methylobacterium-Methylorubrum was significantly higher in the LN + group than in the LN- group. Conversely, Fusobacterium, Peptococcus, Sneathia, Moraxella, and [Eubacterium] saphenum group were significantly less abundant in LN + tumor tissues. Metastatic and non-metastatic lymph nodes also exhibited distinct microbial profiles. Bdellovibrio, 1174-901-12, and Ramlibacter were significantly enriched in metastatic lymph nodes, whereas Roseburia, TM7x, Coriobacteriaceae UCG-002, [Eubacterium] nodatum group, Bifidobacterium, and Monoglobus were more abundant in non-metastatic lymph nodes. For oral rinse samples, several genera displayed significant differences between LN + and LN- patients. In LN + patients, the relative abundance of Corynebacterium, Selenomonas, Centipeda, Peptoniphilus, F0058, and Lawsonella was elevated, while [Eubacterium] nodatum group and Oceanivirga were reduced.
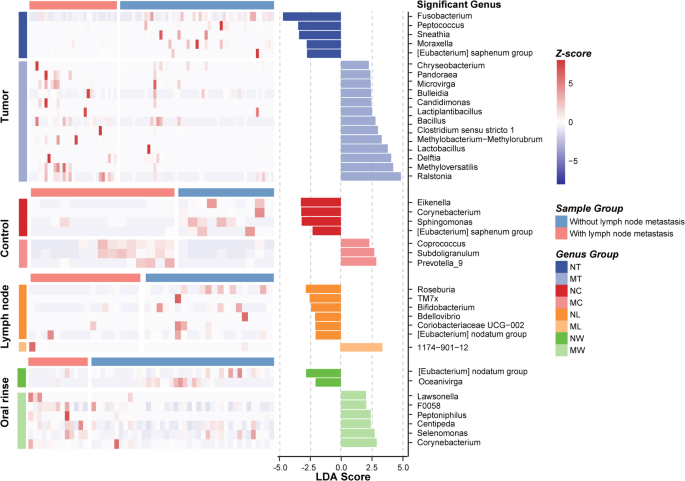
Differential microbial composition between LN + and LN- groups in LSCC patients across tumor tissue, adjacent normal tissue, lymph node tissue, and oral rinse samples. A linear discriminant analysis (LDA) score threshold of |LDA Score| ≥ 2 was used to identify genera with significant differences between LN + and LN − LSCC patients across different sample types. The bar plot displays these differentially abundant genera, while the heatmap illustrates their relative abundance. NT, tumor tissues from LN- patients; MT, tumor tissues from LN + patients; NC, adjacent normal tissues from LN- patients; MC, adjacent normal tissues from LN + patients; NL, non-metastatic lymph node tissues; ML, metastatic lymph node tissues; NW, oral rinses from LN- patients; MW, oral rinses from LN + patients.
Venn diagram analysis of microbial community distribution revealed shared and unique microbial features across different sample types in LSCC (Fig. 4a). At the genus level, 227 genera were universally present in all four sample types, with no genus exclusively unique to any single sample type. Additionally, 29 genera, including 1174-901-12, Pandoraea, Hoeflea, and Sphingobium, were shared among tumor tissues, adjacent normal tissues, and lymph node tissues but were absent in oral rinse samples. And 7 genera (Pseudoalteromonas, Comamonas, Oceanivirga, CL500-29 marine group, Citrobacter, F0332, and Conservatibacter) were detected in tumor tissues, lymph node tissues, and oral rinse samples, but not in adjacent normal tissue. Notably, all genera identified in lymph node tissues were concurrently observed in tumor tissues.
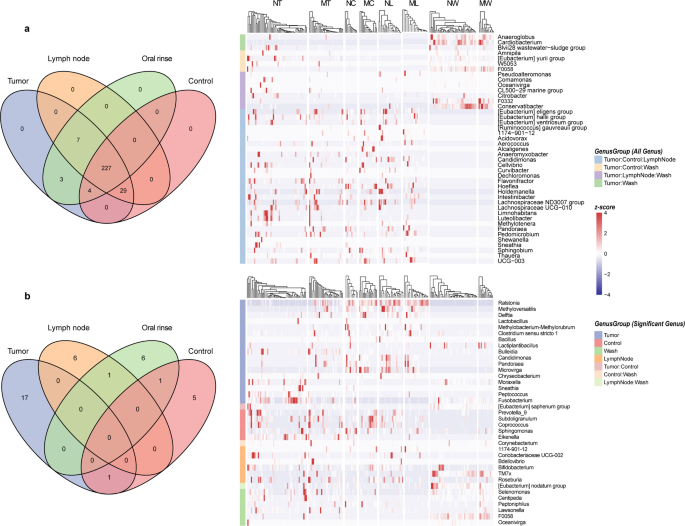
Venn diagrams illustrate the distribution of microbial communities in tumor tissue, adjacent normal tissue, lymph node tissue, and oral rinse samples. (a) Overlapping and unique genera across sample types are presented, with a heatmap depicting the relative abundances of genera. (b) Overlapping and distinct distributions of differentially abundant genera across sample types are shown, further visualized by a heatmap. NT, tumor tissues from LN- patients; MT, tumor tissues from LN + patients; NC, adjacent normal tissues from LN- patients; MC, adjacent normal tissues from LN + patients; NL, non-metastatic lymph node tissues; ML, metastatic lymph node tissues; NW, oral rinses from LN- patients; MW, oral rinses from LN + patients.
We then examined the distribution of genera that exhibited significant differences in relative abundance between the LN + and LN- groups across different sample types (Fig. 4b). No genera exhibited significant abundance differences in all four sample types. However, 17 genera (Ralstonia, Bulleidia, Fusobacterium, etc.) showed differential abundance exclusively in tumor tissues between the LN + and LN − groups. Distinctly differentially abundant genera were also identified in adjacent normal tissues, lymph nodes, and oral rinses. Furthermore, [Eubacterium] nodatum group was shared between lymph node and oral rinse samples, showing consistent enrichment in LN- groups for both sample types.
Functional analysis of metastatic and non-metastatic LSCC patients
The relative abundances of the top 20 predicted metabolic pathways were compared between specimens from the LN + and LN- groups (Fig. 5). Tumor tissues were enriched in pathways related to nucleotide metabolism (e.g., UMP biosynthesis I, superpathway of adenosine nucleotides de novo biosynthesis II), carbohydrate utilization (e.g., Calvin-Benson-Bassham cycle, pentose phosphate pathway [non − oxidative branch] I), and lipid biosynthesis (e.g., phosphatidylglycerol biosynthesis II [non − plastidic], CDP − diacylglycerol biosynthesis I). In contrast, adjacent normal tissues and lymph node tissues exhibited more similar functional profiles, characterized by pathways associated with energy metabolism, fatty acid synthesis, and amino acid biosynthesis, such as aerobic respiration I (cytochrome c), palmitate biosynthesis (type II fatty acid synthase) and superpathway of branched chain amino acid biosynthesis. Oral rinse samples displayed a distinct functional profile, including pathways involving not only nucleotide and carbohydrate metabolism, but also peptidoglycan biosynthesis (peptidoglycan biosynthesis III). In addition, inter-individual variability in pathway distribution within each group was relatively low across all sample types, indicating functional consistency among patients with the same lymph node metastasis status.
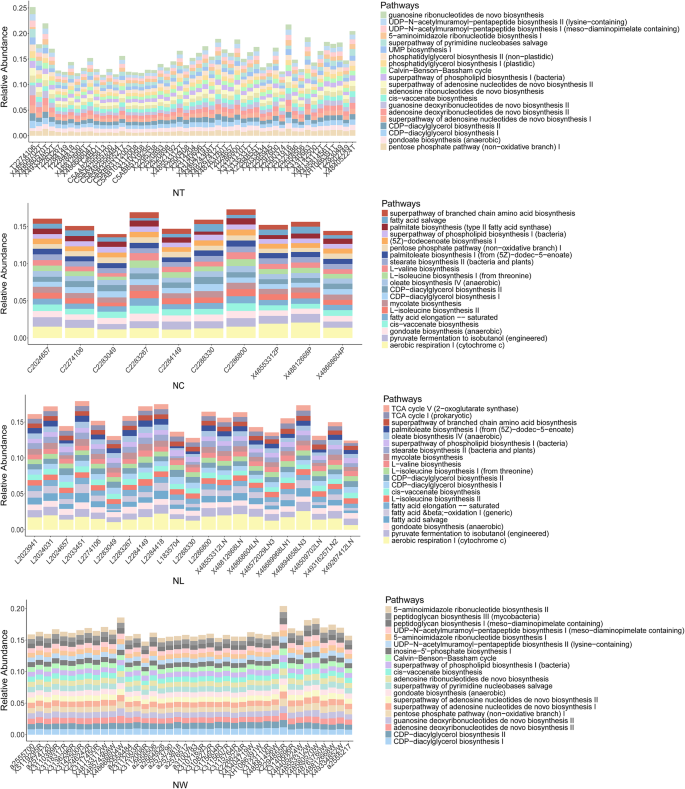
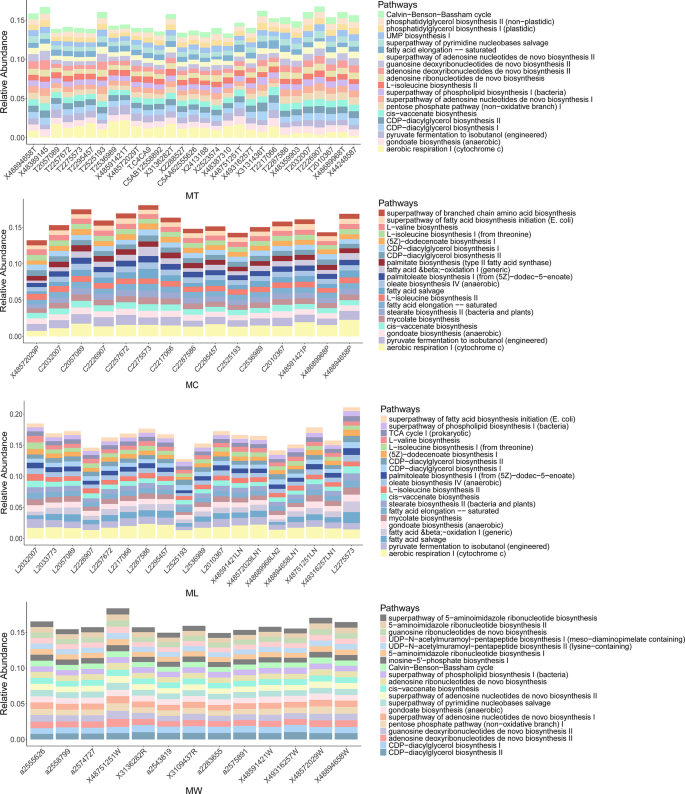
The relative abundance of the top 20 predicted microbial metabolic pathways in tumor tissue, adjacent normal tissue, lymph node (LN) tissue, and oral rinse samples. NT, tumor tissues from LN- patients; MT, tumor tissues from LN + patients; NC, adjacent normal tissues from LN- patients; MC, adjacent normal tissues from LN + patients; NL, non-metastatic lymph node tissues; ML, metastatic lymph node tissues; NW, oral rinses from LN- patients; MW, oral rinses from LN + patients.
LEfSe analysis further revealed differentially abundant metabolic pathways between LN + and LN- groups across the four sample types (Fig. 6). In tumor tissues, pathways related to aerobic energy production (e.g., aerobic respiration I [cytochrome c]) and ubiquinol biosynthesis were enriched in LN + tumor tissues, while LN- tumors were characterized by pathways associated with basic biosynthetic functions, including pyruvate fermentation to acetate and lactate II and superpathway of L-aspartate and L-asparagine biosynthesis. In metastatic lymph node tissues, mycolate biosynthesis, which is a pathway associated with bacterial pathogenicity, was significantly enriched. And in oral rinse samples, the LN + group showed increased abundance of pathways involved in bacterial cell wall synthesis, such as poly (glycerol phosphate) wall teichoic acid biosynthesis and peptidoglycan biosynthesis II (staphylococci).
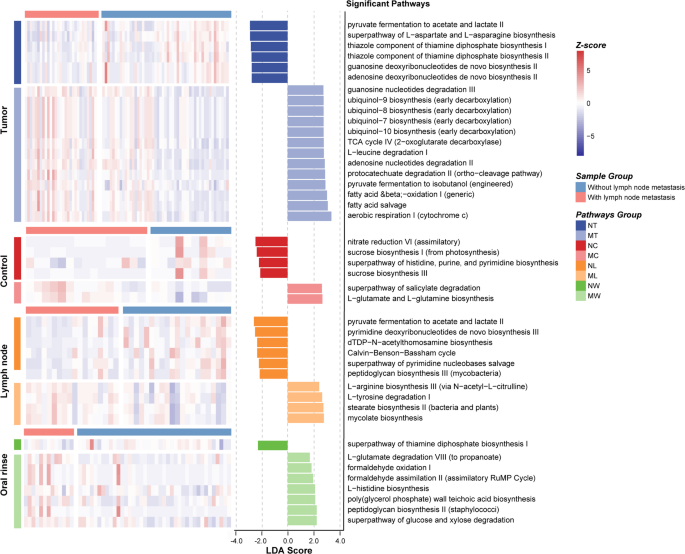
Differential predicted microbial metabolic pathways between LN + and LN- groups in LSCC patients across tumor tissue, adjacent normal tissue, lymph node tissue, and oral rinse samples. A linear discriminant analysis (LDA) score threshold of |LDA Score| ≥ 1.5 was used to identify pathways with significant differences between LN + and LN- LSCC patients across different sample types. The bar plot displays these differentially abundant pathways, while the heatmap illustrates their relative abundance. Only pathways with LDA > 2.5 are shown in tumor tissues due to the large number of differentially abundant functions. NT, tumor tissues from LN- patients; MT, tumor tissues from LN + patients; NC, adjacent normal tissues from LN- patients; MC, adjacent normal tissues from LN + patients; NL, non-metastatic lymph node tissues; ML, metastatic lymph node tissues; NW, oral rinses from LN- patients; MW, oral rinses from LN + patients.
Microbial classification models for stratifying LSCC patients by lymph node metastasis status
To evaluate the potential of microbial features in distinguishing LSCC patients with and without lymph node metastasis, we developed random forest classifiers using microbial genera from tumor tissues, lymph node tissues, and oral rinses. For each sample type, 25 key genera were selected as classification features (Fig. 7a). The classifier based on lymph node tissues achieved an AUC of 84.31% (95% confidence interval [CI]: 81.76% − 86.85%), followed by tumor tissues (AUC = 84.11%, 95% CI: 81.75% − 86.46%) and oral rinses (AUC = 79.88%, 95% CI: 77.09% − 83.11%) (Fig. 7b). To evaluate biological relevance, PERMANOVA analyses were applied to the 25 key genera from each sample type. Significant differences in microbial community structure between LN + and LN- groups were identified in tumor tissues (P = 0.0001), lymph node tissues (P = 0.0006), and oral rinses (P = 0.005) (Supplementary Figure S2).
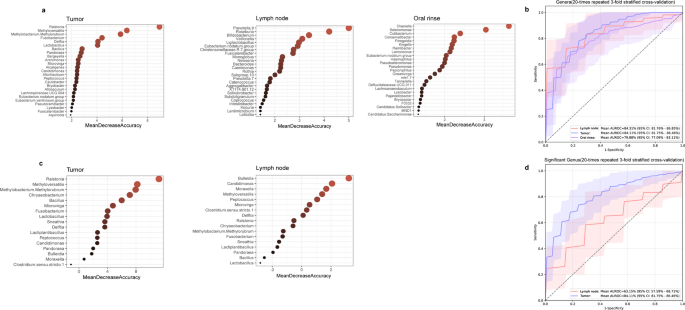
Identification of microbial biomarkers for lymph node metastasis in LSCC patients by random forest models. (a) Mean Decrease Accuracy (MDA) values from random forest models based on 25 selected microbial biomarkers in tumor tissues, lymph nodes, and oral rinses. (b) Receiver operating characteristic (ROC) curves and area under the curve (AUC) values for tumor tissues, lymph nodes, and oral rinses. (c) MDA values of 17 tumor-specific differentially abundant genera in tumor tissues and lymph nodes. (d) ROC curves and AUC values based on the 17 tumor-specific differentially abundant genera in tumor tissues and lymph nodes.
We further explored the classification potential of 17 tumor-specific differentially abundant genera (Ralstonia, Bulleidia, Fusobacterium, etc.) between the LN + and LN- groups (Fig. 7c). A classifier trained on these 17 genera effectively distinguished LN + from LN- patients in tumor tissues (AUC = 84.11%, 95% CI: 81.75% − 86.46%) but showed moderate performance in lymph node tissues (AUC = 63.15%, 95% CI: 57.59% − 68.71%) (Fig. 7d).