Analysis of the total shrinkage and growth of cultivated land
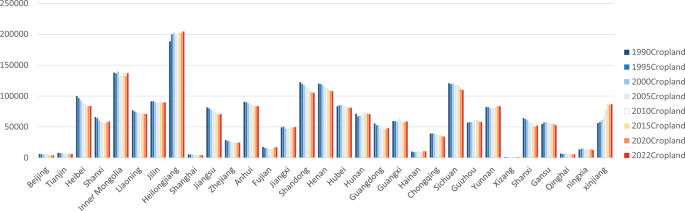
From the perspective of the provincial total amount, the cultivated land in China showed a shrinking trend from 1990 to 2022 (Figs. 1, 2), with large regional contraction differences. In 1990, the total cultivated area of China was 1,965,762.9 square kilometers. In 2022, the cultivated area of China was 1884449.71 square kilometers. The total amount of cultivated land in 31 provinces and municipalities decreased by 81,313.19 square kilometers, with a contraction of 4.14%. The cultivated land in 25 provinces and municipalities directly under the Central Government showed a shrinking trend of 131,687.83 square kilometers, 1.62 times the total reduction across the country. The shrinking provinces accounted for 80.64%, which indicates that the cultivated land contraction in China is characterized by a wide contraction range and large contraction area. The cultivated area in the remaining six provinces showed an increasing trend, with a total increase of 50358.64 square kilometers. This means that China’s goal of a dynamic balance of cultivated land has basically been achieved, but regional differences still exist. Comparing (Figs. 1, 2), the cultivated land contraction is mainly concentrated in the economically developed areas of the southeast coast. The cultivated land growth provinces are mainly concentrated in the northeast, northwest, and southwest and other remote border areas and economically underdeveloped areas. This also shows that the increase and decrease in cultivated land is significantly related to the level of economic development.
Changes in the total cultivated land by province in China from 1990 to 2022.
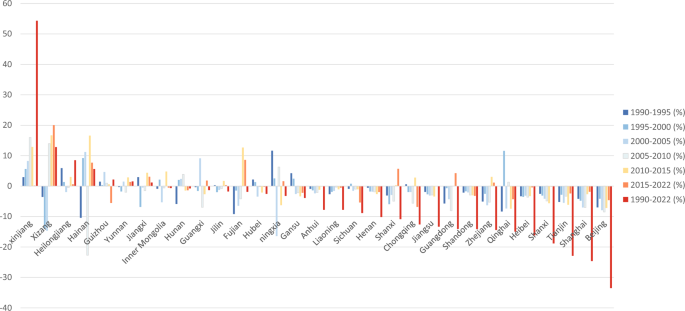
Dynamics of the growth and shrinkage of cultivated land in various provinces of China.
According to the analysis of the cultivated land change amplitude in each province, Beijing (Q = −33.52%), Shanghai (Q = −24.63%), and Tianjin (Q = −22.91%) are among the top three in China (Table 1). Nearly a third of Beijing’s arable land is occupied. A fifth of the cultivated land in Shanghai and Tianjin is occupied. This shows that the large-scale development and construction of municipalities directly under the Central Government has brought a serious decrease in the amount of cultivated land resources. China’s major grain output provinces, including Shandong, Henan, Hunan, and other regions, have also shown a decrease in the cultivated area, posing a serious threat to China’s food security. In addition, cultivated land in Xinjiang (Q = 54.33%), Xizang (Q = 12.81%), Heilongjiang (Q = 8.51%), Hainan, Guizhou, Yunnan, and Jiangxi showed an increasing trend. Most of these provinces are located in areas with low urbanization and a low economic level. Xinjiang has the most prominent increase in cultivated area, with a cumulative increase of 30,549.3 square kilometers, accounting for 37.57% of the country’s cultivated area growth. This shows that cultivated land in China has shown new characteristics in spatial change. After 2005, the cultivated land growth rate in Xinjiang increased rapidly, mainly due to the balance policy of cultivated land occupation and compensation implemented by the state in 2006. A large number of developed regions have used the province’s development funds to purchase Xinjiang cultivated land indicators to achieve a balance between cultivated land occupation and compensation in this region. When cultivated land is occupied by development and construction, the developed areas purchase and construct the same amount of cultivated land in Xinjiang. This mode achieves the balance of inter-provincial cultivated land occupation and compensation, and at the same time, the investment of funds also drives the economic construction of underdeveloped areas. However, this compensation model for cultivated land is unsustainable. Due to the low annual precipitation in Xinjiang and Xizang, much of the cultivated land consumes a large amount of water resources. The shortage of water resources further destroys the already fragile ecological environment. Therefore, as it exacerbates the problem of water shortage in Xinjiang, this excessive cultivated land occupation and compensation balance model is also unsustainable. In addition, Heilongjiang, Hainan, Guizhou, Yunnan, and Jiangxi provinces are located in the main mountainous areas of China, lacking open plain terrain, which is not conducive to large-scale cultivation and offers limited growth in cultivated areas.
From 1990 to 2022, Xinjiang, Beijing, Shanghai, Tianjin, Shaanxi, and Hebei provinces had higher relative change rates in cultivated land. The relative change rate (R) in the cultivated land in 20 provinces was greater than 1, which indicates that the degree of cultivated land change in these areas was greater than the regional average level. The Huang–Huai–Hai Plain, the Sichuan Basin and its surroundings, the Loess Plateau, and other major grain producing areas have undergone dramatic changes in cultivated land area. Before 2010, the Pearl River Delta and Yangtze River Delta had the highest cultivated land loss in China. However, in the past 10 years, Beijing–Tianjin–Hebei, the Central Plains, and the Chengdu–Chongqing regions have had the highest cultivated land loss in China.
Analysis of the spatial evolution characteristics of the cultivated land shrinkage and growth
From the micro-spatial level of districts (Fig. 3a), from 1990 to 2022, 2033 districts and counties experienced a decrease in their cultivated land, accounting for 70.67% of the country. There were 844 districts and counties with cultivated land growth, and the contraction range was significantly larger than the growth range. From 1990 to 1995, the cultivated land increased in 915 districts and counties, and the cultivated land increased by 48,551.37 square kilometers. The cultivated land in 1962 districts and counties decreased by 57938.41 square kilometers. From 2015 to 2022, there were 1214 districts and counties with cultivated land growth, for a total of 46,289.51 square kilometers. The number of districts and counties with cultivated land contraction decreased to 1663, with 54205.48 square kilometers. Comparing the data of the two stages, the basic achievement of the policy goal of a dynamic balance in the increase and decrease in cultivated land in China is proven again. Although the number of growth districts and counties increased significantly, the area of cultivated land growth decreased. This shows that the growth potential of the cultivated land resources in districts and counties of China is limited.
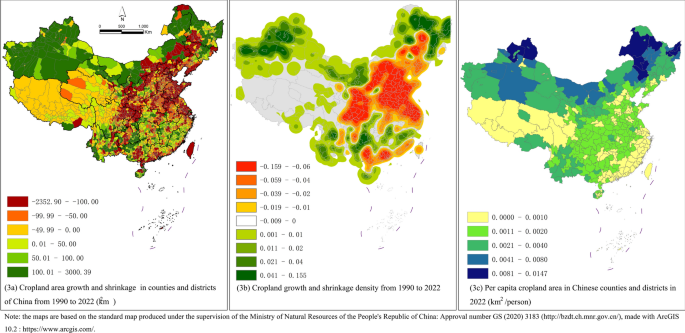
Changes in cropland in Chinese counties and districts from 1990 to 2022, make with ArcGIS 10.2: https://www.arcgis.com/.
The cultivated land in China shows a spatial pattern of planar contraction and banded growth (Fig. 3b). The growth districts and counties mainly formed two belt structures of “Xinjiang–Inner Mongolia–Heilongjiang” and “Yunnan–Guizhou–Jiangxi”. The cultivated area of Nenjiang City in Heilongjiang Province increased by 3000.39 square kilometers, ranking first in the country. The cultivated land in six districts and counties in Heilongjiang Province, four districts and counties in Xinjiang, and two districts and counties in Inner Mongolia increased by more than 1000 square kilometers. Large-scale cultivated land growth is mainly concentrated in this belt structure, which is also not conducive to the balanced development of cultivated land resources. The belt structure of “Xinjiang–Inner Mongolia–Heilongjiang” is limited by water resource scarcity and the population scale (Fig. 3c), and the growth in cultivated land resources will slow in the future. The belt structure of Yunnan–Guizhou–Jiangxi is restricted by mountains, hills, and water systems, and the growth potential of cultivated land resources will weaken. The districts and counties with shrinkage form a planar contraction mechanism. The planar structure is mainly concentrated in the Huang–Huai–Hai Plain, the middle and lower reaches of the Yangtze River, the Loess Plateau, and the Sichuan Basin and its surrounding areas. The loss of cultivated land in the Huang–Huai–Hai Plain is mainly concentrated in the Beijing–Tianjin–Hebei region. In particular, the loss of cultivated land along the Shijiazhuang–Zhengzhou line is obvious. In the middle and lower reaches of the Yangtze River, the cultivated land loss is mainly concentrated in the core areas of the Yangtze River Delta, such as Shanghai–Suzhou–Nanjing, Jiaxing–Hangzhou–Ningbo, and other areas along the Yangtze River. The loss of cultivated land in the Sichuan Basin mainly occurred in the Chengdu–Chongqing urban agglomeration area. In other areas, the loss of cultivated land is mainly in the surrounding areas of provincial capitals.
The cultivated land changes gradually formed a planar spatial clustering model. The hot spot growth areas were mainly concentrated in the northeast, northwest, and southwest regions. The hot spot contraction areas were mainly concentrated in the Central China Plain, Chengdu Plain, and the South China coastal areas. The spatial spillover effect of the cultivated land contraction in the Central China Plain and the Sichuan–Chongqing Plain was the most obvious, which is closely related to the development strategy of the national industrial center moving northward and western development.
In order to describe the spatial evolution characteristics of the cropland growth and contraction in China, we used the kernel density tool in the GIS to analyze the cropland change in China from 1990 to 2022. When the kernel density value of the cultivated land’s increase is positive, it means that the cultivated land in the study area is increasing during the study period. With the opposite, the cultivated land shows a shrinking trend. The results show that the cultivated land in China has the characteristics of alternating growth and contraction. The cultivated land in China no longer shows the previous trend of “increasing in the west and decreasing in the east”, but it shows a new characteristic of “increasing in the southwest, northwest, and northeast” and decreasing in the central part. From 1990 to 2000, China’s cultivated land alternately increased and decreased (Fig. 4). The cultivated land contraction structure was dominated by dots, and the cultivated land growth pattern was surrounded by belts. During this period, the total amount of cultivated land was dynamically balanced, and the occupation of cultivated land was linked to the completion of development and reclamation. With the rapid development of urbanization in China, a planar contraction structure centered on the Central Plains gradually formed. From 2000 to 2005, the cultivated land in China showed a significant spatial distribution characteristic of “increasing in the west and decreasing in the east.” The Yangtze River Delta, Beijing–Tianjin–Hebei, and other regions have developed rapidly, and the cultivated land has also rapidly formed a planar contraction structure. In order to curb the rapid spread in the areal contraction of cultivated land, the China government revised the Land Management Law in 1998.The basic cultivated land protection system was improved, and land protection systems such as “occupying one for one” of cultivated land occupied by construction and the collection of paid use fees for new construction land have been established. However, there are loopholes in these systems. For example, there is no reference to the quality of the supplementary cultivated land and no limitation on the scope of the compensation. These loopholes have led to the phenomenon that cultivated land makes up the difference, and a cross-provincial occupation and compensation balance occurs in the implementation process in many areas. This has led to the stable development of the spatial pattern of “increasing in the west and decreasing in the east” in terms of the cultivated land in China. This pattern continued until around 2010. In 2008, China formulated the Outline of the National Land Use Master Plan, reaffirming the strategic orientation of “the red line of 1.8 billion mu of cultivated land.” The cultivated area in the southeast coastal and central plains regions has increased significantly since. In 2017, the state once again issued Opinions on Strengthening Cultivated Land Protection and Improving the Balance of Occupation and Compensation. The opinions once again emphasized the “trinity” protection system of cultivated land and required all regions to implement the strictest cultivated land protection system. From 2015 to 2022, the cultivated land contraction pattern gradually changed into a belt contraction pattern, while the cultivated land growth pattern changed from a belt growth pattern to a plane growth pattern. Under the strict cultivated land protection system, cultivated land in China has seen a remarkable growth trend. Obviously, the growth and contraction in cultivated land in China have shown the characteristics of repeated alternating changes. With the change in the cultivated land system in China, cultivated land in China presented a zonal growth structure with dot growth as auxiliary, and the zonal growth gradually changed into a planar growth pattern. Cultivated land in China also presents a new pattern of cultivated land contraction, which is mainly planar and supplemented by dots. The planar contraction structure gradually changed into a new pattern of belt contraction and shows a trend in which cultivated land growth is stronger than cultivated land contraction.
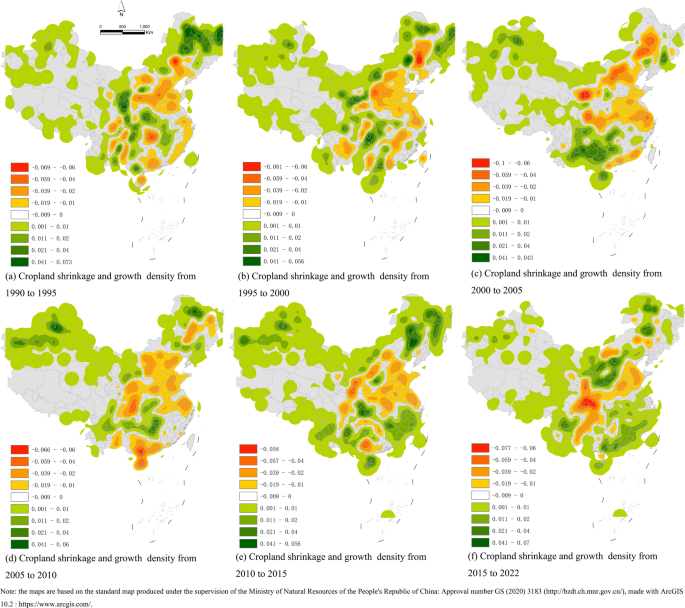
Distribution in the kernel density for the growth and shrinkage of cropland in China, make with ArcGIS 10.2: https://www.arcgis.com/.
Analysis of the cultivated land shrinkage and growth trend in China
In order to further describe the trend in the contraction and growth of cultivated land in China in detail, we used the standard deviation ellipse tool in ArcGIS10.2 to carry out segmented analysis on the change track of the cultivated land from 1990 to 2022 (Fig. 5) in order to depict the change track for the future growth and contraction of cultivated land in China. First, the center of gravity of cultivated land contraction moved to the northeast, then to the south, and then to the northwest. It showed a shrinking trend in the cultivated land across the “Hu–Huanyong Line.” The center of gravity of the cultivated land growth moved southward first, then northwestward, and then retreated southeastward. The center of gravity of the cultivated land growth presented an obvious southeastward moving trend. The growth and contraction in the cultivated land showed reverse trends of development. Secondly, from the perspective of the standard deviation ellipse change, there was no obvious difference in the major axis, minor axis, area, and direction of the cultivated land contraction in China from 1990 to 2005, mainly moving in the northeast direction. The contraction of cultivated land was relatively balanced, mainly concentrated in Beijing–Tianjin–Hebei, the Central Plains, and Northeast China. From 2005 to 2010, industry in Northeast China experienced a depression, and industries in Beijing, Tianjin, Hebei, the Central Plains, and other regions began to grow, and a large amount of cultivated land was occupied by urban construction and industrial development. During this period, the major axis of the cultivated land contraction ellipse became shorter, and the center of gravity moved to the southwest, resulting in the obvious southward movement of the ellipse. In 2008, the government proposed to implement the strictest cultivated land protection system and promulgated relevant laws and regulations. From 2010 to 2015, the major axis and minor axis of the cultivated land contraction ellipse became shorter, and the trend in the cultivated land contraction was obviously inhibited. However, from 2015 to 2022, the major and minor axes of the cultivated land contraction ellipse increased significantly, and the center of gravity moved westward significantly, showing a trend of cultivated land contraction crossing the “Hu–Huanyong Line.” The center of gravity of the cultivated land contraction moved to the periphery of the Chengdu–Chongqing area. This is also closely related to the gradual shift in the focus of industrial development to western China. With China’s western development strategy, the cultivated land around the Chengdu–Chongqing area has also shown an obvious shrinking trend.
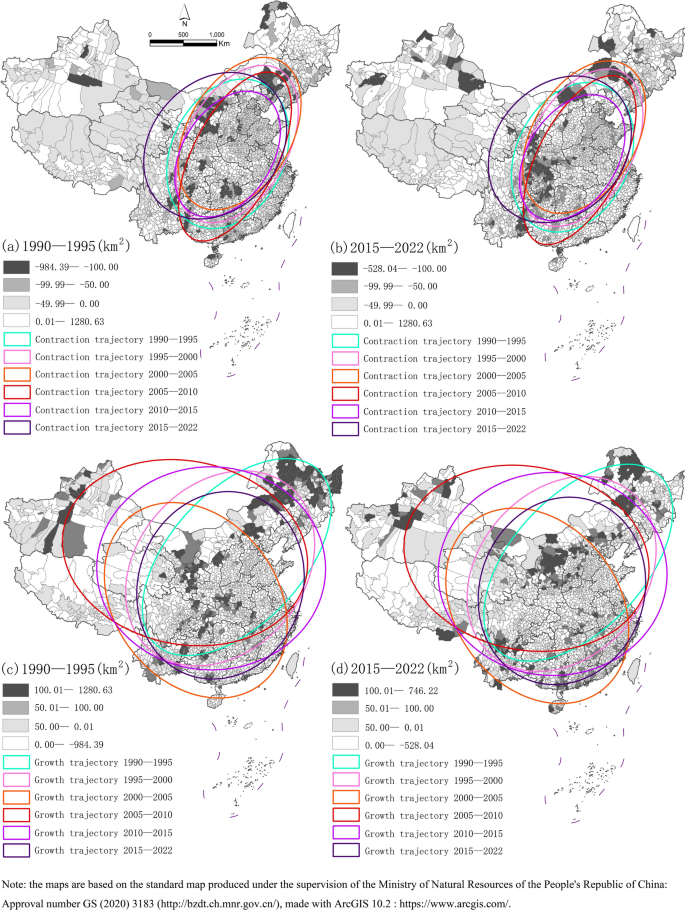
Growth and shrinkage trends of cropland in China, make with ArcGIS 10.2: https://www.arcgis.com/.
The major axis, the minor axis, the area, and the direction of the ellipse of cultivated land growth have obviously changed (Fig. 5). The major axis, minor axis, and area of cultivated land growth trajectory are larger than those of the contraction trajectory, which indicates that the cultivated land growth scope is relatively dispersed. From 1990 to 2000, the direction in the cultivated land growth and contraction ellipse was basically the same. However, the X axis of cultivated land growth became longer, and the center of gravity of cultivated land growth shifted from the northeast to the northwest. With the introduction of the new Land Management Law in 1998, the land policy of occupation and compensation balance was introduced. Since 2000, the growth track of cultivated land has obviously shifted to the northwest and southwest of China, and the growth center has obviously shifted westward. With the further support of the land policy of a balance between occupation and compensation, the focus of cultivated land growth from 2005 to 2010 was further shifted to Xinjiang, Inner Mongolia, and other economically underdeveloped remote areas. In 2008, the State Council issued the Circular on Promoting Economical and Intensive Land Use. The Third Plenary Session of the Seventeenth Central Committee of the Communist Party of China adopted the Decision on Several Major Issues Concerning Promoting Rural Reform and Development. It is stipulated that a strict and standardized rural land management system should be improved to protect cultivated land and adhere to the red line of 1.8 billion mu of cultivated land. These special laws, regulations, and policies formulated for the protection of cultivated land have greatly promoted the growth of cultivated land. From 2010, the growth center of cultivated land in China began to move to the developed provinces in the southeast coast. After 2010, the growth track of cultivated land moved southward. In 2015, the demarcation of permanent basic cultivated land began, and the policy of cultivated land occupation and compensation balance was improved from 2017 to 2018.The center of gravity of the cultivated land growth completely shifted to the south, and the cultivated land growth in northwest and northeast China slowed. The southeast has become the new center of arable land growth, including Guangdong, Fujian, Zhejiang, and other southeast coastal provinces. To summarize, China’s cultivated land contraction shows a trend of moving westward across the “Hu–Huanyong Line”, and cultivated land growth showed a trend of moving southeast across the “Hu–Huanyong Line”. In the process of cultivated land growth and contraction, industrialization, urbanization, and corresponding national land policies in China have played an obvious driving role.
Analysis of the influencing factors
Maintaining a dynamic balance of cultivated land is the fundamental guarantee to solve the problem of food security, and the policy of cultivated land protection plays an important role in this. From the above research results, the spatial distribution characteristics of the cultivated land growth and contraction in China’s cities are obviously different. The evolution trend of cultivated land is also highly consistent with the urbanization construction stage of each region. The core factor that leads to the difference in cultivated land in different regions lies in the national land policy. Urbanization and industrialization must also depend on national land policy, and the speed and scale of land supply will also directly affect the speed and scale of urbanization and industrialization. Based on this, the increase or decrease in urban cultivated land is also significantly related to urbanization and industrialization. Existing studies mainly analyze the changes in cultivated land growth from the aspects of topography, climate, economy, location, and national policy46,47,48. Few scholars have analyzed the change in cultivated land in China from the perspective of urban development and construction. Therefore, this study selected the urban development indicators related to urbanization and industrialization to explore the impact of urbanization and industrialization on cultivated land change in China. This study explored the main factors affecting the spatial distribution of urban cultivated land’s increase and decrease in China from the aspects of urban population size, economic level, industrial and agricultural scale, and other land use scales. This study provides a basis for policy making to deal with the contraction in cultivated urban land caused by excessive urbanization and industrialization. We used the correlation analysis and regression analysis in SPSS19.0 software. We analyzed the impact of urbanization on the growth and contraction in urban cultivated land in China, such as the urban population scale, economic level, industrial structure, and other types of land use scales, and constructed a multivariate explanatory model for the growth and contraction in urban cultivated land in China. First, we used correlation analysis to screen out the variables that were highly related to the change in cultivated land in China. Stepwise regression was used to screen variables with multicollinearity and exclude variables with lower explanations from the model. Then, we carried out multiple linear regression analysis between the significantly related variables and the scale of urban cultivated land. The“forced entry”analysis model was adopted to gradually eliminate the influencing factors with weak collinearity and low correlation such as urban tourism, urban construction land area, and urban real estate development investment. Finally, the key variables with a high correlation degree, strong fitting degree, and high collinearity with cultivated land change were obtained (Table 2).
From the results of the statistical analysis (Table 2), it can be seen that the Sig. value of the explanatory model with cultivated land size as the dependent variable was 0.000a49. The Sig. values of each variable were also less than 0.05, which indicates that the statistical significance of the explanatory model is strong50. There was significant correlation between the dependent and independent variables. The absolute value of the T-test value of each independent variable was greater than 1.96, which also indicates that the independent variables have a significant impact on the interpretation of the model. Second, the collinearity VIF values of the explanatory models were all less than 7.5, which also excludes collinearity between the independent variables. In addition, the R2 values of this interpretation model were all greater than 0.5, and the residual histogram of the interpretation model was also normally distributed (Fig. 6). This further illustrates that the explanation model has strong robustness, good quality, and a high fitting degree. The explanatory model has strong statistical significance. The interpretation model can be used to explain the impact of urbanization on cultivated land change in China. The explanatory model is as follows:
$$begin{aligned} Y & = {8318}.{346} + {6}.{274}X_{1} – {248}.{495}X_{2} – 0.0{25}X_{3} + 0.0{57}X_{4} \ & – , 0.{497}X_{5} – {56}.{335}X_{6} – {23}.{56}X_{7} + 0.0{73}X_{8} + {2}.{433}X_{9} + 0.{4}0{1}X_{10} – {3}0.{23}X_{11} \ end{aligned}$$
(5)
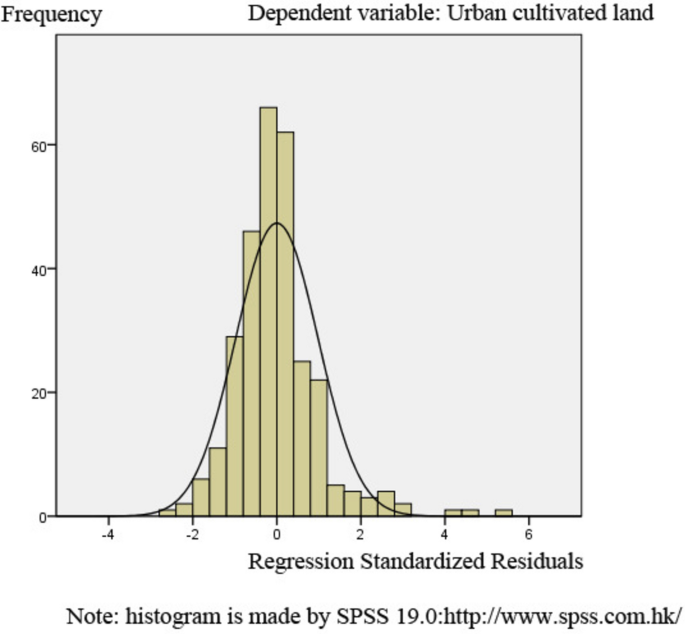
Standardized residual histogram, make with SPSS 19.0: https://www.spss.com.hk/.
The urban population, urban economy, agriculture and industry, urban emissions, and other types of urban land are all significantly related to the increase and decrease in the urban cultivated land area. First, the natural population growth rate has the most significant effect on the increase and decrease in the urban cultivated area. Under the condition that other the independent variables remain unchanged, the cultivated area will decrease by 248.495 square kilometers for every 1‰ increase in the natural growth rate of the urban population. Properly promoting the natural growth of the urban population is conducive to the growth in the urban cultivated land area. However, since 1963, China’s national natural population growth rate has continued to decline, with a national natural population growth rate of minus 1.5‰ in 2023. It is relatively difficult to achieve a positive growth rate in the natural population nationwide. The continuous decline in the natural population growth rate has also become one of the main reasons for the continuous reduction in cultivated land. In addition, the urban GDP per capita significantly inhibited the growth in cultivated land area. When the per capita GDP of the city increases by CNY 10,000, the urban cultivated land decreases by 0.025 square kilometers. The more developed the urban economy, the higher the per capita GDP, which further compresses the cultivated land, which provides a relatively low income. Cultivated land is squeezed by other high-income spaces, and the cultivated area is significantly reduced. Obviously, a rapid improvement in the urban economic level occupies a large area of cultivated land. Local governments need to pay attention to the amount of cultivated land and quality while developing a local economy. In addition, the number of urban industries also showed a significant negative correlation with the cultivated land area. For every increase in the number of industrial enterprises in a city, the urban cultivated area shrinks by 0.497 square kilometers. The more significant the growth in the urban industrial scale, the more obvious the contraction in the urban cultivated area. Local governments should eliminate inefficient industrial enterprises with low production capacity and low output efficiency in time and revitalize inefficient urban industrial land. Local governments should properly control the occupation of basic cultivated land by new industrial land, which will help the growth in urban cultivated land. In addition to the replacement of urban cultivated land by industrial land, our study also found that urban residential land and landfill land have caused a decrease in urban cultivated land. For every 1 square kilometer of residential land added to the city, the city loses 23.560 square kilometers of cultivated land. The scale of cultivated land destruction is very significant. In the era of real estate as the pillar industry of urbanization in China, a large amount of residential land has occupied cultivated land, developing it into real estate. Local governments should pay attention to protecting cultivated land in the process of subsequent urban development and construction, to effectively prevent more cultivated land from being occupied by real estate. In addition, with the increase in the urban resident population, the scale of landfills with urban domestic waste becomes larger. These landfill sites are generally located in suburban areas. Landfill occupies cultivated land itself and also affects the growth of crops in the surrounding cultivated land. Large-scale domestic waste landfills also have a significant squeezing effect on the scale of cultivated land. Finally, we also found that the size of cultivated land was related to the concentration of fine particles in the urban air. The lower the concentration of fine particles in the urban air, the larger the cultivated land scale. Obviously, a large amount of cultivated land helps to absorb some fine particles, purify urban air, and improve urban air quality.
In addition, we also found factors that promoted growth in cultivated areas. The total urban registered population, urban primary industry employees, urban forest area, and urban and rural road area were positively correlated with the cultivated land area. The urban registered population is correlated with the total amount of urban cultivated land. The higher the registered population, the more cultivated land ownership should continue to increase, to ensure the basic food security of the registered population. In addition, in the process of rapid urbanization in China, a large number of rural people have entered the city to work. The scale of employees in the primary industry has decreased greatly, resulting in a large amount of cultivated land in rural areas being abandoned. Appropriate stimulation of the scale of employees in the primary industry and an increase in the wage level of employees in the primary industry are conducive to the growth in the cultivated land scale. The increase in the urban forest area and in urban and rural road area also contributed to the increase in the cultivated area. Forests can introduce water resources, which are conducive to cultivated land. Increases in the forest area and cultivated land scale mutually promote each other. Finally, we were surprised to find that the increase in the urban and rural road areas contributed to the increase in cultivated areas. The construction of large-scale cement roads for rural areas can help large-scale agricultural machinery and equipment to carry out large-scale farming and can help abandoned cultivated land to be developed again. Local governments should further strengthen infrastructure construction such as urban and rural roads. Reducing the cost of the commuting time between cities and rural areas can help increase the scale of cultivated land in rural areas.
To summarize, the urban population size, economic level, agricultural and industrial scale, and other types of land are the main factors affecting the distribution of urban cultivated land growth and contraction in China. These influencing factors have obvious inhibition or promotion effects on cultivated areas, and any change in the influencing factors in the explanatory model causes the cultivated area to fluctuate. China’s urban local governments should actively control the relevant variables suitable for their own development in combination with the influencing factors of the explanatory model. Combined with relevant impact indicators, the government should formulate corresponding policies for cultivated land protection and restoration. Only in this way can we firmly maintain the red line of 1.8 billion mu of cultivated land and gradually build all permanent basic cultivated land into high-standard cultivated land.