
Twenty-two eyes from 11 patients with acute VKH disease were examined. All patients were female and mean age was 49.2 ± 6.8 (range, 35–60) years. Mean BCVA (logMAR units) of all 22 eyes was 0.24 ± 0.50 (range, − 0.18 to 1.10) before steroid treatment, − 0.02 ± 0.16 (range,−0.18 to 0.30) at baseline (SRD resolution), − 0.08 ± 0.13 (range, − 0.18 to 0.30) at 3 months, − 0.11 ± 0.11 (range, − 0.18 to 0.30) at 6 months, and − 0.12 ± 0.10 (range,−0.18 to 0.22) at 12 months after baseline, showing significant improvements at baseline and at 3, 6, and 12 months compared with that before steroid treatment (p = 0.003, p = 0.002, p = 0.002, and p = 0.001, respectively). In all cases, SRD improved after initial systemic steroid treatment and no SRD recurrence was observed during the subsequent 12-month follow-up. Regarding other clinical parameters during follow-up, relapse of anterior uveitis alone occurred in 2 patients (4 eyes), which resolved with topical steroid treatment. Two patients (4 eyes) experienced both anterior uveitis and choroidal re-thickening, and were treated with oral cyclosporine in addition to oral prednisolone. One patient (1 eye) showed only choroidal thickening, which improved with observation alone. Sunset glow fundus appeared in 4 patients (6 eyes) by 12 months. No patient developed subretinal fibrosis or neovascular membrane during the study period. During the 12-month follow-up period, none of the patients developed cystoid macular edema as confirmed by regular OCT examinations. No instances of retinal vasculitis involving the posterior pole were observed throughout the follow-up period.
Following pulse methylprednisolone therapy (1000 mg/day for 3 days), patients received oral prednisolone starting at 0.8-1.0 mg/kg/day, which was gradually tapered based on inflammatory status. At the 12-month follow-up point, 6 of the 11 patients had successfully discontinued oral prednisolone; the average duration of treatment for these 6 patients was 10.7 ± 1.2 months. The remaining 5 patients were still receiving oral prednisolone at 12 months, with an average daily dose of 5.6 ± 4.8 mg. Additionally, 4 patients were being treated with cyclosporine at the 12-month follow-up (average daily dose 96.3 ± 35.0 mg). Of these 4 patients, 2 received cyclosporine for the management of relapse involving both anterior uveitis and choroidal re-thickening, while the other 2 received it due to concerns about steroid side effects.
Cone contrast scores
Time point at which SRD disappeared on OCT was set as baseline, and cone contrast test was performed at baseline and at 3, 6, and 12 months after baseline. Cone contrast scores of all 22 VKH eyes at baseline and at 3, 6, and 12 months were L-cone: 81.4 ± 36.6, 93.7 ± 23.3, 109.5 ± 23.3, and 108.8 ± 18.2; M-cone: 77.0 ± 37.4, 91.6 ± 32.8, 105.3 ± 24.6, and 104.2 ± 19.1; and S-cone: 68.1 ± 41.3, 83.3 ± 33.3, 95.6 ± 19.6 and 95.5 ± 20.5, respectively. Mean score < 75 (Color Deficient) was observed in S-cone at baseline. Mean score of 75 to < 90 (Possible) was found in L-cone and M-cone at baseline and in S-cone 3 months later. In all cones, the cone contrast scores significantly improved at 6 and 12 months compared with baseline (L-cone: p = 0.005, p = 0.005; M-cone: p = 0.015, p = 0.018; S-cone: p = 0.026, p = 0.021, respectively). Six months after baseline, all cones had a score ≥ 90 (Normal) (Fig. 1a).
Cone contrast scores. a Cone contrast scores for L-, M- and S-cones from serous retinal detachment resolution (baseline) to 12 months later. Scores for all cones are significantly higher at 6 and 12 months than that at serous detachment resolution. *p < 0.05, **p < 0.01; M, months. b Pre-treatment optical coherence tomography with and without cystoid space and changes in cone contrast score. In all cones, from serous retinal detachment resolution (baseline) to 6 months later, cone contrast scores with cystoid space are significantly lower compared with those without cystoid space. At 12 months, no significant difference is observed. *p < 0.05, **p < 0.01; M, months
Additionally, we analyzed whether the presence of cystoid space on OCT before steroid treatment affected the cone contrast score. Pre-treatment OCT revealed 17 eyes without and five eyes with cystoid spaces. Baseline was defined as the time point when both subretinal fluid and cystoid spaces had completely resolved. This protocol ensured that cone density measurements were obtained only after the anatomical normalization of retinal structures. Figure 2 shows a representative case with pre-treatment cystoid spaces, along with corresponding AO images demonstrating improvement in cone density and cone contrast test score during the 12-month follow-up. Cone contrast scores of eyes without cystoid space on pre-treatment OCT at baseline and at 3, 6, and 12 months were L-cone: 94.9 ± 25.4, 100.8 ± 12.6, 116.7 ± 14.5, and 110.4 ± 15.7; M-cone: 90.1 ± 25.8, 101.1 ± 20.8, 113.9 ± 17.0, and 107.8 ± 16.4; and S-cone: 83.2 ± 29.3, 92.9 ± 20.5, 101.7 ± 11.0 and 97.9 ± 20.0, respectively. Cone contrast scores of eyes with cystoid space on pre-treatment OCT at baseline and at 3, 6, and 12 months were L-cone: 35.4 ± 31.1, 69.8 ± 36.1, 87.8 ± 32.7, and 103.6 ± 26.9; M-cone: 32.8 ± 39.3, 56.9 ± 47.8, 79.6 ± 27.0, and 92.2 ± 24.7; and S-cone: 16.8 ± 35.8, 50.6 ± 49.3, 77.2 ± 29.1 and 87.6 ± 22.8, respectively. Cone contrast scores were significantly lower in the presence of a cystoid space than that in the absence of a cystoid space at baseline and at 3 and 6 months (L-cone: p < 0.001, p = 0.005, p = 0.012; M-cone: p < 0.001, p = 0.005, p = 0.012; S-cone: p < 0.001, p = 0.008, p = 0.011, respectively) (Fig. 1b). Twelve months after baseline, cone contrast scores were not significantly different in any cone with or without cystoid space.
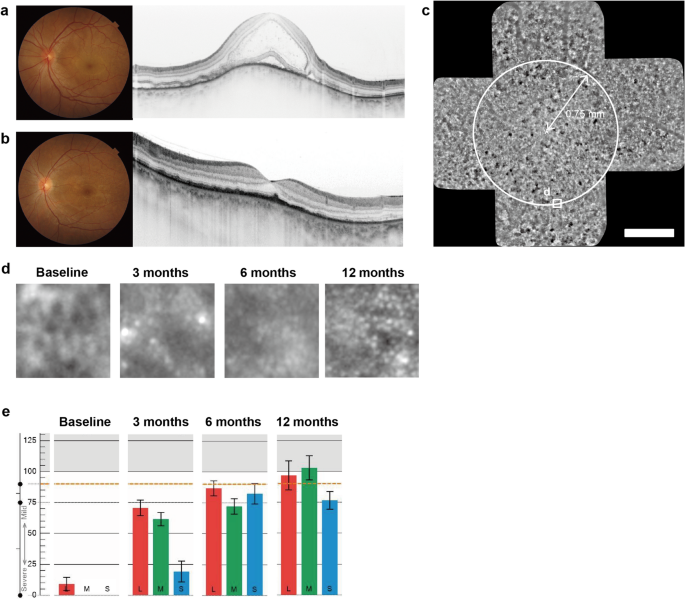
Clinical findings in the left eye of a 35-year-old female patient. a At initial presentation: Fundus photograph and vertical optical coherence tomography (OCT) scan showing serous retinal detachment with cystoid spaces. b After steroid therapy: Fundus photograph and vertical OCT scan at the time of complete resolution of serous retinal detachment (defined as baseline). c Baseline adaptive optics (AO) panoramic image. Asterisk indicates the foveal center. Circles show measurement positions at 0.75 mm from the foveal center. Scale bar = 500 μm. d Longitudinal AO images (80 × 80 μm) at 0.75 mm inferior to foveal center. At baseline, cone mosaic appears blurred, showing progressive improvement during follow-up. e Time course of cone contrast scores. Progressive improvement in scores is observed over time compared to baseline
These results suggest that eyes with VKH have color vision defects at the time of SRD resolution, but it decreases with time. The presence of a cystoid space before treatment significantly decreased the cone contrast compared with the absence of a cystoid space.
Changes in mean cone density
Mean cone densities at 0.75 mm from foveal center of VKH eyes at baseline and at 3, 6, and 12 months were 12,130 ± 5239, 16,490 ± 5529, 17,866 ± 6540, and 20,477 ± 4642 cones/mm2, respectively. Mean cone densities at 3, 6, and 12 months were significantly higher than those at baseline (p < 0.001, p < 0.001, and p < 0.001, respectively) (Fig. 3a). Mean cone densities of eyes without cystoid space on pre-treatment OCT at baseline and at 3, 6, and 12 months were 13,344 ± 5362, 17,936 ± 4480, 20,022 ± 4606 and 21,813 ± 3557 cones/mm2, respectively. Mean cone densities of eyes with cystoid space on pre-treatment OCT at baseline and at 3, 6, and 12 months were 8485 ± 2758, 12,154 ± 6605, 12,690 ± 7787 and 17,004 ± 5725 cones/mm2, respectively. From baseline to 12 months, mean cone density was significantly lower in eyes with cystoid space on pre-treatment OCT at all time points.
(p = 0.035, p = 0.023, p = 0.019 and p = 0.029, respectively) (Fig. 3b).
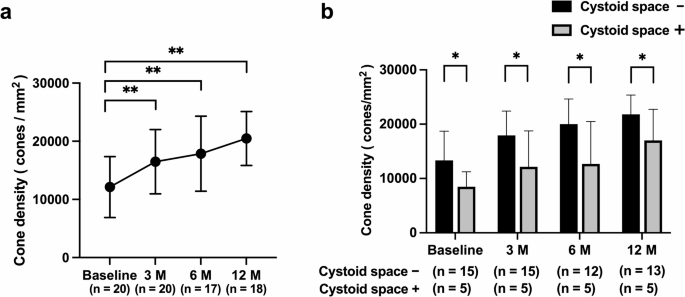
Cone cell density. a Mean cone densities (mean value of nasal, temporal, superior, and inferior areas from foveal center) of patients with Vogt-Koyanagi-Harada disease from serous retinal detachment resolution (baseline) until 12 months later. Mean cone cell density increased significantly at 3, 6, and 12 months compared with that at baseline. Error bars indicate standard deviations. **p < 0.01, M, months. b Pre-treatment optical coherence tomography with and without cystoid space and changes in mean cone densities. From serous retinal detachment resolution (baseline) to 12 months later, mean cone densities with cystoid space are significantly lower compared with those without cystoid space. Error bars indicate standard deviations. *p < 0.05, M, months
Correlation between cone contrast scores and cone density
Relationship between cone contrast scores and mean cone density was also analyzed. Distribution of cone contrast scores and mean cone density at each measurement are shown in Fig. 4. Spearman correlation coefficients between the respective cone contrast scores and mean cone density were ρ = 0.6293 (p < 0.0001) for L-cone, ρ = 0.6649 (p < 0.0001) for M-cone, and ρ = 0.6502 (p < 0.0001) for S-cone, showing a significant correlation in all cones. Cone contrast scores were dependent on the density of cone cells.
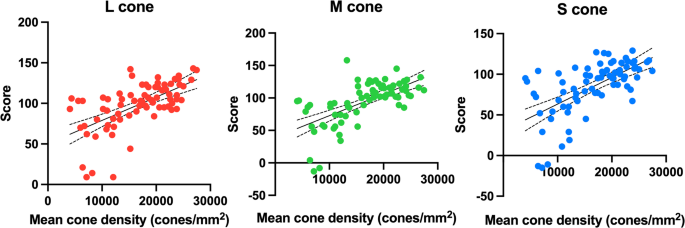
Correlation between cone contrast scores and cone cell density (n = 75). A significant correlation is observed among L-, M- and S-cone contrast scores and mean cone cell density (Spearman correlation coefficient, L-cone: 0.6293, p < 0.0001; M-cone: 0.6649, p < 0.0001; S-cone: 0.6502, p < 0.0001)
Comparison of mean cone density and cone contrast scores between treatment groups: subgroup analysis
In the subgroup analysis, only the baseline L-cone score was significantly lower in the prednisolone (PSL) + cyclosporine (CyA) group (PSL group 94.5 ± 30.3 vs. PSL + CyA group 58.5 ± 36.3, p = 0.021). On the other hand, no significant differences were observed between the two groups in M-cone scores, S-cone scores, and cone density at any time point(Supplementary Table S1). The PSL + CyA group included cases where there were concerns about steroid side effects or those who experienced relapse during steroid dose reduction, and these differences in clinical background may have selectively affected L-cone function. However, the differences between the two groups diminished over the course of treatment, and no statistically significant differences were observed at the final 12-month time point. Therefore, both treatment methods appear to be effective in improving cone function, but these results should be interpreted with caution as the analysis was based on a small number of cases (7 cases in the PSL group, 4 cases in the PSL + CyA group).