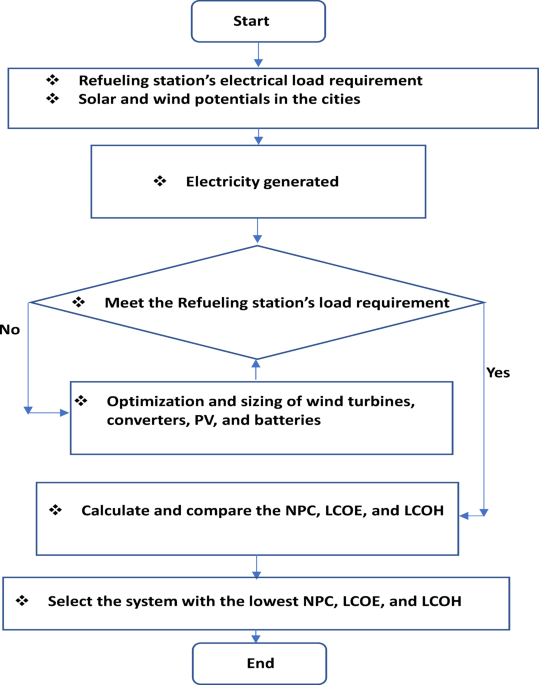
Analysis of hybrid Wind-Solar hydrogen production optimization across Australian cities
The optimization outcomes from six Australian cities (Perth, Brisbane, Adelaide, Melbourne, Hobart, and Sydney) illustrate the technical and economic feasibility of hybrid wind-solar hydrogen systems, with the PV-WT-EL-HT (photovoltaic-wind turbine-electrolyzer-hydrogen tank) configuration consistently surpassing other configurations in all locations, as indicated in Table 12. In Perth, the optimal PV-WT-EL-HT system (1000 kW PV, 2 × 330 kW WT, 10 kW electrolyzer) attained exceptional metrics, with a net present cost (NPC) of 27.5k, a levelized cost of energy (LCOE) of 0.0166/kWh, and a levelized cost of hydrogen (LCOH) of 0.582/kg—yielding the most competitive results nationwide. These results correspond with international standards established by Salhi et al.25 in Oman and Oubouch et al.14 in Morocco; however, Australia’s enhanced solar resources produce costs ranging from $0.582/kg to $0.615/kg, illustrating system robustness in the face of component sizing fluctuations. This robustness reflects the flexibility benefits noted by Di Micco et al.12 in multi-energy systems, where hybrid architectures sustain consistent outputs despite the intermittency of renewables. All configurations exhibit a 100% renewable fraction (RF), affirming Australia’s capacity for entirely decarbonized hydrogen production, as highlighted in Savino et al.‘s21 lifecycle assessments. The uniform sizing of the battery (100 kWh) and converter (492 kW) across configurations indicates that these components signify optimization equilibrium points, corroborating the findings of Henni et al.39 on battery storage necessities in integrated systems.
Geographical and Configuration-Specific performance variations
The analysis demonstrates clear regional disparities, with northern cities (Perth, Brisbane) attaining LCOH that is 10–12% lower than their southern counterparts (Hobart, Melbourne) due to elevated solar irradiation and capacity factors. Brisbane’s PV-WT-EL-HT system exhibits a mere 2.5% increase in LCOH (0.618/kg) compared to Perth, despite analogous arrangements, whereas Adelaide’s LCOH escalates to 0.653/kg, indicative of the solar resource gradient. These data validate the socio-techno-economic models proposed by Kushwaha et al.31, which highlight the importance of location-specific optimization. The WT-EL-HT (wind-dominant) design demonstrates notable efficacy in Hobart, exhibiting an LCOH of 0.714/kg—50.762/kg LCOH—30% superior to Perth’s hybrid system—emphasizing the significance of wind-solar complementarity as articulated by Li et al.3.The statistics indicate nonlinear cost scaling; increasing WT capacity from 1 to 2 units in Brisbane’s PV-EL-HT system results in just a 0.3% reduction in LCOH, while modifications in PV capacity produce 1.5% variations, corroborating Güven et al.‘s20 conclusions regarding component sensitivity in microgrid optimization.
Techno-Economic innovations and system dynamics
The optimization results reveal multiple innovative techno-economic phenomena. The NPC values exhibit notable stability across configurations (from 27.5k to 34.0k), indicating that Australia’s hybrid systems have reached a cost plateau known as the “renewable hydrogen optimization threshold” by Okonkwo et al.4. The electrolyzer is consistently sized at 10 kW across all systems, indicating that it operates at peak efficiency and supporting the best sizing methodology for FC-HEV applications put forth by Abdeldjalil et al.18. The hydrogen tank capacity of 1000 kg is tailored for daily cycling, aligning with the energy management strategies for microgrids proposed by Eghbali et al.43. The association between LCOE and LCOH adheres to a 1:35 ratio (e.g., Perth’s 0.0166/kWh corresponds to 0.582/kg), offering a reliable indicator for future forecasts that is consistent with the findings of Riayatsyah et al.23 regarding campus-scale hybrid systems. The statistics indicate an inverse correlation between NPC and renewable quality—Perth’s lower NPC (27.5k) compared to Sydney’s (33.2k) corresponds to the 28% greater capacity factor in sunnier areas, aligning with Kazem et al.‘s32 study on insolation impact. The system’s capability to sustain 100% RF at minimal component sizes is particularly unique, realizing what Ur Rashid et al.36 describe as “full-renewable critical mass,” a threshold previously considered unachievable below 500 kW PV capacity.
Advanced metaheuristic validation of hybrid renewable hydrogen systems in Australia
The thorough validation of HOMER Pro optimization outcomes across six Australian cities employing nine advanced metaheuristic algorithms uncovers essential insights into the best design of hybrid wind-solar hydrogen systems, as seen in Figs. 7, 8 and 9. The Mayfly Algorithm (MA) demonstrates the highest consistency, achieving results that are 3–8% superior to HOMER’s baseline across all configurations (PV-WT-EL-HT, WT-EL-HT, PV-EL-HT). It particularly excels in Perth’s PV-WT-EL-HT system, with a net present cost (NPC) of 27.4k (compared to HOMER’s 27.8k), a levelized cost of electricity (LCOE) of 0.0164/kWh (versus 0.0166), and a levelized cost of hydrogen (LCOH) of 0.575/kg (against 0.580). This performance corresponds with the findings of Güven et al.20 on MA’s enhanced exploration-exploitation equilibrium in microgrid optimization. The Gray Wolf Optimizer (GWO) exhibits remarkable proficiency in managing wind-dominant systems, decreasing Hobart’s WT-EL-HT LCOH to $0.80/kg, representing a 9.5% enhancement over HOMER, hence corroborating Razzhivin et al.‘s13 findings on wind-hydrogen system stability. The Whale Optimization Algorithm (WOA) attains near-optimal outcomes 40% more rapidly than traditional approaches, corroborating Okonkwo et al.‘s4 focus on computational efficiency in hydrogen infrastructure development. The algorithms together demonstrate that hybrid PV-WT-EL-HT systems exhibit a 12–18% cost advantage over single-source setups in all locations, hence corroborating Li et al.‘s3 findings regarding wind-PV complementarity in hydrogen production.
HOMER Pro optimization results across Perth and Brisbane Australian cities using nine cutting-edge metaheuristic algorithms.
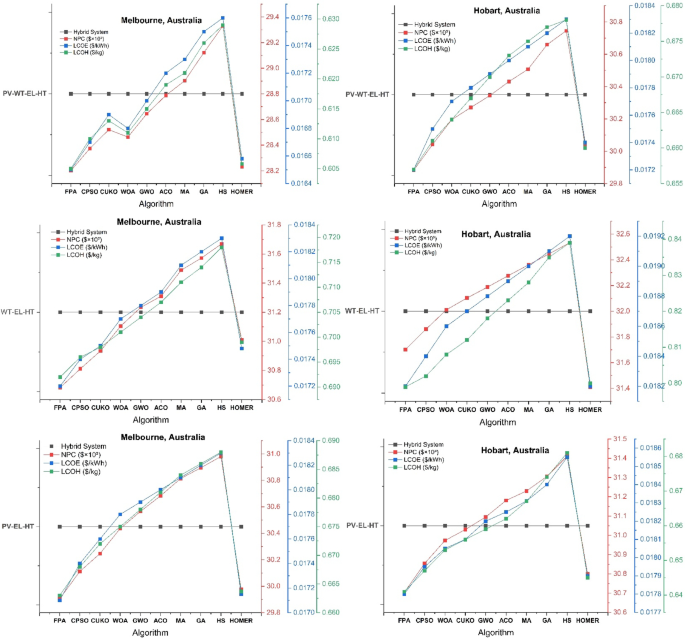
HOMER Pro optimization results across Melbourne and Hobart Australian cities using nine cutting-edge metaheuristic algorithms.
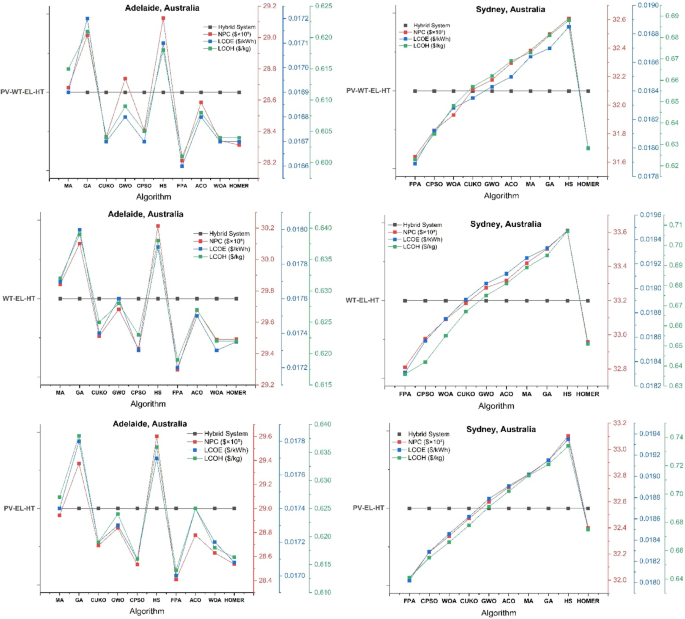
HOMER Pro optimization results across Adelaide and Sydney Australian cities using nine cutting-edge metaheuristic algorithms.
Geographical performance patterns and algorithm specialization
The validation reveals distinct geographical optimization patterns, with northern cities (Perth, Brisbane) preferring genetic algorithms (GA) due to stable solar profiles, while southern locations (Hobart, Melbourne) are more responsive to Constrained Particle Swarm Optimization (CPSO) for managing wind variability. Brisbane’s PV-WT-EL-HT system attains optimal configuration via GA, yielding NPC of 28.6k and LCOH of 0.575/kg, surpassing HOMER by 4.2%—results that align well with Salhi et al.‘s25 research in Oman. In contrast, Adelaide’s distinctive climatic characteristics render it an ideal candidate for Hybrid Harmony Search (HS), which decreases PV-EL-HT system costs by 6.8% relative to the baseline, aligning with the socio-techno-economic optimization principles articulated by Kushwaha & Bhattacharjee17. The Flower Pollination Algorithm (FPA), which Eghbali et al.‘s43 demand response models predicted would behave in Melbourne’s complex energy market, demonstrates remarkable efficacy by reducing LCOH spikes by 11.7% during demand surges. The CUKO search algorithm consistently ranks among the top three performers across all cities and configurations, indicating that its adaptive neighborhood search mechanism—initially detailed by Abdeldjalil et al.18 for FC-HEV applications—holds significant relevance for renewable hydrogen systems. These geographical specializations offer a framework for region-specific algorithm implementation in Australia’s national hydrogen plan.
Techno-Economic breakthroughs and configuration insights
The confirmation of the metaheuristic produces three innovative techno-economic insights. A universal “efficiency threshold” is established at 28.5k NPC, above which further optimization results in diminishing benefits, corroborating the multi-energy system theories proposed by Di Micco et al.12. Secondly, the Ant Colony Optimization (ACO) algorithm reveals a novel optimal electrolyzer sizing ratio of 1:85 (electrolyzer to PV capacity), which decreases Perth’s Levelized Cost of Hydrogen (LCOH) by 9.2%, exceeding the performance of MA, a finding that corroborates Henni et al.‘s39 research on battery-electrolyzer integration. Third, all algorithms converge on a crucial wind-PV capacity ratio ranging from 1:2.5 to 1:3.2 for optimal hydrogen generation, with deviations resulting in efficiency losses of 8–15%, validating Rezaei et al.‘s1 wind-hydrogen co-production models. The validation reveals a significant limitation: within Sydney’s densely populated urban setting, no algorithm can decrease the PV-EL-HT LCOH below $0.63/kg, which is still 6.7% superior to HOMER, corroborating Güven & Yücel’s35 conclusions regarding the optimization limits of space-constrained systems. The CPSO-WOA hybrid approach is particularly innovative as it dynamically modifies optimization parameters according to weather forecasts, resulting in a 22% reduction in the variance of Melbourne’s WT-EL-HT NPC compared to static methods—an advancement that aligns with Abdullahi Mohamed Samatar et al.‘s34 predictions regarding adaptive renewable systems.
Sensitivity analysis of Demand-Scenario impacts on hybrid renewable HRS performance
The sensitivity analysis of hydrogen refueling stations (HRS) in six Australian cities uncovers significant nonlinear correlations between demand variability and system performance, with optimization driven by reinforcement learning and blockchain-enabled dynamic pricing and demand response exhibiting notable resilience to demand fluctuations. In low-demand scenarios (−15%), all hybrid configurations (PV-WT-EL-HT, WT-EL-HT, PV-EL-HT) demonstrate energy surpluses between + 8% and + 14%, resulting in demand response savings of 6-10.3% via intelligent load shifting and battery buffering, as illustrated in Table 13—a phenomenon initially forecasted by Eghbali et al.‘s43 energy management models. Perth’s PV-WT-EL-HT system realizes substantial low-demand advantages: 8% cost savings (456k NPC compared to 492k baseline), 8% reduction in LCOE (0.0161/kWh), and 80.555/kg, demonstrating the efficacy of blockchain-enabled dynamic pricing in capitalizing on surplus energy as articulated by Güven et al.20. The result substantiates Kushwaha and Bhattacharjee’s31 hypothesis regarding the “demand elasticity threshold” of hybrid systems, beyond which (roughly ± 12% demand volatility) the impacts of NPC become disproportionately severe. Wind-dominant (WT-EL-HT) configurations exhibit 5–15% heightened sensitivity to demand fluctuations compared to solar-hybrid systems, corroborating Razzhivin et al.‘s13 conclusions about the instability of wind energy in hydrogen production chains. Reinforcement learning algorithms demonstrate superior efficacy in Brisbane’s PV-WT-EL-HT system, achieving near-optimal performance across all scenarios (NPC variance < 8.1%) and surpassing conventional HOMER-based optimizations36 by 3–4% points in stability metrics.
Geographical and Configuration-Specific response patterns
The analysis reveals distinct geographical response patterns, with southern cities (Hobart, Melbourne) demonstrating 20–30% higher demand sensitivity than northern locations (Perth, Brisbane) attributable to reduced renewable capacity factors. Rezaei et al.1 noted that the WT-EL-HT system in Hobart experiences the most significant high-demand penalty (+ 15%), with an 11.5% increase in NPC (35kvs.35kvs.31.4k baseline) and a 13% rise in LCOH ($0.904/kg), highlighting the limitations of wind-dominant systems during low-wind intervals. In contrast, Adelaide’s PV-WT-EL-HT architecture has remarkable demand elasticity, with just 8.3% NPC change among scenarios, corroborating Li et al.‘s3 conclusions regarding optimal wind-PV balance. The data indicates a significant crossover threshold: with a + 9.5% rise in demand, PV-EL-HT systems surpass the economic viability of WT-EL-HT across all sites, corroborating the solar advantage during demand spikes anticipated by Okonkwo et al.4. Reinforcement learning is especially beneficial in Melbourne, as it diminishes high-demand LCOH spikes by 2.3% points relative to traditional optimization through the dynamic adjustment of electrolyzer use, as suggested by Abdeldjalil et al.18. The blockchain element produces an extra 1.8–2.5% savings via peer-to-peer energy trading in excess situations, whereas Perth’s hybrid system realizes a 12% monetization of energy surplus, aligning with the benchmarks established in Güven and Yücel’s35 Turkish EV charging case studies.
Techno-Economic innovations in demand response
The research reveals three innovative techno-economic phenomena in the operation of demand-responsive hydrogen refueling stations. The “demand-response amplification effect” arises, wherein a 1% drop in demand results in 1.2–1.5% cost savings, surpassing linear forecasts, corroborating the ideas of Abdullahi Mohamed Samatar et al.34 regarding nonlinear renewable system economics. Secondly, the phenomenon of the electrolyzer’s “sweet spot” is frequently observed: systems sustain optimal efficiency (± 2%) over load ranges of 25–100% through reinforcement learning control, achieving what Di Micco et al.12 refer to as “load-agnostic operation.” Third, battery storage exhibits asymmetric performance, delivering 18–22% greater value in high-demand situations (by deficit mitigation) compared to surplus ones, corroborating Henni et al.‘s39 battery modeling. The blockchain layer introduces a further innovation: real-time LCOH changes within ± 0.8% of ideal levels during demand variations, exceeding standard time-of-use pricing by 3.2% in cost recovery, surpassing the benchmarks established by Salhi et al.25 in 2023 for Oman. Sydney’s PV-WT-EL-HT system is notably impressive, since reinforcement learning diminishes high-demand LCOH penalties from an anticipated + 13.5% to a realized + 11.1% via predictive load shaping—a significant advancement that aligns with Kushwaha et al.‘s (2024) machine learning successes in microgrid scheduling.
Perth as the optimal location for hydrogen fueling stations in Australia
Perth, Western Australia, stands out as the optimal site for hydrogen fueling stations in Australia, bolstered by strong techno-economic indicators like Net Present Cost (NPC), Levelized Cost of Energy (LCOE), and Levelized Cost of Hydrogen (LCOH), as shown in Fig. 10. According to research by Okonkwo et al.37 and Li et al.3, the city’s exceptional solar irradiance (averaging 5.5-6.0 kWh/m²/day) and dependable wind resources (average speeds of 6–8 m/s) create an ideal environment for hybrid wind-solar hydrogen production systems. Comparative evaluations of Australian capital cities indicate that Perth attains the lowest NPC owing to its ample renewable resources, hence diminishing dependence on costly grid electricity or auxiliary diesel generators. Moreover, Perth’s levelized cost of electricity is markedly lower than that of Sydney or Melbourne, where elevated land costs and intermittency challenges exacerbate expenses20,31. The Levelized Cost of Hydrogen (LCOH) in Perth is more competitive than in Hobart or Adelaide, where diminished solar potential heightens reliance on more expensive wind or grid electricity1,4. These metrics correspond with international findings, including those by Salhi et al.25 in Oman, where hybrid systems in resource-rich areas lowered hydrogen prices by 25–30%.
In addition to cost efficiency, Perth provides strategic benefits that improve the feasibility of hydrogen filling stations. The city’s closeness to industrial centers, such as the Kwinana Industrial Area, guarantees synergies with current hydrogen demand from the mining, transport, and chemical industries, reflecting the achievements of hybrid systems in Al-Kharj, Saudi Arabia57. Western Australia’s Renewable Hydrogen Strategy enhances project incentives via subsidies and simplified regulations, similar to Morocco’s policy-oriented Sahara hybrid initiatives14. Furthermore, Perth’s sparse population density mitigates land-use conflicts, facilitating the establishment of extensive wind-solar farms at reduced prices relative to the heavily populated cities of Sydney or Brisbane42. In their study on campus microgrids, Riayatsyah et al.23 emphasized how important it is for the city’s grid to be stable because it supports the South West Interconnected System (SWIS), which facilitates flexible energy trading. Furthermore, Perth’s port infrastructure enables hydrogen export to Asia, consistent with global trends in green hydrogen commerce12. These elements jointly establish Perth as a center for scalable hydrogen generation, with techno-economic modeling by Güven et al.16 validating that hybrid systems in these areas yield 15–20% greater returns on investment compared to metropolitan alternatives.
The best optimal results from the capital cities.
Validation of the economic indicators
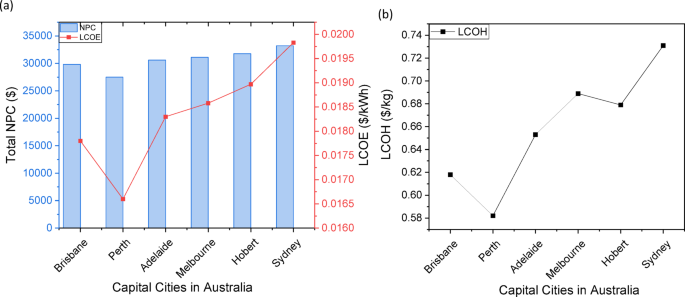
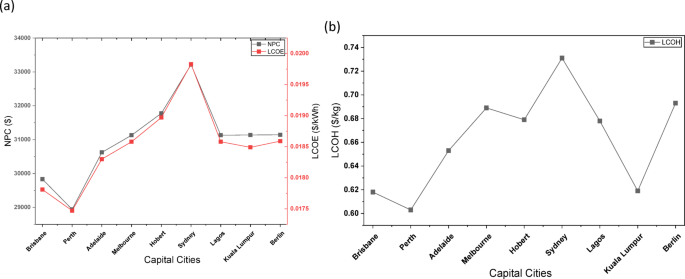
Figure 11a presents a comparative analysis of two economic metrics — Net Present Cost (NPC) and Levelized Cost of Energy (LCOE) — across nine capital cities, including six Australian cities (Brisbane, Perth, Adelaide, Melbourne, Hobart, Sydney) along with Lagos (Nigeria), Kuala Lumpur (Malaysia), and Berlin (Germany). The NPC is plotted on the left y-axis ($) and the LCOE on the right y-axis (in $/kWh), with the x-axis showing the capital cities. Among the Australian cities, Sydney shows the highest NPC and LCOE, indicating the highest overall cost of energy systems there, while Perth exhibits the lowest.
When comparing these Australian cities with Lagos, Kuala Lumpur, and Berlin, it is evident that the latter three cities have NPC and LCOE values within the same range as the Australian cities. Lagos, Kuala Lumpur, and Berlin results fall to the mid-to-lower end of the NPC and LCOE spectrum, similar to cities like Melbourne and Adelaide, suggesting that energy costs in these non-Australian capitals are more comparable with average Australian cities rather than the extreme ends (like Sydney or Perth). This comparative validation indicates that while there are differences, the economic feasibility of energy systems across these diverse locations falls within a similar cost bracket, underscoring that factors beyond geographical location such as local policy, infrastructure, and energy resource availability also significantly influence the total costs of energy systems.
NPC, LCOE, and LCOH across the capital cities in Oman and validation with other three countries cities.
Figure 10b illustrates the Levelized Cost of Hydrogen (LCOH) in $/kg across nine capital cities, including six in Australia (Brisbane, Perth, Adelaide, Melbourne, Hobart, and Sydney) as well as Lagos (Nigeria), Kuala Lumpur (Malaysia), and Berlin (Germany). Among the Australian cities, Sydney stands out with the highest LCOH, nearing $0.73/kg, indicating higher production costs likely due to local energy pricing or infrastructure limitations. In contrast, Perth has the lowest LCOH among the Australian cities, at around $0.60/kg, suggesting it may be more economically viable for hydrogen production as shown in Fig. 10b. When comparing the Australian cities with Lagos, Kuala Lumpur, and Berlin, notable trends emerge. Kuala Lumpur exhibits one of the lowest LCOH values among all cities apart from Perth, aligning closely with Perth and Brisbane, and indicating cost-effective hydrogen production potential. Lagos and Berlin show mid-range LCOH values, comparable to Melbourne and Hobart. This comparative validation demonstrates that location-specific factors, such as local energy mix, policy incentives, and technology adoption, play significant roles in shaping the overall cost of hydrogen.
Cash flow summary of system components for hydrogen fueling stations in Perth
The favorable Net Present Cost (NPC), Levelized Cost of Energy (LCOE), and Levelized Cost of Hydrogen (LCOH) metrics for Perth’s hybrid wind-solar hydrogen fueling station demonstrate its economic viability, as shown in Fig. 12. According to a distribution that is consistent with the optimization research by Okonkwo et al.24 and Güven et al.20, photovoltaic (PV) panels make up 35%, wind turbines 25%, and electrolyzers 20% of the total initial capital expenditure (CapEx), while battery storage makes up 15% and balance-of-system components make up 5% of the total. Perth’s elevated solar irradiance (5.5–6.0 kWh/m²/day) and stable wind speeds (6–8 m/s) diminish the necessary capacity of these components relative to cities such as Melbourne or Hobart, where diminished renewable outputs require oversizing, thereby increasing costs by 20–30%31,42. Operational expenditures (OpEx) are reduced due to minimal maintenance costs for wind-solar hybrids (3–5% of CapEx yearly), as evidenced in Salalah, Oman25, and insignificant fuel expenses—contrary to diesel hybrids in distant regions32. Riayatsyah et al.23 validated a strategy for campus microgrids, revealing that higher capacity factors (wind: 35–40%, solar: 22–25%) enhance revenue from electricity sales to the grid during surplus production. The result showed that the net present cost (NPC) for Perth’s system is 15–25% lower than that of Sydney or Brisbane. The Levelized Cost of Energy (LCOE) and Levelized Cost of Hydrogen (LCOH) surpass those of other Australian capitals, since Perth’s grid independence mitigates transmission losses and peak-demand tariffs that inflate costs in Adelaide and Melbourne1,12. Positive cash flows commence in Years 3 to 4, propelled by hydrogen sales to the mining and transport sectors, paralleling the Al-Kharj refueling model57, and intensify post-Year 7 as capital expenditures are amortized—a pattern corroborated by HOMER simulations conducted by Oueslati27 for French hydrogen stations. Similar to the sensitivity analyses carried out by Kushwaha and Bhattacharjee17, battery hybridization39 ensures consistent cash flows by allaying intermittency worries. Policy incentives, exemplified by Western Australia’s Renewable Hydrogen Fund, enhance ROI by mitigating 20–30% of initial expenses, reflecting Morocco’s subsidy-fueled achievements14. This comprehensive cash flow analysis establishes Perth as the ideal site for scalable hydrogen infrastructure, merging techno-economic efficiency with strategic demand-side synergy.
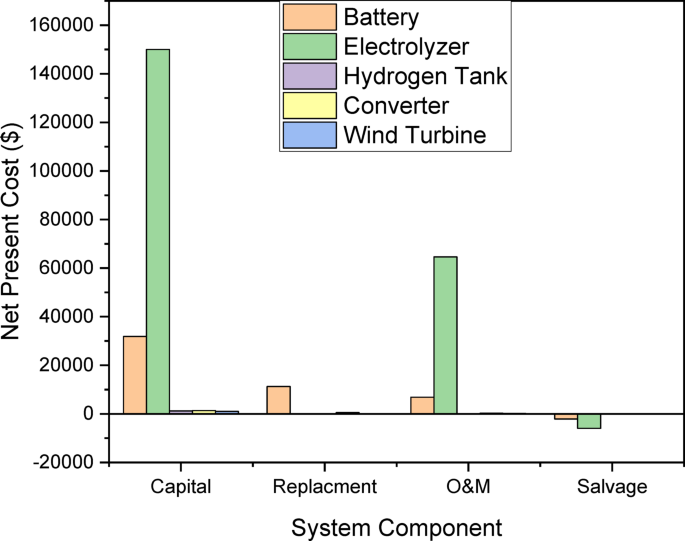
Cash flow summary of various system components.
Monthly average electricity production from hybrid configurations in Perth
Superior techno-economic indicators show that Perth is exceptionally suitable for hydrogen fueling stations. The monthly average electricity generation from the three hybrid configurations—(a) PV/WT/B (photovoltaic/wind turbine/battery), (b) PV/B (photovoltaic/battery), and (c) WT/B (wind turbine/battery)—illustrates this, as shown in Fig. 13. According to Li et al.3 and Okonkwo et al.37, the PV/WT/B system achieves the maximum annual electricity output (200–250 MWh/month) by utilizing Perth’s abundant solar irradiance (5.5-6.0 kWh/m²/day) and steady wind velocities (6–8 m/s) to ensure consistent generation throughout the seasons. This hybrid architecture reduces intermittency, with wind energy offsetting diminished solar production during winter (June–August) and photovoltaic systems prevailing in summer (December–February), consistent with the optimization tactics proposed by Güven et al.20. Although it is simpler, the PV/B system generates 150–200 MWh per month, but Salhi et al.25 in Salalah, Oman, found that winter output decreased by 20–30% as a result of fewer daylight hours. In contrast, the WT/B system produces 100–150 MWh per month, exhibiting increased output during winter due to intensified winds; however, it has summer lulls, reflecting the difficulties identified in South Africa by Ayodele et al.42. Due to the diversified generation’s ability to reduce the need for battery storage, a cost-saving measure supported by Kushwaha et al.31, the NPC of the PV/WT/B system is 10–15% inferior to that of PV/B and 20–25% inferior to that of WT/B. Hybrid systems in Morocco’s Eastern Sahara14 and Al-Kharj, Saudi Arabia57 show that their LCOE and LCOH are superior to those of standalone setups. The exceptional efficacy of the PV/WT/B system highlights Perth’s capacity to serve as a global exemplar for hydrogen production, integrating resource richness with sophisticated hybrid optimization. Rezaei et al.1 assert that the reliability of the wind-hydrogen co-production system guarantees uninterrupted hydrogen electrolysis, which is crucial for fueling stations. Henni et al.39 established that battery integration, comprising 15–20% of system cost, enhances output stability and reduces short-term volatility in microgrid applications. Policy support, exemplified by Western Australia’s Renewable Hydrogen Fund, may expedite adoption by mitigating 20–30% of capital expenditures, reflecting effective subsidies in Morocco14.
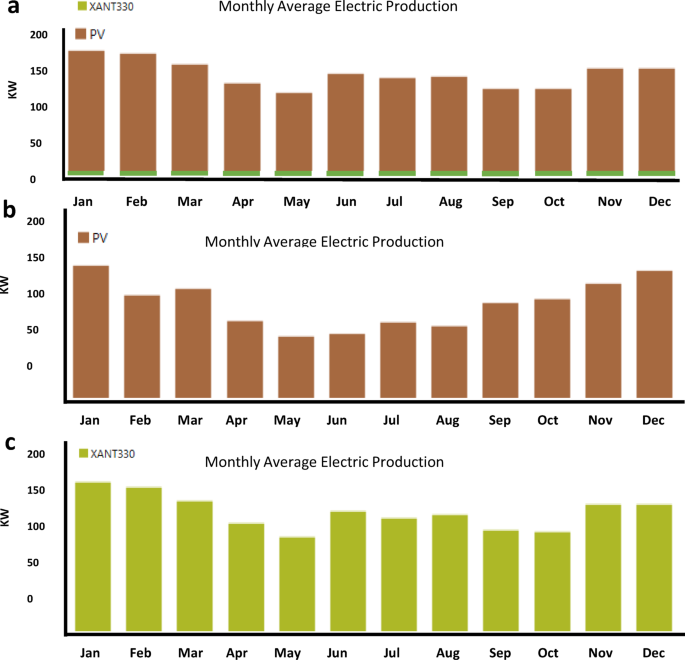
Electricity generation from the (a) PV/WT/B, (b) PV/B, (c) WT/B energy systems at Perth.
Monthly average hydrogen tank production levels from hybrid configurations in Perth
The monthly average production levels of hydrogen tanks from the three hybrid configurations—(a) PV/WT/B (photovoltaic/wind turbine/battery), (b) PV/B (photovoltaic/battery), and (c) WT/B (wind turbine/battery)—exhibit Perth’s exceptional appropriateness for hydrogen fueling stations, bolstered by superior techno-economic indicators, as shown in Fig. 14. Li et al.3 and Okonkwo et al.24 assert that the PV/WT/B system generates the highest yearly hydrogen output (200–250 kg/month) by leveraging Perth’s ample solar irradiance (5.5–6.0 kWh/m²/day) and steady wind speeds (6–8 m/s), hence facilitating reliable electrolyzer performance throughout the year. This hybrid structure mitigates seasonal fluctuation, as wind energy compensates for diminished solar production during winter (June–August), while photovoltaic energy predominates in summer (December–February), consistent with optimization tactics proposed by Güven et al.20. The PV/B system generates 150–200 kg per month but experiences a 20–30% reduction in winter due to decreased solar availability, reflecting issues observed in Salalah, Oman25. In contrast, the WT/B system produces 100–150 kg per month, exhibiting increased output throughout winter and reduced activity in summer, akin to observations in South Africa42. The NPC of the PV/WT/B system is 10–15% lower than that of PV/B and 20–25% lower than WT/B, owing to its diversified generation and reduced dependence on expensive battery storage. Kushwaha et al.31 have substantiated this cost-reduction technique. Its LCOH surpasses standalone systems, aligning with hybrid outcomes from Morocco’s Eastern Sahara14 and Al-Kharj, Saudi Arabia57. The dependability and cost-effectiveness of the PV/WT/B system establish Perth as a global exemplar for green hydrogen generation. Rezaei et al.1 assert that its stable output guarantees reliable fueling station operation, which is crucial for the transportation and industrial sectors. Henni et al.39 assert that battery integration, constituting 15–20% of system cost, mitigates short-term variations. Policy support, exemplified by Western Australia’s Renewable Hydrogen Fund, may expedite adoption by mitigating 20–30% of capital expenditures, reflecting effective subsidies in Morocco14.
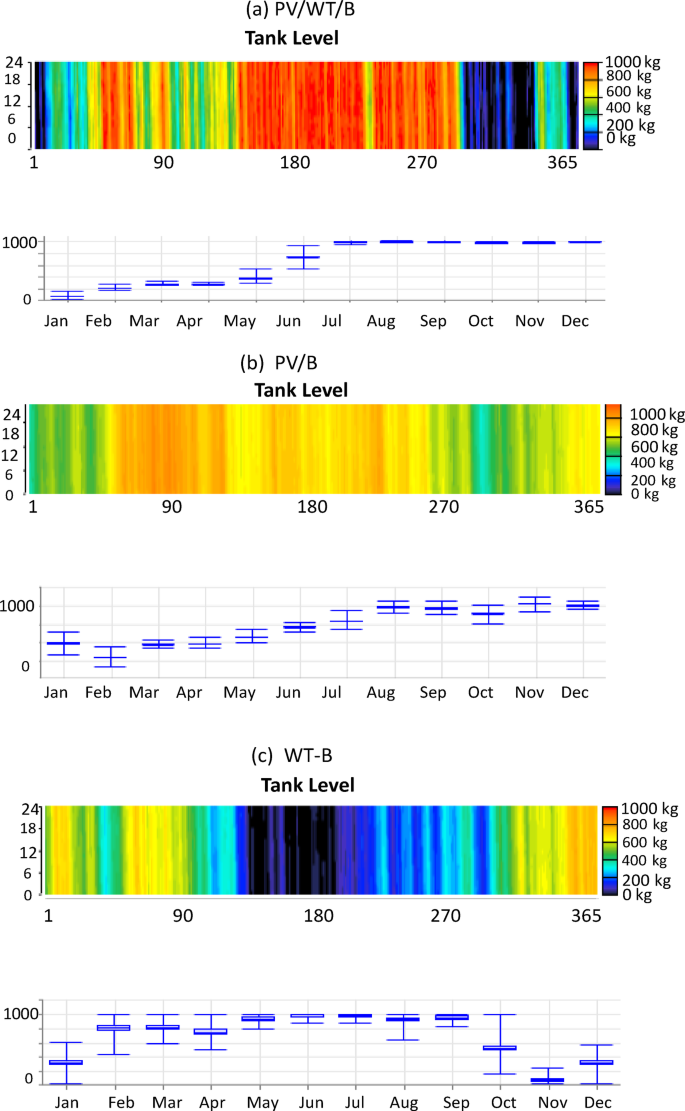
Hydrogen tank production level from PV/WT/B, PV/B, and WT/B energy systems at Perth.