Data source
This study utilized a novel longitudinal dataset constructed by merging two consecutive cross-sectional cycles (2011–2012 and 2013–2014) from the NHANES, following the methodology established by Wang et al. [18]. NHANES, conducted by the National Center for Health Statistics (NCHS) of the Centers for Disease Control and Prevention (CDC), employs a sophisticated multistage, stratified probability sampling design to ensure nationally representative estimates [19]. Using the data integration approach described by Xing W et al. [20], we created a comprehensive analytical dataset by merging all study variables through unique participant identifiers (SEQN). The final dataset incorporated six key domains: (1) demographic characteristics, (2) lifestyle factors, (3) anthropometric measurements, (4) laboratory biomarkers, (5) questionnaire-derived health indicators, and (6) dietary assessment data, providing multidimensional covariates for data analysis.
Ethics statement
The NHANES protocols were approved by the NCHS Ethics Review Board (Protocol #2011-17), with written informed consent obtained from all participants prior to data collection. In strict accordance with NHANES Data Use Guidelines, our analysis adhered to the following ethical standards: (1) all protected health information was de-identified prior to analytical use, (2) data were accessed solely for the purposes of this specified research, and (3) no attempts were made to re-identify participants at any stage of analysis. This secondary data analysis was determined to be exempt from additional institutional review board evaluation as it involved only anonymized, publicly available datasets.
Study population and design
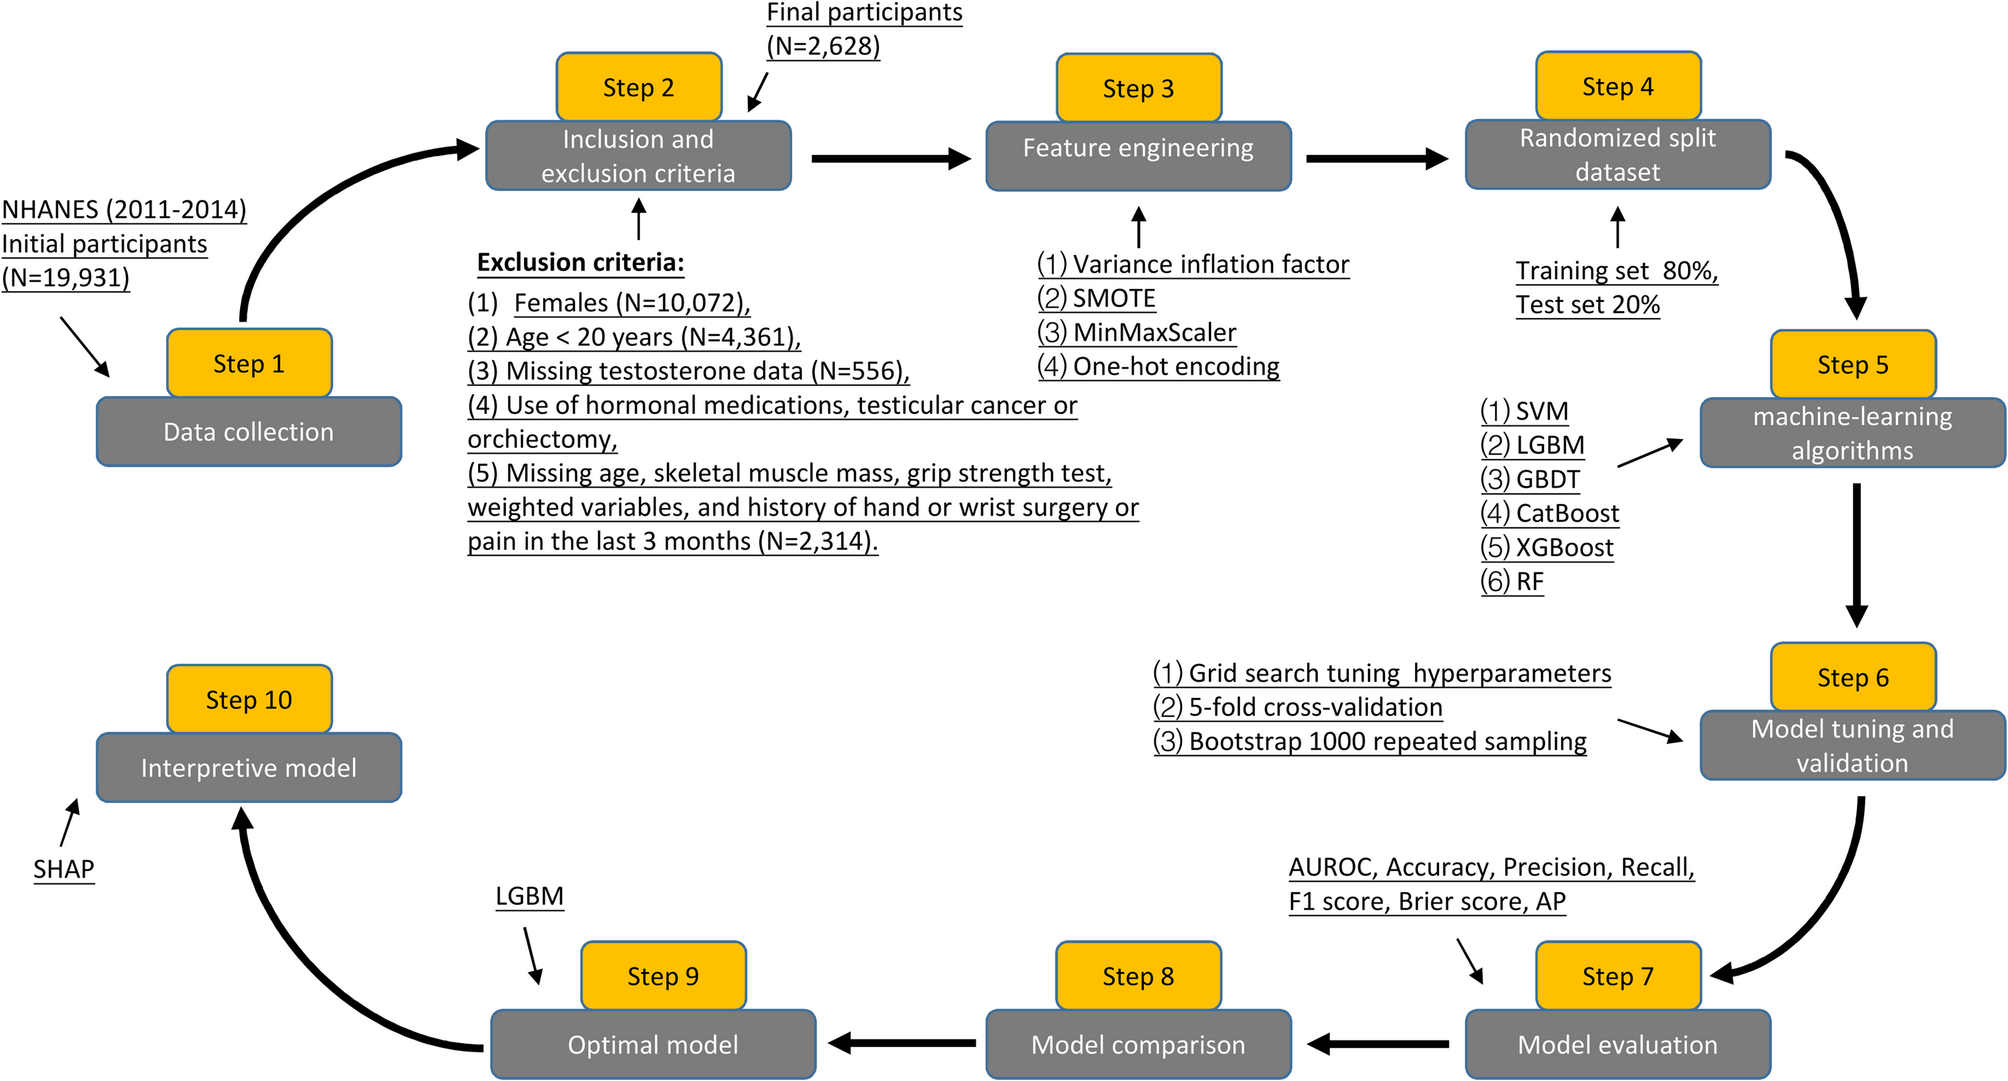
The present analysis utilized NHANES 2011–2014 cycles as these were the only available survey years containing complete data on standardized grip strength measurements, a critical component for calculating the MQI. From the initial cohort of 19,931 participants, we applied stringent selection criteria to derive our analytical sample. Our final analytical cohort comprised 2,628 eligible male participants (13.2% of initial sample). This selection process ensured standardized assessment conditions while minimizing potential confounding from circadian testosterone variation or musculoskeletal limitations. Based on previous studies [21, 22], in order to maximize the integrity of the dataset, participants under the age of 20 were excluded from the dataset because many laboratory indicators for this age group were not collected in the NHANES dataset. Skeletal muscle mass was measured with the use of dual-energy X-ray absorptiometry (DXA) scans. To ensure measurement accuracy, grip strength was measured in both hands, and the grip strength of each hand was measured three times with a 60-second interval. The inclusion criteria were as follows: (1) male; (2) the age ≥ 20 years; (3) completed serum total testosterone test; (4) complete skeletal muscle mass measurements in the extremities and grip strength tests in both hands; and (5) obtain informed consent. Exclusion criteria were (1) female; (2) the age < 20 years; (3) missing total testosterone data; (4) use of hormonal medications, history of testicular cancer or orchiectomy, and collection of blood samples in the afternoon or evening; (5) history of hand or wrist surgery or pain in the last 3 months; and (6) missing data on skeletal muscle mass, grip strength test, age, and weighted variables.
Feature selection and definition of the label
Based on prior studies [6, 7, 23] and expert consensus (obtained from four independent specialists in sports medicine and andrology at the Second Affiliated Hospital of Wenzhou Medical University), we initially considered 29 candidate variables (see Additional file 1) encompassing demographic characteristics, laboratory analyses, lifestyle factors, anthropometric measurements, and medical history. To ensure data quality, we excluded variables with missing values exceeding 15%, including low-density lipoprotein (LDL), homeostasis model assessment of insulin resistance (HOMA-IR), insulin, triglyceride (TG), triglyceride glucose (TyG) index, TyG-body mass index (BMI) index, visceral adiposity index (VAI), and lipid accumulation product (LAP). To mitigate multicollinearity and enhance model generalizability, we performed dimensionality reduction using variance inflation factor (VIF) analysis, retaining only variables with VIF < 5. Consequently, waist circumference (WC) and neutrophil-lymphocyte ratio (NLR) were excluded due to high collinearity. In accordance with the American Urological Association guidelines [24], TD was defined as a serum total testosterone level below 300 ng/dL, which served as the binary classification label. Following feature selection, the final dataset comprised 1 label (TD) and 18 features (9 categorical and 9 continuous), which were subsequently used for model training and evaluation.
Calculation of features
To identify optimal biomarkers for predicting TD in males, we evaluated several indices related to insulin resistance (IR) and obesity. HOMA-IR: calculated as fasting glucose (mmol/L) × fasting insulin (µU/mL)/22.5, as proposed by Son DH et al. [25]. TyG index: computed using the formula: ln [TG (mg/dL) × fasting glucose (mg/dL)/2], based on the method by Yang Z et al. [26], who demonstrated its superiority over HOMA-IR in assessing IR. TyG-BMI index: derived as the product of the TyG index and BMI, serving as a composite marker of obesity-related IR [27]. VAI: for males, VAI was calculated as: VAI = WC (cm)/[39.68+(1.88× BMI)]× [TG (mmol/L)/1.03] × [1.31/high-density lipoprotein (HDL) (mmol/L)], following the methodology of Cheng S et al. [28]. LAP: determined using the sex-specific formula for males: LAP = [WC (cm) − 65] × TG (mmol/L), as described by Ebrahimi M et al. [29]. The systemic immune-inflammatory index (SII): computed as platelet count × neutrophil count/lymphocyte count, in accordance with Di X et al. [30].
Based on Di X’s method, the SII was calculated as platelet count × neutrophil count/lymphocyte count. The MQI: defined as the handgrip strength divided by the sum of the lean body mass of the arms and legs, following the approach of Weng L et al. [7].
Handling of missing values
Missing data are a common limitation in the NHANES dataset. Complete case analysis through direct deletion of missing values may lead to both inefficient utilization of valuable healthcare data and potential selection bias. To preserve data integrity while maximizing the retention of clinically relevant information, we implemented an advanced imputation approach for variables containing < 15% missing values. Specifically, we employed the missForest R package (version 1.5), which utilizes a random forest-based algorithm (hyperparameters: ntree = 1000, maxiter = 10, verbose = TRUE) to handle missing data [31]. This machine learning method was selected for its ability to: (1) accommodate complex variable relationships, (2) preserve the original data distribution, and (3) provide robust imputations for both continuous and categorical variables.
Predictive modeling strategy
To evaluate the performance and generalization ability of the models on unseen data, we randomly split the dataset into an 80:20 ratio, with 80% (N = 2,102) allocated for training and 20% (N = 526) reserved as the test set. The training set was used for model development, while hyperparameter tuning was performed via grid search on the test set to enhance generalization performance [32]. To further ensure robust estimation of model performance, we employed 5-fold cross-validation for each hyperparameter combination, selecting the optimal configuration based on aggregated evaluation metrics [33]. In medical studies, class imbalance is a common challenge due to the low prevalence of certain diseases. When trained on imbalanced data, machine learning models tend to exhibit bias toward the majority class, leading to inflated accuracy metrics that fail to reflect true predictive performance for underrepresented classes [34]. In our dataset, the prevalence of TD (the target label) was only 25.76%, indicating significant class imbalance. To mitigate this issue, we applied the Synthetic Minority Oversampling Technique (SMOTE), which generates synthetic samples for the minority class by interpolating between neighboring instances in feature space. This approach effectively balances class distribution while preserving the intrinsic structure of the original data. However, SMOTE may inadvertently alter data distribution or introduce overfitting, particularly if synthetic samples amplify noise or outliers. To assess the fidelity of the SMOTE-processed dataset, we computed the Jaccard distance (JD) between the original and resampled data. A JD of zero confirmed that the synthetic samples did not distort the underlying data distribution [35]. Additionally, we addressed feature scaling by normalizing continuous variables using MinMaxScaler, ensuring uniform magnitude across features [36]. Categorical variables were converted into a machine-readable format via one-hot encoding, facilitating their integration into the classification model [37].
Given the distinct performance characteristics of different ML algorithms, we employed six widely used classification models to predict male TD associated with MQI: Support Vector Machine (SVM), Light Gradient Boosting Machine (LGBM), Gradient Boosting Decision Tree (GBDT), Categorical Boosting (CatBoost), Extreme Gradient Boosting (XGBoost), and Random Forest (RF). To objectively determine the optimal model, we compared their predictive performance using the area under the receiver operating characteristic curve (AUC), a robust metric for evaluating classification performance, particularly in imbalanced datasets. Among the tested models, LGBM demonstrated the highest AUC, establishing it as the most effective predictor for male TD. To enhance interpretability and provide clinically meaningful insights into the model’s decision-making process, we applied the SHAP, which quantifies feature importance and reveals non-linear relationships within the model.
SHAP interpretability analysis
To enhance model interpretability of our optimal model, we employed SHAP values, a unified approach rooted in cooperative game theory that provides mathematically rigorous feature attribution [38]. Unlike conventional variable importance metrics that merely rank features by their relative importance, SHAP values offer three critical advantages: (1) they quantify the exact magnitude of each feature’s contribution to individual predictions, (2) they determine the directionality of these contributions (positive or negative impact on testosterone deficiency prediction), and (3) they maintain consistency with the original model’s output through their additive property [39]. This approach enables clinically meaningful interpretation of how specific features influence the model’s decision-making process regarding TD classification.
Statistical analysis
All statistical analyses of the data in this study were performed using R version 4.3.1 (https://www.r-project.org) and Python version 3.11.5 (https://www.python.org). Since NHANES uses a complex sample survey design, we used a weighted sample for our analysis. Continuous variables are expressed as median (P25, P75), and categorical variables are expressed as counts (percentages). We grouped participants according to the TD or no-TD. We used the Wilcoxon rank sum test for complex sampling to compare differences between the two groups for continuous variables and the Rao & Scott second-order corrected chi-square test for categorical variables. Multivariate logistic regression, trend test, and subgroup analysis were used to analyze the relationship between MQI and TD. We evaluate the performance of each ML model using the AUC, accuracy, precision, recall, F1 score, Brier score, and the area under the precision-recall (P-R) curve (AP). The R packages we used include haven, tableone, gtsummary, survey, dplyr, plyr, tidyverse, caret, arsenal, glmnet, ggplot2, and missForest. The Python libraries we used were Scikit-learn 1.2.2 and imblearn library version 0.10.1. The difference was considered statistically significant at two-sided P < 0.05.