Phage isolation and purification
This study utilized 19 strains of Enterococcus from the Key Laboratory of Animal Disease Pathogen Diagnosis and Green Prevention and Control Technology in Qinghai Province as host bacteria. Wastewater samples were collected from various yak farms in Xining city for phage isolation. The phage isolation methods used were previously described by Liu et al. [13], and the phage isolation and purification process was as follows:
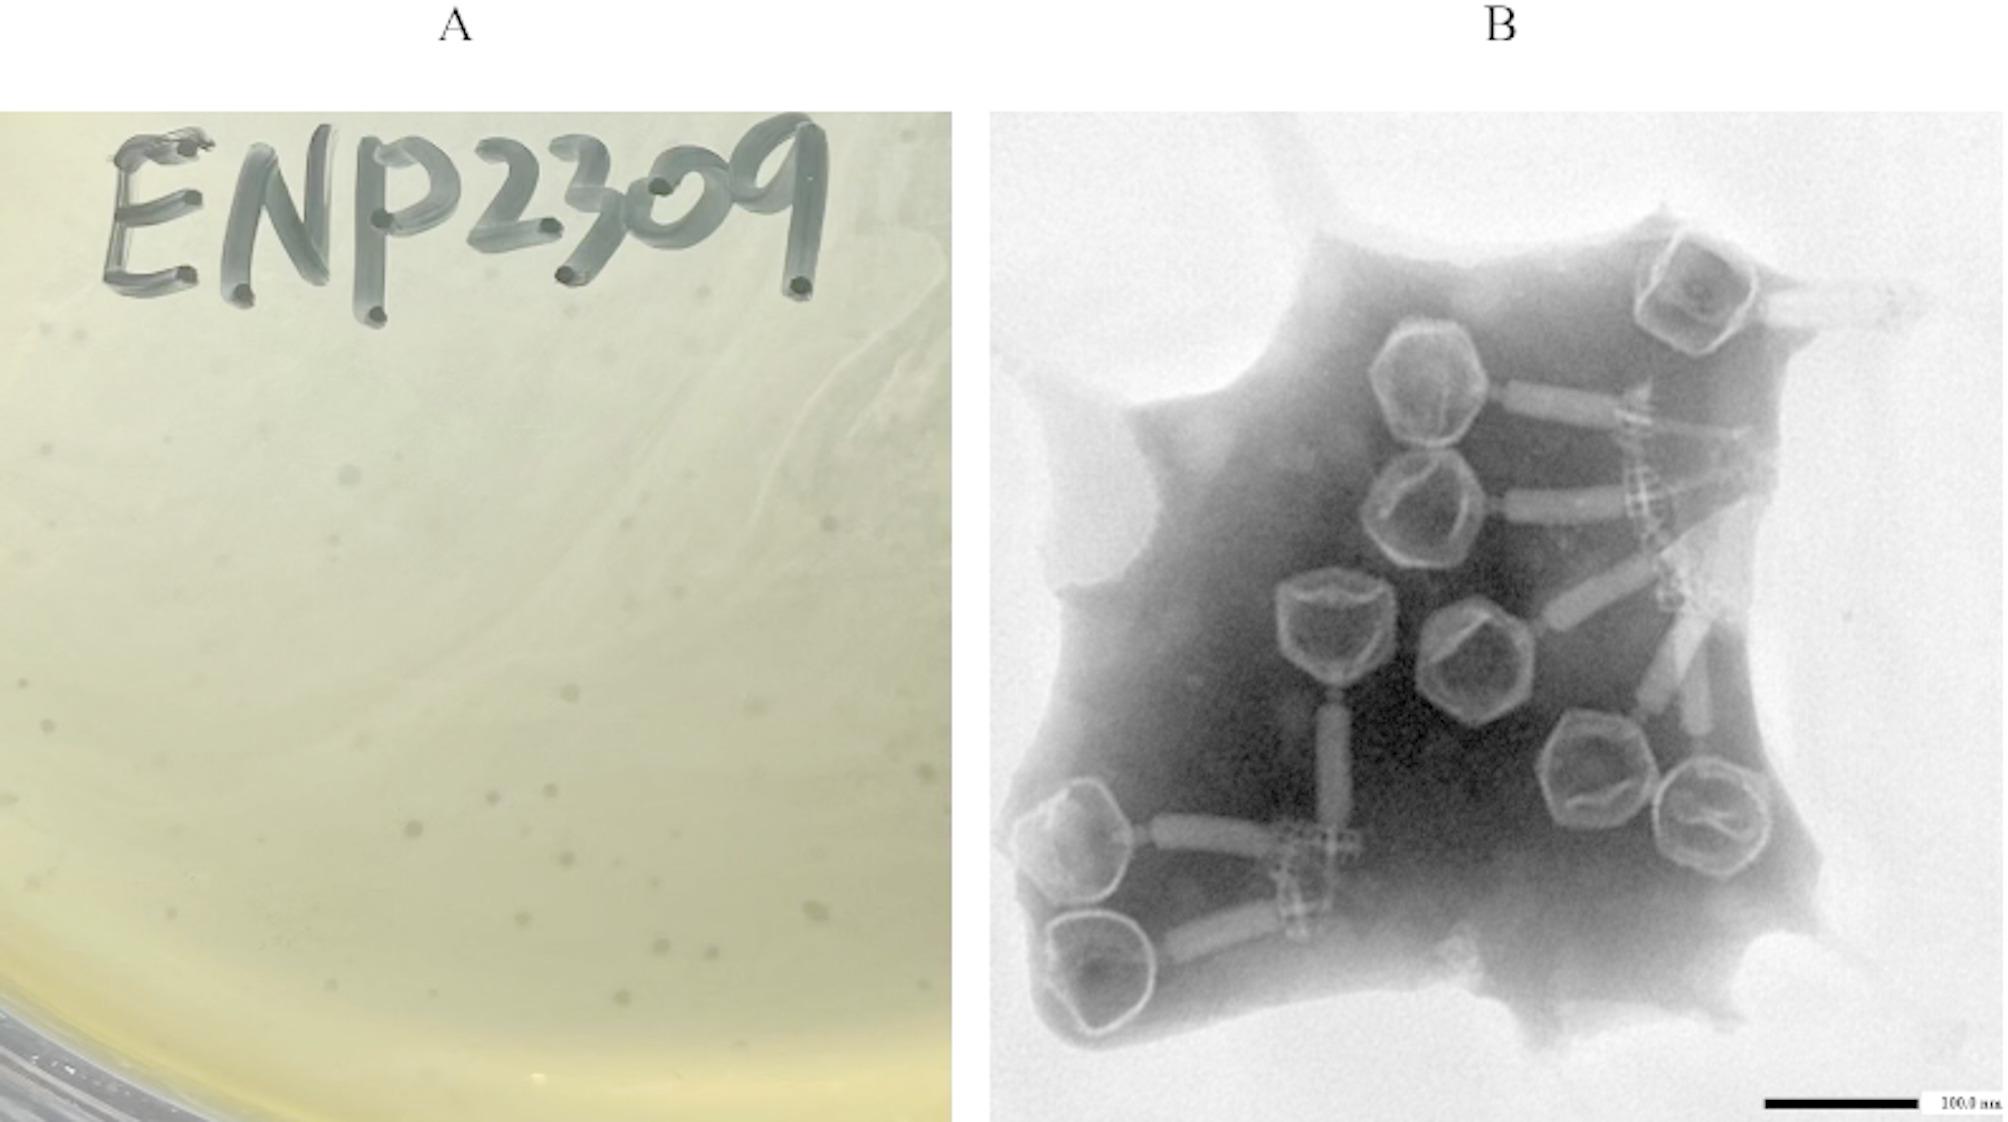
First, wastewater samples were sterilized by filtration through a 0.22 μm membrane filter (Millipore). The filtrate was then mixed with the host bacteria at a 1:1 ratio (v/v). The mixture was then plated using the double-layer agar method (the bottom layer was 1.5% agar-solidified Todd-Hewitt broth, and the top layer was THB medium containing 0.5% agar). After incubation at 37 ℃ overnight, the formation and morphology of phage plaques were observed. A single phage plaque was subsequently aseptically picked and suspended in sterile PBS at room temperature for 4 h to allow phage dissociation. This suspension was then mixed again with the host bacteria and replated using the double-layer agar method. After overnight incubation at 37 °C, single plaques were isolated. This purification process was repeated three times to ultimately obtain purified phage isolates.
Host range
Suspensions of distinct Enterococcus strains were spread onto double-layer agar plates and preincubated at 37 °C for 2 h to form bacterial lawns. Subsequently, 5 µL aliquots of phage solution were spotted onto the solidified agar surface. Following overnight incubation at 37 °C, lytic activity was evaluated by counting the infection classes (+ 4, + 3, +2, + 1, and 0) within the bacterial lawns (Table 1). The methods described by Fayez et al. [14] were subsequently followed, Enterococcus faecalis GZ25 was used as the indicator bacterium, the efficiency of plating (EOP) was calculated. The EOP is defined as the ratio of the lysis titre of the phage against different test strains to that against the indicator bacterium.
Morphological observation
The phage particles were sequentially concentrated using PEG 8000 (Sigma‒Aldrich) precipitation followed by CsCl density gradient centrifugation according to established protocols [15]. The purified phage suspension was adsorbed onto 400-mesh carbon-coated copper grids (Ted Pella, USA) and stained with 1% (w/v) phosphotungstic acid (SolarBio, Beijing, China) for 10 min at room temperature. The grids were air-dried and subsequently imaged using an HT7700 transmission electron microscope (Hitachi, Japan) at 80 kV.
Temperature stability
Phage ENP2309 suspensions were subjected to thermal stability testing through 1-hour incubation at incremental temperatures ranging from 10 °C to 80 °C (10 °C intervals). Following thermal treatment, residual phage viability was quantified via the double-layer agar method. All experimental conditions were evaluated through triplicate independent biological replicates.
pH stability
The pH of the SM buffer was adjusted to values ranging from 2 to 13 using concentrated hydrochloric acid or sodium hydroxide solution. A total of 100 µL of phage mixture was added to 900 µL of SM buffer at various pH values and allowed to stand at 37 °C for 1 h. The phage titres were determined using the double-layer method. All experimental conditions were evaluated through triplicate independent biological replicates.
Optimal multiplicity of infection
Serial dilutions of phage ENP2309 were combined with host bacterial cultures (OD600 = 0.6) under conditions of varying multiplicity of infection (MOI = 10− 5, 10− 4, 10− 3, 10− 2, 10− 1, 1, 10, 102, 103, 104, and 105). After 10 min adsorption at 37 °C, the unbound phages were removed by centrifugation (8,000 r/min, 10 min, 4°C). The bacterial pellets were resuspended in 10 mL of fresh THB broth and incubated at 37 °C, and 200 r/min for 4 h. Phage progeny production was quantified through the double-layer agar method, The experiment was performed in triplicate.
One step growth
In accordance with on the methods of Zurabov et al. [16], with adjustments made for this study, the following protocol was used: host bacterial cultures (OD600 = 0.6) were infected with phage ENP2309 at an MOI of 0.001. A mixture of 100 µL of phage suspension and 100 µL of host bacterial culture was incubated at 37 °C for 10 min. The mixture was then centrifuged (8,000 r/min, 5 min, 4 °C). The resulting pellet was collected and resuspended in 50 mL of THB broth. The mixture was incubated in a shaking incubator (37 °C, 200 rpm/min). Every 20 min, a 2 mL aliquot of the suspension was collected, and the phage suspension was obtained by filtration through a 0.22 μm filter. Phage titres were determined using the double-layer agar plate method, and monitored continuously for 6 h. The latent period was defined as the time required for phage adsorption to the host cell and subsequent release of progeny phages. The burst size of the phage was expressed as the ratio of the final count of phage particles released during the outburst to the number of infected bacterial cells. Burst size = (Peak phage titer) / (Total number of infected bacteria in the system). The experiment was performed in triplicate.
Phage genome extraction and sequencing
The phage genome was extracted using a bacteriophage DNA isolation kit (Norgen Biotek, Canada) following the manufacturer’s protocol. The purified DNA was quantified using a Nano Drop One (Thermo Fisher Scientific) and assessed for quality by agarose gel electrophoresis (1% w/v). Sequencing libraries were prepared using the Illumina TruSeq Nano DNA LT Library Prep Kit (Illumina, San Diego, CA) according to the manufacturer’s instructions (Illumina TruSeq DNA Sample Preparation Guide, Rev. E) at Shanghai Paisenno Bio-Tech Co., Ltd. Raw sequencing reads were quality-filtered using Trimmomatic (v0.39) and assembled de novo using SPAdes (v3.12.0) with default parameters. Contigs were screened on the basis of sequencing depth (> 50× coverage), and high-depth sequences were subjected to BLASTn analysis against the NCBI NT database [17] for phage genome identification. The final complete genome sequence was validated through manual curation and comparison with reference phage genomes in the NCBI database.
Phage genome analysis
The online BLASTp server was used to identify open reading frames (ORFs). The online tools ResFinder (http://genepi.food.dtu.dk/resfinder) and VirulenceFinder (https://cge.cbs.dtu.dk/services/) were used to screen for antibiotic resistance genes and virulence genes in the phage genome. tRNAs were predicted using tRNA scan SE (http://lowelab.ucsc.edu/tRNAscan-SE/index.html). A phage genome map was generated using SnapGene 6.0.2. To analyse the phylogenetic relationships of the phage, the genome sequence was used for a BLASTn search of the NCBI database. A phylogenetic tree based on the large terminase subunits of related phages was constructed by the neighbour‒joining method in MEGA 7.0 [18]. Phage genomes were compared using VIRIDIC [19] to determine their genetic relatedness (≥ 70% nucleotide sequence identity implies a genus-level relationship, whereas ≥ 95% identity suggests a species-level relationship).
Evaluation of phage therapeutic effects
Female BALB/C mice (16–18 g, purchased from the Lanzhou Institute of Animal Husbandry and Veterinary Medicine) were randomly allocated into four experimental groups (n = 10 per group): (a) Challenge group: Mice were intraperitoneally challenged with E. faecalis GZ16185 at the minimum lethal dose (3.0 × 10¹¹ CFU/mL). (b) Treatment group: 200 µL of phage ENP2309 (2.0 × 10⁸ PFU/mL) was administered via intraperitoneal injection 15 min post-infection. (c) Phage group: This group received 200 µL of phage ENP2309 alone (2.0 × 10⁸ PFU/mL) intraperitoneally. (d) PBS group: Injected intraperitoneally with 200 µL of PBS buffer.
The experimental cycle spanned 14 days. Throughout the study, daily body weight, survival rates, and general health status were recorded for all groups.
In addition to the mice in the challenge group (Day 3), the mice in the other groups were assessed at the endpoint (Day 14). The mice were euthanized, and the organs (e.g., liver, and spleen) were harvested for histopathological evaluation. Tissue sections were prepared and stained with haematoxylin-eosin (HE) to assess pathological changes. The bacterial loads in the spleen and liver were quantified using the plate counting method.
Blood samples were collected via retro-orbital bleeding on Days1, 3, 5, and 7 posttreatment. Serum cytokine levels (e.g., TNF-α, IL-6 and IL-10) were quantified using commercial ELISA kits according to the manufacturers’ protocols.
Statistical analysis
All data were processed for statistical analysis (means and standard deviations) using SPSS 22.0, and graphical representations were generated using OriginPro 2021. Group differences were evaluated by one-way ANOVA, followed by Bonferroni correction. P values < 0.05 were considered statistically significant. Significance is indicated in the figures by asterisks (*, P < 0.05; **, P < 0.01; ***, P < 0.001).