Zebrafish strains
Zebrafish were raised and cared for following standard protocols57. Wild-type AB zebrafish were maintained and bred in the fish facility at the Zhongshan School of Medicine, Sun Yat-sen University, Guangzhou, adhering to local animal welfare guidelines. The fish were kept at a controlled temperature of 28.5 °C and fed a diet of live and pellet food. Zebrafish embryos were collected through natural spawning and staged according to hours post-fertilization (hpf) or days post-fertilization (dpf). All experimental procedures were approved by the local ethical review committee of the Zhongshan School of Medicine, Sun Yat-sen University.
Construction of pCS2(+)-Cd63-AcGFP
To construct the pCS2(+)-cryaa promoter, the CMV IE94 promoter in the pCS2+ plasmid (#CZP1, CZRC, Hubei, China) was replaced with the cryaa promoter25. Then, Cd63-AcGFP (cd63: National Center for Biotechnology Information, NM_199543) and AcGFP were synthesized and cloned into the pCS2(+)-cryaa promoter, respectively. The cryaa promoter, Cd63-AcGFP, and AcGFP were synthesized by GENEWIZ (Jiangsu, China). To induce lens-specific expression of Cd63-AcGFP, embryos were injected with the plasmid at the one-cell stage. The following day, the embryos were examined under a stereomicroscope. Embryos that were dead or had developmental abnormalities were removed, and only those with a normal appearance were retained for further analysis.
Morpholino injection
Morpholinos (denoted by “MO” below) were purchased from Gene Tools (Philomath, USA). Syntenin-a-MO was adopted from a previously published study22. The sequence is: 5′-TACAACGACATCCTTTCTGCTTTCA-3′. The sequence of standard control morpholino is 5′- CCTCTTACCTCAGTTACAATTTATA-3′. Different doses of MO, including 2, 4, and 8 ng/nl, were injected for testing. To minimize the potential off-target effects, 2 ng/nl of ctrl MO or 2 ng/nl of Syntenin-a-MO was used. Real-time PCR was used to verify the knockdown efficiency. The primers used are listed in Supplementary information: Table S1.
Construction of pCS2(+)-Syntenin-a-DsRed
For the rescue experiments, morpholino-insensitive Syntenin-a–DsRed and DsRed were synthesized by GENEWIZ (Jiangsu, China) and individually cloned downstream of the cryaa promoter in the pCS2(+) vector. Zebrafish embryos at the one-cell stage were co-injected with pCS2(+)-Cd63-AcGFP, either Ctrl MO or SyntA MO, and either cryaa–Syntenin-a–DsRed or cryaa–DsRed, yielding four groups: Ctrl MO + OE-Ctrl (cryaa–DsRed), Ctrl MO + OE-Exp (cryaa–Syntenin-a–DsRed), SyntA MO + OE-Ctrl (cryaa–DsRed), and SyntA MO + OE-Exp (cryaa–Syntenin-a–DsRed). The following steps are as described above.
Live fluorescence imaging
At 24 hpf, PTU (200 µM) was added to the embryo-rearing water to inhibit melanin production. At 48 hpf, the zebrafish were anesthetized with tricaine (0.016%) and embedded in 1.5% low-melting-point agarose for positioning. After positioning at the lens, 3D images with a z-stack and time series videos were captured via a ZEISS LSM980 confocal microscope, and the images were reconstructed and analyzed using ZEN software (3.1).
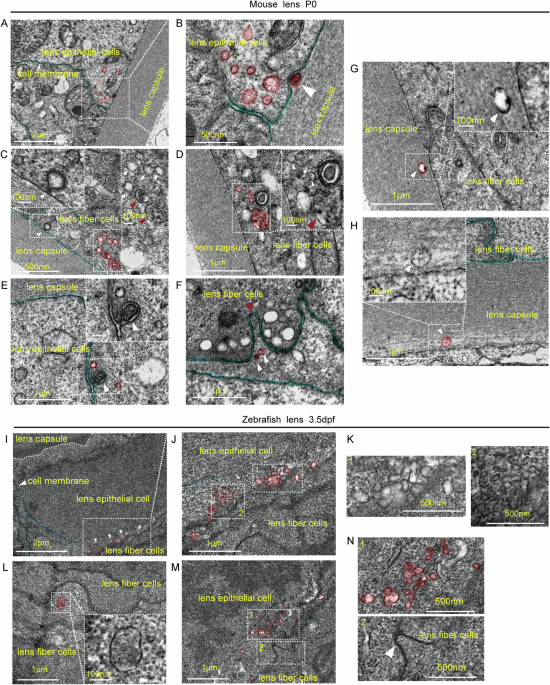
Transmission electron microscopy (TEM)
Lens from 3.5 dpf zebrafish and postnatal (P) 0 mice were collected and transferred into TEM fixative (G1102, Servicebio, Hubei, China) for 2 h at room temperature (RT) and another 24 h at 4 °C. The samples were subsequently dehydrated at RT, penetrated with resin, embedded, and polymerized. After positioning, ultrathin sections were cut and stained with 2% uranium acetate and 2.6% lead citrate. Finally, the sections were examined and imaged via a TEM (JEM-1400Flash, Rigaku, Japan).
Immunoelectron microscopy (IEM)
Zebrafish embryos injected with the cryaa-Cd63-AcGFP plasmid at 3.5 dpf were fixed in IEM fixative (G1124, Servicebio). The samples were washed 3 times with prechilled 0.1 M PBS (pH 7.4) in an ice box. After dehydration in a gradient of prechilled alcohol, resin infiltration, embedding, polymerization, and ultrathin sectioning, the sections were subjected to immunogold labeling. In brief, after being blocked with 1% BSA at RT for 30 min, the sections were incubated with an anti-GFP antibody (A-11122, Thermo Fisher, Massachusetts, USA) at 4 °C overnight. GFP antibody was subjected to immunogold labeling with PAG 10 (G7402, Sigma, Missouri, USA) the next day. After uranium counterstaining, the sections were observed and imaged via a TEM.
EVs isolation from zebrafish embryos (ZF-EVs)
One hundred zebrafish embryos injected with the cryaa-Cd63-AcGFP plasmid at 3.5 dpf were anesthetized according to welfare standards, the rearing water was removed, and the embryos were washed 3 times with Ringer’s solution (containing 116 mM NaCl, 2.9 mM KCl, and 5.0 mM HEPES). During this process, the sample was intermittently blown with a sterile 200 µl tip to completely remove the yolk syncytial layer. The embryos were subsequently placed in a 35 mm petri dish with 2 ml of 0.25% trypsin/ 1 mM EDTA at 37 °C for digestion. During this period, the embryos were blown with a sterile 200 µl tip every 10 min until the digestion was complete, which ensured that no large cell clumps or tissue blocks were visible. The entire process took approximately 30–45 min. CaCl2 (1 mM) and 10% fetal bovine serum (FBS, Biowest, Nord, France) in PBS were used to stop trypsin activity. The final volume was transferred to centrifuge tubes. Differential centrifugation at 300 × g (2 × 10 min), 1200 × g (2 × 10 min), and 10,000 × g (1 × 60 min) was performed to eliminate cellular debris. The supernatant was filtered through a 0.22 μm filter and then centrifuged at 100,000 × g (2 × 90 min). The pellet was resuspended in PBS and stored at −80 °C until use.
The morphology of the ZF-EVs was evaluated via TEM. Fifty (50) micrograms of ZF-EVs were diluted (1:40) with PBS, and then the diluted EVs suspension (20 μL) was dropped onto a 300-mesh cell strainer and incubated for 10 min. Excess liquid was absorbed with filter paper, and the samples were counterstained with 1% phosphotungstic acid for 30 s and observed under a TEM. Nanoparticle tracking analysis (NTA, NanoSight NS300, Malvern, United Kingdom) was used to determine the particle number and size distribution of the ZF-EVs.
Nanoflow cytometry
EVs Membrane Red Stain dye (NEPU-638, NanoFCM, Fujian, China) was diluted with PBS to prepare a 100× working solution. One μL of the diluted 100× working solution was added to 99 μL of EVs sample at a concentration of 2 ~ 6 × 10⁸ particles/ml. The mixture was mixed thoroughly and incubated at 37 °C for 15–20 min in the dark. Detection and analysis were subsequently performed via nanoflow cytometry using a Flow Nano Analyzer (U30E, NanoFCM, Fujian, China) equipped with three lasers (405, 488, and 640 nm wavelengths).
Human embryonic stem cells (hESCs) culture
The H1 hESCs line was kindly provided by Professor Shuyi Chen at the Zhongshan Ophthalmic Center. Mycoplasma contamination was routinely checked using a PCR-based assay to ensure the cell lines were free of contamination. The cells were cultured on plates coated with growth factor-reduced Matrigel matrix (354277, Corning, New York, USA) in mTeSR1 medium (# 85850, STEMCELL Technologies, Vancouver, Canada) without feeder cells. For maintenance, the cells were plated in 6-well plates at 37 °C, 5% CO2, and the culture medium was changed daily. The cells were passaged with Gentle Cell Dissociation Reagent (# 100-0485, STEMCELL Technologies, Vancouver, Canada).
Lentoid body induction
When the density of the H1 cells reached approximately 80–90%, the culture medium was replaced with lentoid body induction culture medium according to the protocol51. The basal medium used for lentoid body induction was Dulbecco’s modified Eagle’s medium/F-12 (C11330500BT, Gibco, Waltham, MA, USA) supplemented with 1% minimum essential medium nonessential amino acid solution (11140050, Gibco), 2 mM GlutaMAX (35050061, Gibco), 0.05% BSA (199897, MP Biomedicals, Ohio, USA), N-2 supplement (17502048, Thermo Fisher Scientific, Waltham, MA, USA), and B-27 supplement (17504044, Thermo Fisher Scientific). Growth factors were then added sequentially to the medium as follows: 100 ng/mL Noggin (120-10C-20, PeproTech, New Jersey, USA) from Days 0 to 6 (stage 1), 100 ng/mL FGF2 (100-18B‒100, PeproTech) and 20 ng/mL BMP4 (120-05‒5, PeproTech)/BMP7 (120-03 P‒10, PeproTech) from Days 7 to 18 (stage 2), and 100 ng/mL FGF2 and 20 ng/mL Wnt3a (315-20‒10, PeproTech) from Days 19 to 35 (stage 3). The culture medium was replaced every other day. For EVs treatment, 50 μl of 0.5 μg/μl ROR1-EVs was added to the medium from days 20 to 35. The lentoid bodies were photographed via a Zeiss Axio Observer Z1 microscope (Zeiss, San Diego, CA, USA) on Day 35 and were collected for further analysis.
Magnetic-activated cell sorting
A magnetic-activated cell sorting (MACS) method was used to purify ROR1+ cells32. First, we prepared single-cell suspensions using TrypLE (Thermo Fisher Scientific) on Day 30 of lentoid induction. Next, an Anti-ROR1 MicroBead Kit (130-103-929, Miltenyi Biotec, Bergisch Gladbach, Germany) was used to label the cells, which were sorted with a MACS cell separator (130-042-201, Miltenyi Biotec). The resulting ROR1+ cells were plated on Matrigel-coated culture plates in M199 medium (Thermo Fisher Scientific) containing 10 ng/ml FGF2 (100-18B-100, Peprotech), 10 ng/ml IGF1 (100-11-100, PeproTech, New Jersey, USA), 10 μg/ml insulin (HY-P0035, MedChemExpress, New Jersey, USA) and 0.05% BSA (199897, MP Biomedicals, Ohio, USA). The culture medium was replaced every other day. To analyze the purity of the ROR1+ cells, we performed flow cytometry using an ROR1 antibody (357806, Biolegend, California, USA). ROR1+ cells from passages 0 to 3 were used for the experiments. To induce the differentiation of ROR1+ cells, the maintenance medium was switched to lentoid induction medium as mentioned above, supplemented with 100 ng/μL FGF and 20 ng/μL Wnt3a. After one-week, lentoid formation was observed, followed by examination of lens differentiation markers via immunofluorescence staining.
RNA-seq
Total RNA was extracted from ROR1+ cells using TRIzol reagent (15596-018; Thermo Fisher, USA). The analysis was performed with 3 biological replicates. The RNA was quantified via the K5500 system (Beijing Kaiao, China), and RNA integrity was assessed via the Agilent 2200 TapeStation (Agilent Technologies, USA). The sequencing libraries were generated via the NEBNext® Ultra™ II RNA Library Prep Kit for Illumina (#7775, NEB, USA) following the manufacturer’s instructions. The libraries were sequenced on the Illumina NovaSeq platforms (Illumina, USA) with 150 bp paired-end reads at RiboBio Co., Ltd. (Ribobio, Guangdong, China). After filtering, the clean reads were aligned to the human reference genome (GRCh38) via HISAT258. Then, feature counts were used to determine the number of reads mapped to each gene, and the transcripts per kilobase of exon model per million mapped reads (TPM) value was calculated for each gene. GO and KEGG functional enrichment analyses were performed via the DAVID59,60 (https://david.ncifcrf.gov/tools.jsp), followed by visualization using an online platform (https://www.bioinformatics.com.cn). Gene expression heatmap were performed using ComplexHeatmap packages (version 2.13.1).
Isolation of EVs from ROR1+ cells cultured in vitro
To isolate ROR1+ LPCs-EVs, the medium was collected after the cells were cultured for 48 h, and EVs were extracted via differential centrifugation. The supernatant was centrifuged sequentially at 300 × g for 10 min and 2000 × g for 30 min to remove cell debris. The resulting mixture was ultracentrifuged at 10,000 × g for 60 min and then filtered through a 0.22 μm filter. Next, we extracted EVs using ultracentrifugation (Optima XE 100 centrifuge) at 100,000 × g for 90 min, as described above. The final pellet was resuspended in PBS and stored at −80 °C until use. TEM, NTA, and WB were used to detect the morphology, particle number, and size distribution, and surface markers of the ROR1+ LPCs-EVs, respectively. The protein concentrations of the ROR1+ LPCs-EVs were measured using a BCA protein assay kit (A55864, Thermo Scientific, USA). The doses used in all subsequent experiments were based on the measured protein concentrations.
Western blot analysis (WB)
Lentoid bodies collected on Day 35 were lysed with RIPA buffer. The protein concentration was quantified via a BCA protein assay kit (A55864, Thermo Scientific, USA). The proteins were mixed with 5× SDS sample buffer, and equal amounts of protein were separated via sodium dodecyl-polyacrylamide gel electrophoresis (SDS‒PAGE). The proteins were then transferred onto polyvinylidene fluoride (PVDF) membranes via electroblotting. The membranes were blocked with 5% nonfat milk and incubated overnight at 4 °C with specific primary antibodies. After being washed with TBS containing 0.1% Tween 20 (TBST), the membranes were incubated with HRP-conjugated secondary antibodies. The target protein bands were detected using an enhanced chemiluminescence reagent (NcmECL Ultra, NCM Biotech, Suzhou, China) and a chemiluminescence detection system (ChemiDoc™ Touch, Bio-Rad Laboratories, California, USA). The antibodies used: PAX6 (1:1000, ab195045, Abcam, Cambridge, UK), αA-crystallin (1:500, sc-28306, Santa Cruz, Texas, USA), β-crystallin (1:200, sc-48335, Santa Cruz), γ-crystallin (1:200, sc-22746, Santa Cruz), and β-actin (1:1000, 4970, Cell Signaling Technology, Massachusetts, USA).
RNA isolation and quantification
Total RNA was extracted from cells using TRIzol reagent (15596-018; Thermo Fisher). Reverse transcription was performed using a PrimeScript RT Master Mix kit (TaKaRa, Kyoto, Japan), and quantitative PCR was performed using a SYBR Premix Ex Taq kit (TaKaRa, Japan) on a LightCycler 480 (Roche, Basel, Switzerland). GAPDH was used as an internal control. Relative gene expression was determined by the 2−ΔΔCt method. The primers used are listed in Supplementary information: Table S1.
Immunofluorescence staining
Zebrafish cryosections or cultured cells were fixed with 4% paraformaldehyde for 10 min at RT. After washing with PBST, the cryosections or cells were permeabilized with 0.5% Triton ×–100 for 10 min and blocked with 5% normal donkey serum for 30 min. Afterward, the sections or cells were incubated with different primary antibodies at 4 °C overnight in a humidified chamber. The next day, Alexa Fluor 488-conjugated or Alexa Fluor 568-conjugated secondary antibodies were applied, and the samples were incubated for 1 h at RT. After washing with PBST, the samples were counterstained with DAPI for nuclear staining. The samples were observed using an LSM980 confocal microscope or an inverted fluorescence microscope. The antibodies used: αA-crystallin (1:100, sc-28306, Santa Cruz), β-crystallin (1:100, sc-48335, Santa Cruz, Texas, USA), γ-crystallin (1:200, sc-22746, Santa Cruz), F-actin (1:200, C2201S, Beyotime, Shanghai, China), β-catenin (1:200, sc-7963, Santa Cruz), GFP (1:200, A-11122, Thermo Fisher, Massachusetts, USA), TOM20 (1:200, 11802-1-AP; Proteintech Group, Illinois, USA), LAMP1 (1:200, ab24170; Abcam, Cambridge, UK), PAX6 (1:300, ab195045, Abcam), Six3 (1:200, sc-398797, Santa Cruz), Sox2 (1:400, 23064, Cell Signaling Technology), and BMI1 (1:100, 5856S, Cell Signaling Technology).
Bromodeoxyuridine (BrdU) labeling and immunostaining
At 3.5 dpf, zebrafish embryos were positioned laterally in a drop of embryo medium for microinjection. A pulled glass capillary loaded with a 10 mM BrdU solution (Sigma-Aldrich) was used to deliver approximately 0.5 nL into the cardiac region adjacent to the caudal yolk sac. After a 2-h period in fresh water, embryos were fixed, permeabilized, and processed for immunofluorescence. Finally, incorporated BrdU was detected by incubating the specimens with a mouse anti-BrdU monoclonal antibody (1:300, RPN20, GE Healthcare) following standard immunofluorescence protocols.
Extracellular vesicle uptake assay
To monitor the internalization of ROR1+ LPCs-EVs, the isolated ROR1+ LPCs-EVs were labeled with DiI Cell-Labeling Solution (V22885, Thermo Fisher, USA). In brief, 100 μl of EVs were diluted to 1 ml with PBS, 10 μl of Dil was added to the suspension, and the mixture was incubated at 37 °C for 10 min. Subsequently, the mixed suspension was centrifuged at 100,000 × g for 60 min. After the supernatant was discarded, the pellet was resuspended in PBS to obtain Dil-labeled ROR1+ LPCs-EVs. Then, the labeled ROR1+ LPCs-EVs were added to a lentoid induction system, which was subsequently fixed and stained for immunofluorescence after 48 h of incubation. A ZEISS LSM980 confocal microscope was used to acquire fluorescence images.
Label-free mass spectrometry analysis
For label-free proteomic analysis, three biological replicates were prepared. The proteins in the ROR1+ LPCs-EVs samples were prepared and digested with trypsin. The resulting peptides were analyzed via liquid chromatography‒tandem mass spectrometry (LC‒MS/MS) using an UltiMate 3000 RSLCnano system coupled with a Q Exactive HF mass spectrometer through a Nanospray Flex ion source (Thermo). The MS data were analyzed using MaxQuant software (version 1.6.6) and searched against the human protein sequence database downloaded from UniProt. Proteins were identified and quantified, and the results were filtered with a 1% false discovery rate (FDR) at both the peptide and protein levels. Protein levels were normalized to the iBAQ values [%] for expression analysis. The total protein list for the ROR1+ LPCs-EVs was generated by identifying proteins that were simultaneously present in three samples (315 identified proteins). We utilized the DAVID bioinformatics resources to conduct GO and KEGG enrichment analyses. GSEA analysis was performed using gseGO and gseKEGG function of clusterprofiler R packages (version 4.4.4). The enrichment analysis results were visualized via https://www.bioinformatics.com.cn.
Statistical analysis
We performed statistical analysis using GraphPad Prism version 8.0 (GraphPad software). Student’s two-tailed t test was used for two-group comparisons. All quantitative data are shown as the mean ± standard deviation (SD). P value less than 0.05 was considered to indicate statistical significance.
Reporting summary
Further information on research design is available in the Nature Portfolio Reporting Summary linked to this article.