Study participants
This study is based on data collected from UK Biobank, details of which can be found in previous research44. In brief, the UK Biobank is a large prospective cohort study that recruited over 500,000 participants aged 39–72 years between 2006 and 2010. At baseline, the participants were required to complete a touchscreen questionnaire, undergo physical measurements and provide biological samples. UK Biobank data has approval from the North West Multicenter Research Ethics Committee (REC reference: 21/NW/0157). All participants provided written informed consent at recruitment. All methods are carried out in accordance with the relevant guidelines and regulations.
From 502,411 participants in the UK Biobank, we initially excluded those who did not complete a 24-hour dietary assessment even once (n = 291,449), as well as those with incomplete dietary data, specifically lacking the completion date, food or nutrient data from the 24-hour dietary assessment (n = 83). Furthermore, we excluded participants who had prevalent cancer (excluding non-melanoma skin cancer, ICD-10:C44; ICD-9:173) before completion of their last 24-hour dietary assessment(n = 18,893). Lastly, we excluded those with implausible energy intakes (< 600 or > 3500 Kcal/day for females, and < 800 or > 4200 Kcal/day for males; n = 2425)45. Ultimately, a total of 189,561 participants were included in our analysis (Supplementary Figure S1).
Dietary intake assessment
In the UK Biobank, dietary intake was assessed using the Oxford Web Q, a web-based 24-hour dietary recall questionnaire, which has been validated against an interviewer administered 24-hour dietary recall46. The questionnaire involved 206 foods and 32 beverages, with specified portion sizes for each item. Participants were asked to select how many portions of each item they had consumed in the previous 24 h. The daily intakes of each food and beverage for each participant were calculated by multiplying the assigned portion size by the number of portions consumed. The daily intake of a food group was calculated by summing the daily intakes of all individual foods within that group. Finally, the nutrient intakes for each participant were calculated by multiplying the quantity consumed of each food and beverage by its nutrient composition, as obtained from the UK food composition database, McCance and Widdowson’s ‘The Composition of Foods’ and its supplements46.Towards the end of the baseline assessment period (April 2009-September 2010), the UK Biobank started collecting detailed dietary intake data using the Oxford Web Q, and a total of 70,724 participants completed the Oxford Web Q questionnaire at baseline. Additionally, between February 2011 and June 2012, participants who provided a working email address were invited via email to complete the Oxford Web Q questionnaire on four separate occasions, spanning approximately one year47. The participants in our study completed the Oxford Web Q questionnaire at least once, and the mean values were calculated from the available data.
Dietary inflammatory index (DII)
The dietary inflammatory index (DII) is a population-based epidemiological investigation tool designed to assess the inflammatory potential of the diet. DII was constructed based on a review of 1943 articles that analyzed the effects of 45 food parameters on six inflammatory biomarkers (IL-1, IL-4, IL-6, IL-10, TNF-α, and CRP)48. Each food parameter was assigned a specific overall inflammatory effect score based on the number of articles, the type of study, and the association between the food parameter and the six inflammatory biomarkers. Meanwhile, to avoid the arbitrariness stemming from the use of raw consumption amounts, a world composite database was developed using data from 11 countries, wherein the global mean and standard deviation for 45 food parameters were calculated. Z-score for each food parameter was calculated by subtracting the ‘global mean’ from the reported amount and dividing this value by its standard deviation. And to minimize the effect of ‘right skewing,’ the z-score was converted to a percentile. Each percentile was then multiplied by 2 and subtracted 1 to achieve a symmetrical distribution with values centered on 0 and bounded between − 1 and + 1. The centered percentile score for each food parameter was multiplied by the corresponding specific overall inflammatory effect score to obtain the food parameter-specific DII score. All the food parameter-specific DII scores were summed to create the overall DII score for each subject. A higher DII score indicated a stronger pro-inflammatory effect of the diet, while a lower DII score reflected a stronger anti-inflammatory effect. In this study, a total of 28 food parameters were obtained from the Oxford Web Q and used in the calculation of DII, including energy, carbohydrate, protein, fat, alcohol, fiber, cholesterol, saturated fatty acid, mono-unsaturated fatty acid, poly-unsaturated fatty acid, omega 3 fatty acid, omega 6 fatty acid, trans fat, niacin, thiamin, riboflavin, vitamin B6, vitamin B12, vitamin A, vitamin C, vitamin D, vitamin E, folic acid, beta carotene, iron, magnesium, zinc and selenium.
Identification of a posteriori dietary patterns
According to the nutrient and culinary similarities, the 206 foods and 32 beverages reported in the Oxford Web Q were classified into 15 food groups (Supplementary Table S1)49. A posteriori dietary patterns were identified using factor analysis based on these food groups. Before performing the factor analysis, the suitability of the data was evaluated through the Kaiser–Meyer–Olkin (KMO) index and Bartlett’s test of sphericity. If the KMO index is greater than 0.5 and the Bartlett’s test is statistically significant (P < 0.05), it indicates that the data is appropriate for factor analysis. The number of a posteriori dietary patterns retained was based on the eigenvalues (> 1.0), the scree plot, and the total variance explained. The factors were extracted using varimax rotation to maintain an uncorrelated state and improve interpretability. Food groups with rotated factor loadings >0.40 were considered as the key components of a posteriori dietary patterns, and each dietary pattern was named based on these food groups50. For each participant, the dietary pattern scores were calculated by multiplying the standard intakes of food groups by their corresponding rotated factor loadings. These dietary pattern scores were then standardized and expressed as z-scores. A higher dietary pattern score indicated greater adherence to a posteriori dietary pattern.
Outcome assessment
Data on cancer diagnoses in the UK Biobank were obtained through linkages to the national cancer and death registries. The outcome of this study was incident lung cancer, which was defined according to the International Classification of Diseases, 10th Revision (ICD-10) codes (C33 and C34) and 9th Revision (ICD-9) codes (162)51. We calculated the follow-up time, starting from the date of last completed Oxford Web Q, to the date of cancer diagnosis (excluding non-melanoma skin cancer, ICD-10:C44; ICD-9:173), death, withdrawal from the UK Biobank cohort, or the last date of follow-up (September 30, 2021, for England and Wales, and October 31, 2021, for Scotland), whichever came first52.
Statistical analysis
For the variables with < 5% missing values, the mode and median were used to impute missing values of categorical and continuous variables, respectively; for the variable ‘pack-years of smoking’ with 15.1% missing values, multiple imputation was adopted. The distribution of variables with missing values before and after imputation is shown in Supplementary Table S2.
The normality of the continuous variables was assessed using the Kolmogorov-Smirnov test. Baseline characteristics of participants by incident lung cancer status were presented as mean (standard deviation [SD]) for normally distributed variables, median (interquartile range) for skewed variables and number (percentage) for categorical variables. The differences between participants with and without lung cancer were examined using t-test for normally distributed variables, Mann-Whitney U test for skewed variables, and chi-squared test for categorical variables.
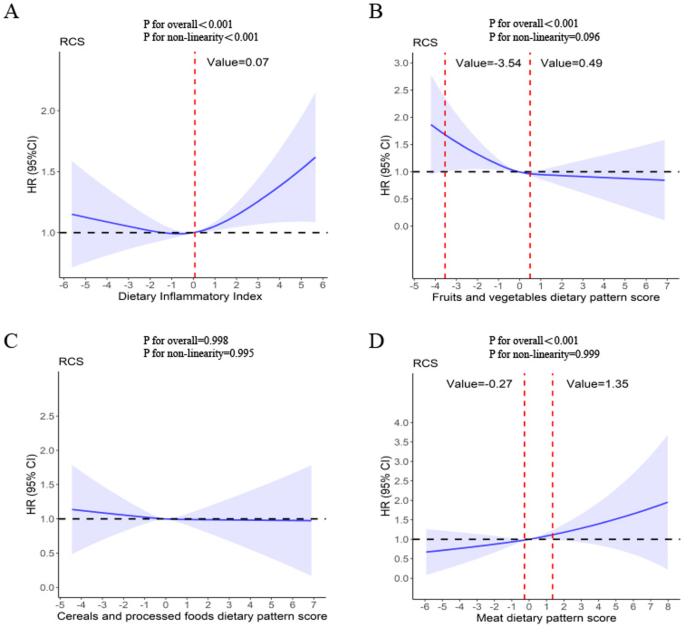
To explore which a posteriori dietary patterns are associated with higher or lower DII, we employed Spearman’s correlation analysis to assess the correlation between the DII and each dietary pattern score. Cox proportional hazards regression models were employed to quantify the associations between the DII, dietary pattern scores, and the risk of lung cancer. The proportional hazards assumption was tested using Schoenfeld residuals, and no violations were identified. In Cox regression models, the DII and dietary pattern scores were classified into tertiles, with the lowest tertile as the reference group. To examine linear trends across tertiles of the DII and dietary pattern scores, the median of each tertile was assigned to each participant within that tertile, and then treated it as a continuous variable in regression models. Three models were fitted for the outcomes. The minimally adjusted model (crude model) was not adjusted for any covariates. One multivariable model (Model 1) was adjusted for age at recruitment (< 60 and ≥ 60 years), sex (female and male), ethnicity (white and non-white), education level (college or university degree, secondary education, some professional qualification, and primary education or below), Townsend deprivation index(continuous), and occupation status (working, retired, homemaker or other). Another multivariable model (Model 2) was additionally adjusted for body mass index (< 25, 25–29.9, and ≥ 30 kg/m2), smoking status (never smokers, former smokers, and current smokers), pack-years of smoking, passive smoke (yes/no)53, drinking status (never drinkers, former drinkers, and current drinkers), family history of lung cancer (yes/no), personal medical history (diabetes, asthma, emphysema or chronic bronchitis, yes/no), use of aspirin or non-aspirin NSAIDs (including ibuprofen, paracetamol, yes/no), use of vitamin supplementation (including vitamin A, vitamin B, vitamin C, vitamin D, vitamin E, and multivitamins, yes/no), use of minerals and other dietary supplementation(including zinc, iron, selenium, fish oil, and glucosamine, yes/no)51. Subsequently, restricted cubic spline regression was employed to evaluate the continuous variation in hazard ratios for the associations between the DII, dietary pattern scores, and lung cancer risk in Model 2, with three knots at the 10th, 50th, and 90th percentiles54.
Considering that smoking is the most significant risk factor for lung cancer and may confound the relationship between diet and lung cancer risk, we conducted stratified analyses by smoking status. Additionally, to further evaluate the potential modifying effect of smoking on the associations between the DII, dietary pattern scores, and lung cancer risk, we included interaction terms (product terms) between DII and dietary pattern scores with smoking status in the fully adjusted models. The significance of these interactions was assessed by comparing models with and without the interaction terms using likelihood ratio tests.
Finally, based on Model 2, we conducted a sensitivity analysis by excluding lung cancer cases diagnosed within the first 2 years of follow-up to eliminate the confounding effect of reverse causation.
All analyses were performed using SPSS 26.0, and R (version 4.4.0), and a two-tailed p-value < 0.05 was considered statistically significant. Restricted cubic spline regression was performed using R rms, and ggplot2 packages.