
The euro area economy is proving to be resilient despite the challenging global environment. Real GDP increased by 0.3% in the third quarter of 2025, which was above the September projections. This followed volatile developments in the first half of the year, reflecting the effects of frontloading in response to higher US trade tariffs and related uncertainty, as well as the impact of sharp fluctuations in Irish data. Domestic demand should remain the main driver of euro area growth, bolstered by rising real wages and employment, in the context of resilient labour markets with record low unemployment rates. Additional government spending on infrastructure and defence announced this year, especially in Germany, alongside improved financing conditions stemming from monetary policy rate cuts since June 2024, is also expected to support the domestic economy. On the external side, while competitiveness challenges persist, including some that are of a structural nature, exports are expected to pick up next year. This improvement is attributed to a rebound in foreign demand amid declining trade policy uncertainty, despite a gradually unfolding impact from higher tariffs. Annual average real GDP growth is projected to be 1.4% in 2025, 1.2% in 2026, 1.4% in 2027 and 1.4% in 2028. Compared with the September 2025 projections, GDP growth has been revised up over the whole projection horizon, reflecting better than expected data, reduced trade policy uncertainty, stronger foreign demand and lower energy commodity prices.[1]
Inflation is projected to decrease from 2.1% in 2025 to 1.9% in 2026 and then to 1.8% in 2027, before rising to the ECB’s medium-term target of 2% in 2028. The expected decline in headline inflation (as measured by the Harmonised Index of Consumer Prices – HICP) at the start of 2026 reflects a downward base effect stemming from energy prices, while inflation in non-energy components should continue to ease throughout 2026. The contribution of energy inflation to headline inflation is expected to remain muted up to late 2027, before increasing notably in 2028 driven by the expected implementation of the EU Emissions Trading System 2 (ETS2), with an upward impact of 0.2 percentage points on headline inflation. HICP inflation excluding energy is expected to fall from 2.5% in 2025 to 2.2% in 2026 and to 2.0% in 2027 and 2028. Food inflation is projected to drop noticeably as the effects of prior price increases in global food commodities and adverse weather conditions over the summer subside, and is seen to stabilise at rates somewhat above 2% as of late 2026. HICP inflation excluding energy and food (HICPX) is projected to moderate from 2.4% in 2025 to 2.0% in 2028 as services inflation declines amid easing labour cost pressures, and as the past appreciation of the euro feeds through the pricing chain, curbing goods inflation. Wage growth should continue to moderate through 2026, before stabilising at around 3%, underpinned by a resilient labour market and productivity growth just slightly below 1%. Unit labour cost growth is expected to ease, although the impact on inflation is seen to be partly offset by a gradual recovery in profit margins over the projection horizon. Compared with the September 2025 projections, the outlook for headline HICP inflation has been revised up by 0.2 percentage points for 2026, reflecting recent data surprises for HICP inflation and wage growth, with the latter leading to a notable upward revision to the wage outlook. The projection for HICP inflation has been revised down slightly for 2027 as a result of an assumed lower contribution from energy inflation, since the implementation of ETS2 is now expected to be postponed from 2027 to 2028, although this contribution is seen to be partly offset by stronger services inflation.
Table 1
Growth and inflation projections for the euro area
(annual percentage changes, revisions in percentage points)
|
December 2025 |
Revisions vs September 2025 |
|||||||
|---|---|---|---|---|---|---|---|---|
|
2024 |
2025 |
2026 |
2027 |
2028 |
2025 |
2026 |
2027 |
|
|
Real GDP |
0.9 |
1.4 |
1.2 |
1.4 |
1.4 |
0.2 |
0.2 |
0.1 |
|
HICP |
2.4 |
2.1 |
1.9 |
1.8 |
2.0 |
0.0 |
0.2 |
-0.1 |
|
HICP excluding energy and food |
2.8 |
2.4 |
2.2 |
1.9 |
2.0 |
0.0 |
0.3 |
0.1 |
Notes: Real GDP figures refer to annual averages of seasonally and working day-adjusted data. Historical data may differ from the latest Eurostat publications owing to data releases after the cut-off date for the projections. Revisions are calculated from rounded figures. Data are available for downloading, also at quarterly frequency, from the Macroeconomic Projection Database on the ECB’s website.
The global economy has demonstrated resilience this year, despite the headwinds caused by tariffs.[3] Lower tariffs between the United States and China and reduced trade policy uncertainty, together with lower oil prices and easier financing conditions than foreseen in the September 2025 projections, are providing some relief to the global economy. These factors, combined with positive data surprises in major economies, have contributed to a slightly stronger growth outlook and lower expected inflation for the global economy this year and in 2026.
While the global growth outlook has been revised up slightly compared with the previous projections, it remains subdued relative to the pre-pandemic average. Global real GDP growth is estimated to be 3.5% in 2025 and is expected to gradually decline to 3.3% in 2026 and then to stay at this level in 2027 and 2028 (Table 2).The upward revision to the outlook for global growth largely reflects a stronger growth outlook for the United States and China. In addition to lower tariffs, the slight upward revision to the growth outlook for the United States is due to more resilient domestic demand than previously expected, which is seen to be supported over the near term by positive wealth effects stemming from recent equity price developments and by overall higher fiscal spending assumptions. For China, real GDP growth projections for this year and 2026 have also been revised up slightly to reflect stronger than previously estimated export dynamics and a larger assumed fiscal stimulus.
Table 2
The international environment
(annual percentage changes, revisions in percentage points)
|
|
December 2025 |
Revisions vs September 2025 |
||||||
|---|---|---|---|---|---|---|---|---|
|
2024 |
2025 |
2026 |
2027 |
2028 |
2025 |
2026 |
2027 |
|
|
World real GDP (excluding the euro area) |
3.6 |
3.5 |
3.3 |
3.3 |
3.3 |
0.2 |
0.2 |
0.0 |
|
Global trade (excluding the euro area)1) |
4.3 |
4.4 |
2.0 |
3.1 |
3.1 |
1.6 |
0.5 |
0.0 |
|
Euro area foreign demand2) |
3.7 |
3.8 |
1.9 |
3.1 |
3.0 |
1.0 |
0.5 |
0.0 |
|
World CPI (excluding the euro area) |
4.0 |
3.1 |
2.8 |
2.5 |
2.6 |
-0.1 |
-0.1 |
0.0 |
|
Export prices of competitors in national currency3) |
2.3 |
1.1 |
1.6 |
2.0 |
2.0 |
-0.5 |
-0.5 |
-0.3 |
Note: Revisions are calculated from rounded figures.
1) Calculated as a weighted average of imports.
2) Calculated as a weighted average of imports of euro area trading partners.
3) Calculated as a weighted average of the export deflators of euro area trading partners.
Headline consumer price index (CPI) inflation across major advanced and emerging market economies is projected to decline gradually, but at a somewhat faster pace than foreseen in the September projections.[4] It is expected to stand at 3.1% in 2025 and to decrease to 2.8% in 2026 and 2.5% in 2027, followed by a small uptick to 2.6% in 2028. This implies a slightly faster than previously projected decline in CPI inflation this year and next year, owing to lower inflation outcomes across most advanced economies than previously expected. In addition, the downward revision reflects lower bilateral tariffs between the United States and China, as well as a slightly smaller than previously foreseen impact of tariffs on inflation in the United States. Furthermore, in China, weaker domestic demand explains the more gradual than previously expected increase in consumer price inflation over the projection horizon.
Global import growth is projected to remain resilient this year, but its momentum is expected to slow next year. It is projected to be 4.4% in 2025, largely reflecting strong import growth in the first half of this year, before declining to 2.0% in 2026 owing to the adverse impact of tariffs. Global imports are then projected to recover to stand at 3.1% in both 2027 and 2028. The outlook for global imports has been revised up significantly for this year and next year compared with the September projections, while the projections for 2027 remain unchanged. The upward revision to import growth reflects positive data surprises for the second quarter of 2025, mostly across emerging market economies, and, to a lesser extent, lower tariffs agreed between the United States and China in early November 2025. The data surprises can be attributed to two main factors. First, imports exceeded expectations in countries across South-East Asia as well as in non-euro area EU Member States. Concurrent positive surprises in export performance suggest that several of these countries, especially in South-East Asia, might be benefiting from the ongoing reconfiguration of global trade relationships. This shift has been prompted by higher US tariffs and includes the rerouting of Chinese exports to these countries, alongside robust trade in technology products linked to artificial intelligence-related investment. Second, imports in Egypt, India and Türkiye significantly exceeded expectations, although in these cases there does not appear to be a clear link between their stronger imports and diverted Chinese exports.
The outlook for euro area foreign demand has been revised up compared with the previous projections. Growth in euro area foreign demand is expected to stand at 3.8% in 2025, and then to slow to 1.9% in 2026 in line with weaker global trade growth, before recovering to 3.1% in 2027 and 3.0% in 2028. The upward revision for this year, similarly to global imports, reflects data for the second quarter which indicate that the contraction in euro area foreign demand was smaller than previously expected.
Euro area competitors’ export prices are projected to increase at a pace below the historical average and have been revised down compared with the September projections. Euro area competitors’ export prices (in annual terms and measured in national currencies) are expected to increase by 1.1% in 2025, 1.6% in 2026 and 2.0% in both 2027 and 2028. This is below the historical average of 2.6% recorded over 2000-19, as Chinese export price inflation in annual terms is projected to remain in negative territory until the third quarter of 2026. Compared with the previous projections, competitors’ export prices have been revised down over the whole projection horizon, reflecting a lower path of export price inflation across advanced economies, including the United States and several non-euro area EU Member States, and to a lesser extent in China.
Box 1
Assumptions about tariffs and technical assumptions
Compared with the September 2025 projections, the effective tariff rates applied by the United States to euro area imports and vis-à-vis all its trading partners have somewhat decreased following the emergence of further details on the EU-US trade deal and other trade-related announcements. The staff projections take into account the tariff rates, pauses and exemptions in effect at the time of the cut-off date for the projections for the global economy (26 November) and assume that these will remain at the same level over the entire projection horizon. The effective tariff rate applied by the United States to euro area goods is estimated to have decreased slightly to 12.1%, down from 13.1% in the September projections. This follows clarifications on exempt products, new tariffs on timber and lumber, and an increase in the number of products classified as steel and aluminium derivatives which qualify for a lower tariff rate.[5] As regards the effective tariff rate applied by the United States across all its goods imports, this is also estimated to have fallen, decreasing to 18.6% from 21.0% in the previous projections, mainly as a consequence of the recent announcements on bilateral tariffs between the United States and China.
As regards the technical assumptions, compared with the September projections the changes are limited overall, except for the energy and ETS price assumptions. Oil price assumptions have been revised down by around 4% on average for 2026-27 and wholesale gas price assumptions by 8.6%, while the futures-based assumption for the price of ETS1 allowances has increased notably, rising by around 15%. Following recent announcements, the introduction of the ETS2 scheme is now assumed to be postponed for one year, to 2028, and the price assumption is based on the price used by the European Commission in its Autumn 2025 Economic Forecast (€46 per tonne of CO2, which is notably below the value of €59 per tonne of CO2 assumed for 2027 in the previous Eurosystem/ECB projections; see Box 2 for more details).[6] The euro has depreciated by 0.5% against the US dollar and by 0.1% in nominal effective terms since the September projections. Short-term interest rate assumptions have been revised only marginally, while the assumptions for long-term rates have been revised down by 0.2 percentage points for both 2026 and 2027.
Table
Technical assumptions
|
|
December 2025 |
Revisions vs September 2025 |
||||||
|---|---|---|---|---|---|---|---|---|
|
2024 |
2025 |
2026 |
2027 |
2028 |
2025 |
2026 |
2027 |
|
|
Commodities: |
||||||||
|
Oil price (USD/barrel) |
81.2 |
69.2 |
62.5 |
62.6 |
64.0 |
-0.7 |
-4.1 |
-3.8 |
|
Natural gas prices (EUR/MWh) |
34.4 |
36.5 |
29.6 |
27.5 |
25.0 |
-2.1 |
-9.9 |
-7.4 |
|
Wholesale electricity prices (EUR/MWh) |
77.7 |
83.9 |
75.0 |
73.7 |
71.4 |
-0.8 |
-3.6 |
0.7 |
|
EU Emissions Trading System 1 (ETS1) allowances (EUR/tonne of CO2) |
65.2 |
73.7 |
82.8 |
85.1 |
87.7 |
4.3 |
15.2 |
15.4 |
|
EU Emissions Trading System 2 (ETS2) allowances (EUR/tonne of CO2) |
– |
– |
– |
– |
46.0 |
– |
– |
-* |
|
Non-energy commodity prices, in USD (annual percentage change) |
9.2 |
5.7 |
0.1 |
0.5 |
-0.3 |
0.9 |
1.1 |
-0.4 |
|
Exchange rates: |
||||||||
|
USD/EUR exchange rate |
1.08 |
1.13 |
1.16 |
1.16 |
1.16 |
0.0 |
-0.5 |
-0.5 |
|
Euro nominal effective exchange rate (EER41) (Q1 1999 = 100) |
124.1 |
127.7 |
129.8 |
129.8 |
129.8 |
0.0 |
-0.1 |
-0.1 |
|
Financial assumptions: |
||||||||
|
Three-month EURIBOR (percentage per annum) |
3.6 |
2.2 |
2.0 |
2.1 |
2.3 |
0.0 |
0.1 |
-0.1 |
|
Ten-year government bond yields (percentage per annum) |
2.9 |
3.1 |
3.2 |
3.4 |
3.6 |
0.0 |
-0.2 |
-0.2 |
Notes: Revisions are expressed as percentages for levels and as percentage points for growth rates and percentages per annum. Revisions for growth rates and interest rates are calculated on figures rounded to one decimal place, while revisions reported as percentage changes are calculated on unrounded figures. The technical assumptions about euro area interest rates and commodity prices are based on market expectations, with a cut-off date of 26 November 2025. Oil prices refer to Brent crude oil spot and futures prices. Gas prices refer to the Dutch TTF gas spot and futures prices. Electricity prices refer to the average wholesale spot and futures price for the five largest euro area countries. The “synthetic” future price for ETS1 allowances (EUA) is derived as the end-of-month linearly interpolated value of the two nearest European Energy Exchange EUA futures. Monthly EUA futures prices are then averaged to produce an equivalent to annual frequency. In the absence of meaningful trading of ETS2 allowances, the price assumptions were set by staff in line with the assumption of the European Commission in its Autumn 2025 Economic Forecast (for further details, see Box 2). The paths of commodity prices are implied by futures markets in the ten working days ending on the cut-off date. Bilateral exchange rates are assumed to remain unchanged over the projection horizon at the average levels prevailing in the ten working days ending on the cut-off date. The assumptions for euro area ten-year nominal government bond yields are based on the average of countries’ ten-year bond yields, weighted by annual GDP figures. Where the necessary data exist, the country-specific ten-year nominal government bond yields are defined as the ten-year benchmark bond yields prolonged using the forward par yields derived, on the cut-off date, from the corresponding country-specific yield curves. For the other countries, the country-specific ten-year government bond yields are defined as the ten-year benchmark bond yield prolonged using a constant spread (observed on the cut-off date) over the technical euro area risk-free long-term interest rate assumption.
* In the September 2025 projections, an ETS2 allowance price of €59 per tonne of CO2 was assumed for 2027, while in the December 2025 projections the scheme has been assumed to start only in 2028 with a lower price of €46 per tonne of CO2. See Box 2 for further details.
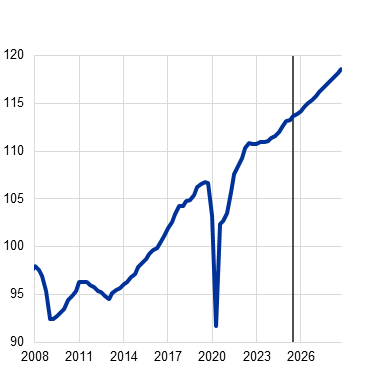
Euro area economic activity rose by 0.3% in the third quarter of 2025, which was much stronger than expected in the September projections (0.0%) but more in line with expectations when adjusting for volatility in Irish data (Chart 1). While a sharp unwinding of frontloading that took place in the first quarter of 2025 had been anticipated in Ireland, Irish GDP declined by much less than expected in the third quarter, which explains most of the upward surprise in euro area GDP growth (Chart 1, panel c). An adjusted measure of euro area GDP that uses so-called “modified domestic demand” instead of GDP for Ireland also suggests that growth was 0.3% in the third quarter of 2025.[7] By this measure, the outturn was only slightly stronger than the respective September projection (0.2%). Across sectors, services activity continued to expand, driven by robust tourism and a pick-up in digital services. By contrast, industrial activity remained subdued in the third quarter, hampered by higher tariffs, still elevated uncertainty and a stronger euro. Meanwhile, the recovery in consumer demand for goods and services continued, supported by improving real incomes amid resilient labour markets.
Real GDP is expected to increase modestly in the fourth quarter, amid continued divergence across sectors. The composite output Purchasing Managers’ Index (PMI) stood at 52.8 in November, indicating positive underlying growth momentum.[8] The PMI for services business activity increased further, confirming services as the primary driver of growth. By contrast, the manufacturing output PMI declined, remaining just above the threshold indicating no change. The European Commission’s Economic Sentiment Indicator rose further in November, reaching its highest level since April 2023. Overall, survey data suggest moderate growth in the final quarter of the year. However, a projected sharp contraction in GDP growth in Ireland in the fourth quarter of 2025 is seen to subtract around 0.1 percentage points from growth in the euro area, suggesting a slight dip in euro area GDP growth to 0.2% in the fourth quarter (Chart 1, panel c). Some of the headwinds related to tariffs and trade policy uncertainty should start to fade, therefore, euro area growth is expected to pick up in the first quarter of 2026, returning to 0.3%. The projected annual growth rate for 2025 of 1.4% is to a significant extent driven by within-year growth dynamics, although carry-over effects from 2024 are also seen to play a role.
Chart 1
Euro area real GDP
|
a) Real GDP growth |
b) Real GDP level |
|---|---|
|
(quarter-on-quarter percentage changes, seasonally and working day-adjusted quarterly data) |
(chain-linked volumes, index, 2020=100) |
 |
c) Euro area real GDP growth – impact of Ireland
(quarter-on-quarter percentage changes and percentage point contributions, seasonally and working day-adjusted quarterly data)
Notes: Historical data may differ from the latest Eurostat publications owing to data releases after the cut-off date for the projections. The vertical line indicates the start of the current projection horizon. In panel a) the ranges shown around the central projections provide a measure of the degree of uncertainty and are symmetric by construction. They are based on past projection errors, after adjustment for outliers. The bands, from darkest to lightest, depict the 30%, 60% and 90% probabilities that the outcome of real GDP growth will fall within the respective intervals. For more information, see the box entitled “Illustrating the uncertainty surrounding the projections” in the March 2023 ECB staff macroeconomic projections for the euro area. In panel c), the red bars refer to the impact of Irish real GDP growth on the euro area aggregate and the yellow bars refer to the contribution from growth in the other euro area countries. Modified domestic demand is described in footnote 7.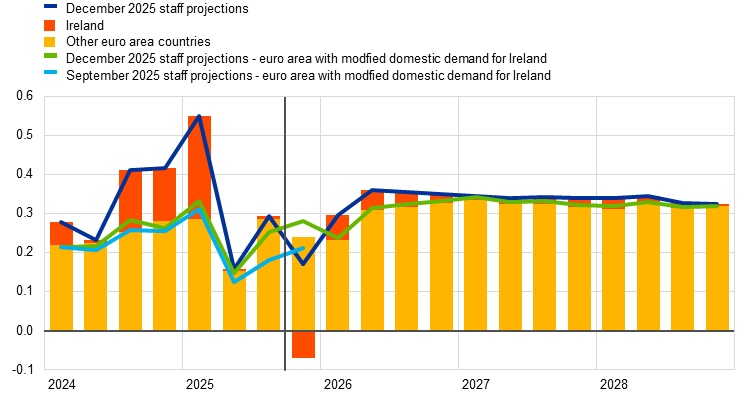
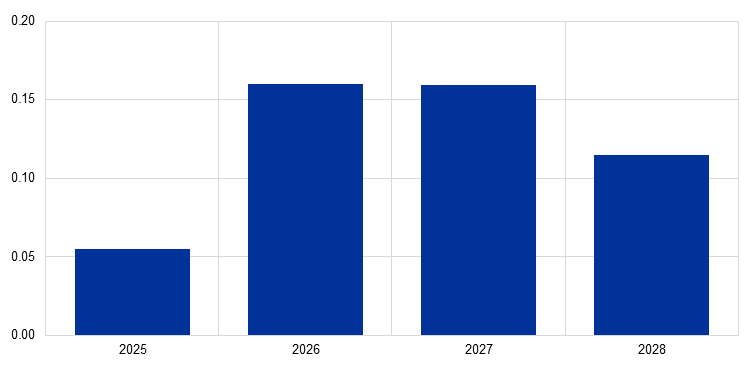
Annual real GDP growth is projected to average 1.3% over the projection horizon, supported by real disposable income growth, receding uncertainty, robust foreign demand, and fiscal stimulus related to defence and infrastructure spending. This fiscal stimulus, mostly accounted for by Germany, should provide a boost to euro area GDP growth in the medium term, which is assessed to cumulatively amount to 0.5% by 2028, with the highest impact on growth expected in 2026-27 (Chart 2).[9] An estimated slight dip in real GDP growth, from 1.4% in 2025 to 1.2% in 2026, is seen to be the consequence of lower carry-over effects in 2026 following the expected somewhat more modest growth in the second half of 2025. Driven by strengthening carry-over effects, annual real GDP growth is projected to increase thereafter and stabilise at 1.4% in 2027-28, reflecting similar carry-over and within-year contributions in these two years. When using modified domestic demand for Ireland instead of Irish GDP, euro area real GDP growth is seen to rise more gradually, increasing from 1.0% in 2025 to 1.1% in 2026 and to 1.3% in both 2027 and 2028.
Chart 2
Impact on the projections for real GDP growth of defence and infrastructure spending announced since the March 2025 projections
(percentage points)
The impact of monetary policy rate cuts since June 2024 is expected to gradually outweigh the lagged effects of the previous tightening cycle, thereby supporting growth. The negative impact of the previous monetary policy tightening cycle on economic growth is now seen to have largely dissipated. Based on market expectations regarding the future path of interest rates at the time of the cut-off date for the projections, small positive impacts from the subsequent loosening phase are expected in 2027-28. However, there is considerable uncertainty surrounding the quantitative assessment of these impacts.
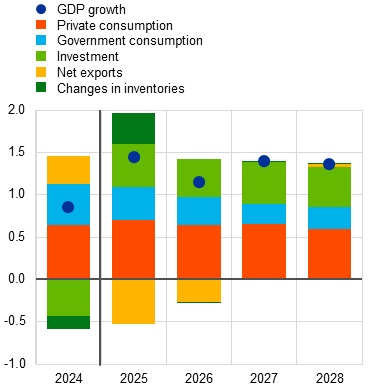
Real GDP growth should continue to be driven by domestic demand, with the negative contribution of net exports diminishing to zero in 2027-28. From an expenditure perspective (Chart 3, panel a), private consumption is projected to grow robustly throughout the horizon, providing the largest contribution to real GDP growth. The strengthening of households’ spending is expected to be underpinned by their increasing purchasing power, reflecting robust wage and employment growth amid continued labour market resilience. Additionally, investment growth should outpace GDP growth throughout the horizon. Private investment is expected to compensate for the slowdown in public investment in 2027-28 resulting from the expiry of the Next Generation EU (NGEU) programme funding. Over the projection horizon investment growth should be driven by a reduction in uncertainty, increased defence and infrastructure spending, and strengthening profits and improving demand conditions linked to the cyclical recovery. By contrast, export growth is expected to remain subdued despite improving foreign demand, as persistent euro area competitiveness challenges, US tariffs and the past appreciation of the euro weigh on export performance. This is likely to lead to continued losses in export market shares. As a result, net exports are projected to make negative contributions to real GDP growth in 2025 and 2026, with import growth outpacing export growth. These negative contributions are seen to be partially offset by a positive contribution from changes in inventories in 2025.
Chart 3
Euro area real GDP growth – decomposition into the main expenditure components
|
a) December 2025 projections |
b) Revisions vs the September 2025 projections |
|---|---|
|
(annual percentage changes and percentage point contributions) |
(percentage points and percentage point contributions) |
 |
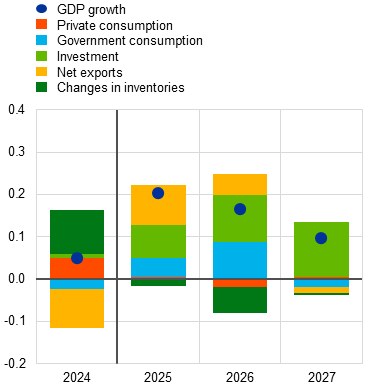 |
Notes: Data are seasonally and working day-adjusted. Historical data may differ from the latest Eurostat publications owing to data releases after the cut-off date for the projections. The vertical line indicates the start of the current projection horizon. Revisions are calculated based on unrounded figures.
Compared with the September 2025 projections, real GDP growth has been revised up by 0.2 percentage points for 2025 and 2026 and by 0.1 percentage points for 2027 (Chart 3, panel b). The upward adjustment for 2025 reflects revisions to past data, including the better than expected outturn for the third quarter of 2025. The somewhat lower trade policy uncertainty, stronger foreign demand and lower energy commodity prices have led to the upward revision to the growth outlook for 2026. Marginally stronger quarterly dynamics and a larger carry-over effect from the stronger growth momentum in 2026 together entail a small upward revision to the outlook for 2027. In terms of expenditure components, the largest upward revisions for 2025-27 relate to investment and, in particular, stronger business investment over the whole horizon and more dynamic government investment in 2027, as well as stronger government consumption in 2025-26. Net trade has also been revised up for 2025, reflecting the better than expected performance of exports in the first three quarters of the year.
Table 3
Real GDP, trade and labour market projections
(annual percentage changes, unless otherwise indicated, revisions in percentage points)
|
|
December 2025 |
Revisions vs September 2025 |
||||||
|---|---|---|---|---|---|---|---|---|
|
2024 |
2025 |
2026 |
2027 |
2028 |
2025 |
2026 |
2027 |
|
|
Real GDP |
0.9 |
1.4 |
1.2 |
1.4 |
1.4 |
0.2 |
0.2 |
0.1 |
|
Real GDP with modified domestic demand for Ireland1) |
0.8 |
1.0 |
1.1 |
1.3 |
1.3 |
– |
– |
– |
|
Private consumption |
1.2 |
1.3 |
1.2 |
1.3 |
1.1 |
0.0 |
-0.1 |
0.0 |
|
Government consumption |
2.2 |
1.8 |
1.5 |
1.1 |
1.2 |
0.2 |
0.4 |
0.0 |
|
Investment |
-2.0 |
2.4 |
2.2 |
2.4 |
2.2 |
0.3 |
0.5 |
0.6 |
|
Exports2) |
0.5 |
1.9 |
1.6 |
2.4 |
2.6 |
0.6 |
0.5 |
-0.1 |
|
Imports2) |
-0.1 |
3.2 |
2.3 |
2.7 |
2.8 |
0.4 |
0.3 |
0.0 |
|
Contribution to GDP from: |
||||||||
|
Domestic demand |
0.7 |
1.6 |
1.4 |
1.4 |
1.3 |
0.1 |
0.2 |
0.1 |
|
Net exports |
0.3 |
-0.5 |
-0.3 |
0.0 |
0.0 |
0.1 |
0.0 |
0.0 |
|
Inventory changes |
-0.1 |
0.4 |
0.0 |
0.0 |
0.0 |
0.0 |
-0.1 |
0.0 |
|
Real disposable income |
2.4 |
1.2 |
0.9 |
1.2 |
0.8 |
0.3 |
0.0 |
0.5 |
|
Household saving ratio (% of disposable income) |
15.2 |
15.0 |
14.7 |
14.7 |
14.4 |
0.2 |
0.2 |
0.7 |
|
Employment3) |
0.9 |
0.7 |
0.6 |
0.5 |
0.5 |
0.1 |
0.1 |
0.0 |
|
Unemployment rate |
6.3 |
6.3 |
6.2 |
6.1 |
5.9 |
-0.1 |
-0.1 |
0.0 |
|
Current account (% of GDP) |
2.6 |
1.9 |
1.7 |
1.7 |
1.7 |
-0.5 |
-0.8 |
-0.8 |
Notes: Real GDP and components refer to seasonally and working day-adjusted data. Historical data may differ from the latest Eurostat publications owing to data releases after the cut-off date for the projections. Revisions are calculated based on rounded data. Data are available for downloading, also at quarterly frequency, from the Macroeconomic Projection Database on the ECB’s website.
1) Modified domestic demand is described in footnote 7.
2) This includes intra-euro area trade.
3) Persons employed.
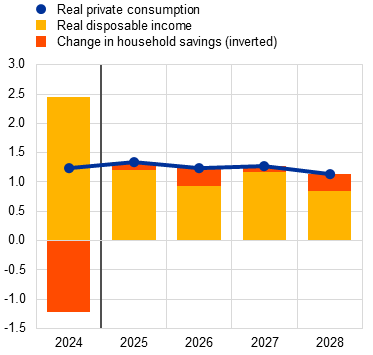
Private consumption should expand steadily, supported by increases in labour compensation and non-labour income. Private consumption has continued to grow over recent quarters – albeit at a slower pace than in the second half of 2024, reflecting heightened economic uncertainty. Consumption growth is expected to regain some strength in the coming quarters, with annual rates of around 1.2% projected over 2026-28, which is broadly in line with its historical average (Chart 4, panel a). This outlook is largely due to rising real disposable income, supported mainly by wage income and, to a lesser extent, by non-labour income. Consumer confidence is assumed to recover gradually towards its historical norm over the medium term. This is supported by overall resilient labour market prospects, which should also lead to a small gradual decline in the household saving ratio (Chart 4, panel b). Nevertheless, the saving ratio is likely to remain elevated, reflecting heightened economic uncertainty as well as potential Ricardian effects in countries with announced fiscal stimulus. These effects are supported by evidence from the ECB’s Consumer Expectations Survey. Interest rates remain somewhat above historical average levels and access to credit continues to be tight, which also likely supports an elevated saving ratio. However, it is not clear whether these historical averages are the right benchmarks for the medium term, given that the economy has experienced several large shocks in the post-pandemic period. Additionally, households may need savings to finance higher future housing investment. Despite the more favourable real disposable income dynamics over the projection horizon, real private consumption is broadly unrevised as the stronger income gains are expected to translate into a persistently higher saving ratio.
Chart 4
Household consumption, income and savings
|
a) Real private consumption growth – decomposition |
b) Household saving ratio |
|---|---|
|
(annual percentage changes, percentage point contributions) |
(percentages of disposable income) |
 |
 |
Notes: Data are seasonally and working day-adjusted. Historical data may differ from the latest Eurostat publications owing to data releases after the cut-off date for the projections. The vertical line indicates the start of the current projection horizon. In panel a), to account for approximation and statistical discrepancies between the national and sectoral accounts, mainly due to their different publication schedules, the contribution to private consumption growth of the (inverted) change in household savings is calculated as a residual: an increase in savings implies a negative contribution to consumption growth. In panel b), the pre-pandemic average refers to 1999-2019.
Housing investment should recover over the projection horizon on the back of favourable financing conditions and rising real incomes. After increasing in the first and second quarters of 2025, housing investment temporarily declined in the third quarter, amid negative outturns in several euro area countries. The decline in housing investment underscores the fragility of the moderate recovery that started at the beginning of the year and reflects still low affordability, high construction costs and persistent macroeconomic uncertainty. Nevertheless, housing investment is projected to strengthen in 2026-28. This recovery reflects improved housing demand – as also evidenced by the continued increase in the number of residential building permits issued and evidence from the Consumer Expectations Survey on households’ perceptions of housing as a good investment – and is attributable to the gradual decline in mortgage rates since the end of 2023. It is also supported by continued growth in real household income and is also evidenced in rising house prices.
Business investment has been more resilient than expected and should gradually gain momentum over the medium term, driven by improving economic activity, receding uncertainty and the impact of fiscal stimuli in some countries. Following positive, albeit slowing, growth rates in the first half of 2025 – driven by frontloading effects in anticipation of higher tariffs – euro area business investment (excluding the volatile Irish intellectual property products) grew robustly in the third quarter, notwithstanding the higher tariffs and still elevated uncertainty. This contrasts with the expectation of a contraction in the September projections. Business investment is projected to continue to rise in 2026-28, amid increasing profit growth, supportive financing conditions, strengthening domestic and foreign demand, declining uncertainty and spillovers from defence and infrastructure spending.
Exports are expected to remain weak in historical terms, despite a short-term pick-up, a positive reassessment owing to a lower effective tariff rate and a more gradual unfolding of the impact of tariffs. Following volatility in the first half of 2025, when exporters frontloaded shipments ahead of the imposition of US tariffs, euro area exports are expected to have grown slightly in the second half of 2025. Some renewed strength in exports in the third quarter of 2025 might have reflected specificities of the pharmaceuticals supply chain, amid uncertainty about the tariff rate for pharmaceuticals before the EU-US trade deal was reached. In addition, export orders for goods and services do not suggest any further significant deterioration in the near term. Export growth is projected to remain weak in historical terms, at 1.9% in 2025 and 1.6% in 2026, but has been revised up by 0.6 percentage points for 2025 and 0.5 percentage points for 2026. These revisions reflect the 1 percentage point reduction in the effective tariff rate applied by the United States to euro area imports (see Box 1) as well as expectations that the fully fledged effects of US tariffs will materialise more gradually, as export volumes and prices have adjusted downwards less than previously expected.
Over the medium term the outlook for exports continues to be clouded by adverse trade policies, competitive pressures – especially from Asian countries – and the past appreciation of the euro. Conditional on unchanged trade policies, export growth is projected to strengthen gradually to stand at 2.6% in 2028, though continuing to fall short of foreign demand. This is due to structural competitiveness challenges, primarily from Asian countries, and to an elevated euro exchange rate which is seen to adversely affect price competitiveness throughout the projection horizon. As a result, compared with the September projection exercise, further losses in export market shares are assumed in addition to those that have already materialised in 2025.
On the import side, growth prospects have improved compared with the September projection exercise. This reflects primarily more robust developments recently, with import volumes now projected to grow by 3.2% in 2025 owing to the appreciation of the euro exchange rate, which has reduced import prices. Imports are expected to expand steadily in the medium term also, supported by low-cost sourcing from China and other Asian economies whose export prices are expected to remain subdued over the medium term. Overall, net trade is expected to make a substantial negative contribution to euro area growth in 2025 (-0.5 percentage points) and 2026 (-0.3 percentage points), but neutral contributions in 2027 and 2028.
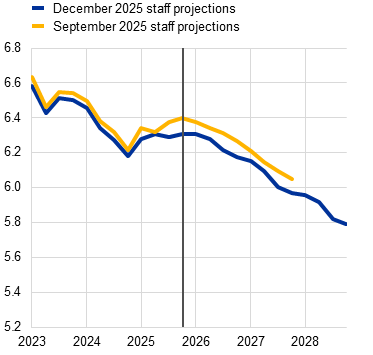
The labour market is projected to remain resilient, with the unemployment rate set to decline steadily throughout the horizon. The unemployment rate is expected to decline over the medium term and to reach a historically low level of 5.8% by the end of 2028 (Chart 5), in the context of rather stable projected growth in total employment in 2026-28 and declining labour force growth. Compared with the September projections, the lower unemployment rate from 2025 to 2027 primarily reflects a lower outcome in the third quarter of 2025 than previously expected.
Chart 5
Unemployment rate and total employment growth
|
a) Unemployment rate |
b) Employment |
|---|---|
|
(percentage of labour force) |
(year-on-year percentage changes) |
 |
 |
Note: The vertical line indicates the start of the current projection horizon.
Employment growth is projected to slow in 2026 and to remain broadly unchanged thereafter (Chart 5, panel b). Overall, robust employment growth in 2025 is in line with labour force growth of the same amount in the year. While the growth rate of the labour force is projected to decline thereafter, amid adverse demographics and lower migration inflows, growth in employment is projected to remain above labour force growth, primarily on account of the services sector. Employment growth should, however, remain broadly flat over the projection horizon, but slightly stronger than in the September projections.
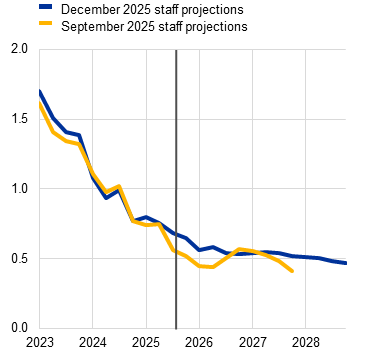
Labour productivity growth is expected to be slightly stronger in 2026 and 2027 than previously projected and to continue its cyclical recovery in 2028 (Chart 6). It declined in the third quarter of 2025, having been heavily influenced by volatility in Irish GDP data over the recent period. By contrast, productivity growth in the rest of the euro area picked up in the third quarter of 2025 and is expected to increase slightly over the projection horizon, reflecting an expected recovery from the unusually low growth recorded after the pandemic. Compared with the September projections, labour productivity growth has been revised up somewhat over the projection horizon reflecting the upward revisions to GDP growth.
Chart 6
Labour productivity per person employed
(annual percentage changes)
Note: The vertical line indicates the start of the current projection horizon.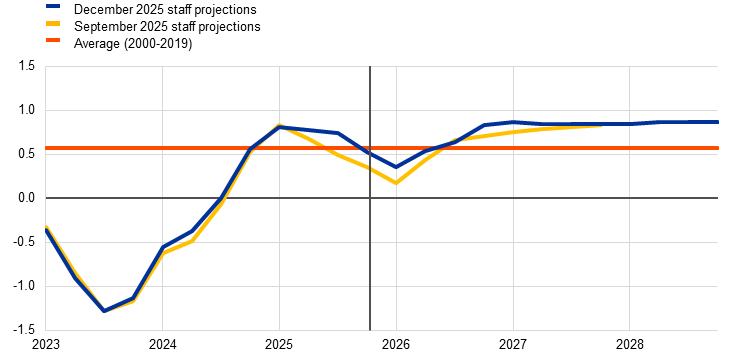
After tightening slightly in 2025, the euro area fiscal stance is projected to loosen in 2026 and then to tighten again in 2027 and 2028 (Table 4).[10] The tightening in 2025 was mostly due to discretionary revenue measures, including increases in social security contributions and, to a lesser extent, increases in indirect and direct taxes.[11] These increases were partly compensated by continued growth in public spending. In 2026 the fiscal stance is projected to loosen, mainly on account of higher public investment. This reflects primarily large defence and infrastructure spending in Germany (over 2026-28) and, to some extent, NGEU-funded investment growth in Spain, among other countries. In 2027 the tightening of the NGEU-adjusted fiscal stance is explained by non-discretionary factors, while in terms of discretionary fiscal policy measures, consolidation in many countries (among other factors, following the expiry of NGEU financing) is seen to be offset by stimulus, mostly in Germany. In addition, NGEU-funded spending that has been deferred to 2027 in some countries is seen to mitigate the tightening of the fiscal stance in that year. In 2028 the euro area fiscal stance is expected to continue tightening. However, the slight tightening of discretionary fiscal policy measures (amounting to just below 0.1 percentage points of GDP) masks cross-country heterogeneity, as a strong loosening of the fiscal stance, particularly in Germany, compensates for a tightening in other countries.
Table 4
Fiscal outlook for the euro area
(percentage of GDP; revisions in percentage points)
|
|
December 2025 |
Revisions vs |
||||||
|---|---|---|---|---|---|---|---|---|
|
2024 |
2025 |
2026 |
2027 |
2028 |
2025 |
2026 |
2027 |
|
|
Fiscal stance1) |
0.9 |
0.1 |
-0.3 |
0.2 |
0.2 |
0.0 |
-0.1 |
-0.1 |
|
General government budget balance |
-3.1 |
-3.0 |
-3.3 |
-3.5 |
-3.4 |
-0.1 |
-0.1 |
-0.1 |
|
Structural budget balance2) |
-3.0 |
-3.0 |
-3.3 |
-3.5 |
-3.5 |
-0.1 |
-0.2 |
-0.2 |
|
General government gross debt |
86.6 |
87.3 |
88.1 |
88.6 |
89.2 |
-0.2 |
-0.6 |
-0.8 |
Notes: Revisions are based on unrounded figures. To avoid large discrepancies, especially in respect of debt ratios, revisions are calculated for the euro area aggregate excluding Bulgaria.
1) The fiscal stance is measured as the change in the cyclically adjusted primary balance net of government support to the financial sector. The figures shown are also adjusted for paid and expected grants under the Next Generation EU (NGEU) programme, which do not have an impact on the economy on the revenue side. A negative (positive) figure implies a loosening (tightening) of the fiscal stance.
2) The structural budget balance is calculated as the government balance net of transitory effects of the economic cycle (or the cyclically adjusted primary balance, referenced above, plus interest payments) and net of measures classified under the European System of Central Banks definition as temporary.
Compared with the September projections, the fiscal stance is seen to be somewhat looser, mainly on account of additional discretionary measures in 2027. The revisions to the fiscal stance over 2025-27 amount to a cumulative loosening of 0.2 percentage points of GDP, primarily driven by higher investment in 2027. At the country level, additional loosening in Germany (mainly related to defence investment over 2026-27) and higher government investment, especially in Italy and to a lesser extent in Spain, are only partly offset by stronger tightening in France (mostly from increases in direct taxes and social security contributions) and other countries.
The budget deficit and debt ratios remain on an upward path (Table 4). After an expected slight decline in 2025, the euro area budget deficit is projected to increase rather sharply in 2026 and 2027, and then to moderate only slightly in 2028 to stand at 3.4% of GDP. This increase reflects rising interest payments (from 1.9% of GDP in 2024 to 2.3% in 2028), which are seen to be only marginally offset by positive macroeconomic effects. The euro area debt-to-GDP ratio is set on an increasing path, as the continuous primary deficits and positive deficit-debt adjustments outweigh the favourable, though diminishing, effects of interest rate-growth differentials. Compared with the September projections, the path of the budget balance has been revised slightly down over 2025-27, mainly on account of the cyclically adjusted primary balance which more than compensates for the slight improvement in the cyclical component. The path of government debt has been revised down, reflecting base effects from statistical revisions to data for 2024 and more favourable interest rate-growth differentials.
Box 2
The macroeconomic impact of climate change policies in the euro area
In the context of the EU’s targets for reducing greenhouse gas emissions, a range of climate change mitigation measures are being introduced at the EU level, including the so-called “Fit for 55” package, as well as measures at the national level. This box discusses the macroeconomic impact of these measures included in the projections baseline, and presents scenario analysis of some aspects of climate policy measures.
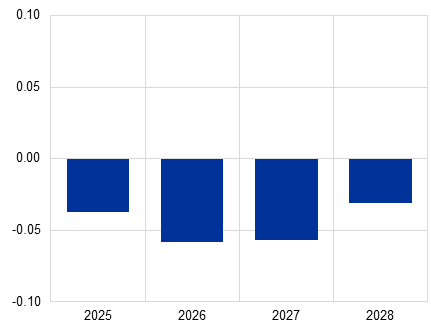
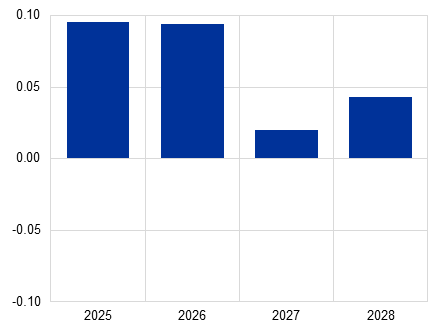
The impact of national green fiscal measures on growth and inflation included in the projections baseline is small.[12] A fiscal measure is classified as a green measure if it has a positive impact in terms of climate change prevention or adaptation. The green measures considered in this box reflect national governments’ decisions on discretionary fiscal measures that have a relevant impact on the macroeconomic outlook. However, they are only a subset of the overall level of countries’ green revenues and expenditures, and they do not reflect the impact of regulatory policies. A large part of the green discretionary fiscal measures included in the projections baseline are expenditures financed by NGEU funds. Overall, their effects on inflation are expected to be positive, while they are expected to have a negative impact on GDP – in each case amounting to less than 0.1 percentage points (Chart A). The largest estimated impact on inflation is seen for 2025 and 2026 and stems from revenue measures with a direct impact on prices, such as increases in national carbon prices and pollution-based indirect taxes.
Chart A
Impact of national discretionary green fiscal policy measures on the projections baseline
|
a) GDP growth |
b) Headline inflation |
|
(percentage points) |
(percentage points) |
 |
 |
The December 2025 projections baseline also includes a 0.2 percentage point impact on euro area headline inflation in 2028, which is associated with the start of the new Emissions Trading System (ETS2) (Chart B, blue bar). ETS2 covers mainly road transport fuels and heating of buildings and will operate separately from the existing Emissions Trading Scheme (ETS1). Companies selling fossil fuels in the sectors subject to ETS2 will be required to surrender emission allowances for the related CO2 emissions. In the same way as for ETS1, these emission allowances will be traded and their price should be determined by the market. However, whereas for ETS1 the staff projections are conditioned on technical assumptions for the price of allowances based on futures prices (Box 1), for ETS2 no reliable price signals from trade in emission allowances or financial derivatives are available so far. Although surrounded by considerable uncertainty, the assumption embedded in the December 2025 projections is that ETS2 will be introduced at a price of €46 per tonne of CO2 (tCO2), which follows the assumption made by the European Commission in its Autumn 2025 Economic Forecast.[13] Whereas previous staff projections assumed ETS2 would start in 2027 in line with EU legislation, both the Council of EU Environment Ministers and the European Parliament have expressed a preference to postpone its introduction by one year. Therefore, the December 2025 projections assume a start date of January 2028.[14]
Chart B
Impact of ETS2 on euro area headline inflation in 2028: baseline and scenario analysis
(percentage points)
Notes: In the projections baseline, country-specific assumptions have been made regarding the speed and timing of the pass-through to consumer prices, largely in line with historical patterns, and regarding the way ETS2 is introduced in each country. The scenario analysis assumes full and immediate pass-through, and a replacement of national carbon pricing schemes by ETS2 in all countries.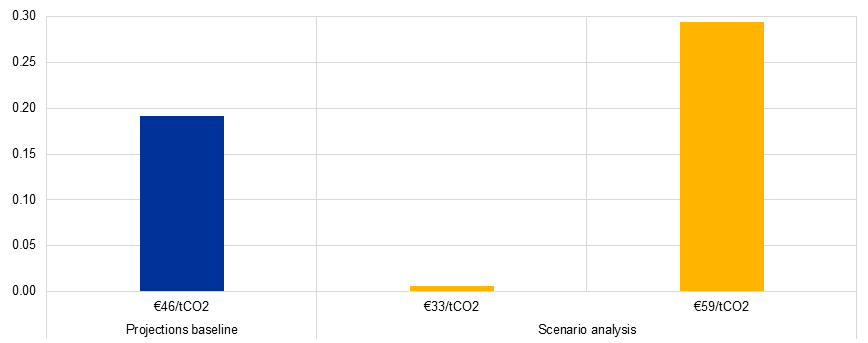
Some countries have already set national carbon prices for the sectors covered by ETS2, and the speed of the pass-through to consumer prices is expected to differ across countries, leading to heterogeneous impacts on inflation. The impact is expected to be generally larger in countries with no existing carbon pricing scheme for sectors subject to ETS2, or where the existing national scheme is expected to remain in addition to ETS2. No impact is expected in 2028 in countries where the national price is higher than the assumed ETS2 price and where the national scheme is expected to remain in place instead of ETS2. Conversely, a negative impact is expected in 2028 in countries where the national price is higher than the assumed ETS2 price, but it is expected to be replaced by ETS2 (i.e. the carbon price in the affected sectors would effectively drop to the ETS2 price level).[15] The impact on inflation also depends on the speed of the pass-through to consumer prices. While the pass-through is expected to be fast in the case of transport fuels, gas prices typically adjust at different speeds across countries depending on factors such as the average length of supply contracts.[16]
Under alternative assumptions regarding the ETS2 price, we estimate a plausible range of direct ETS2 impacts of between 0.0 and 0.3 percentage points on euro area inflation for 2028, highlighting the uncertainty related to the price assumption (Chart B, yellow bars).[17] The simulated range includes assumptions on the price of ETS2 allowances of €33/tCO2 and €59/tCO2 for 2028 (see also footnote 17). This price range was chosen based on the assumption that the European Commission’s recent announcements on mitigating some of the uncertainties and potential price volatility related to the start of ETS2 imply a lower risk of very high prices in the initial years, while some market research previously suggested a higher price.[18] In addition, the scenario analysis includes the simplifying assumption that the national carbon pricing schemes will be fully replaced by ETS2, which effectively means that the carbon price in affected sectors could drop upon the introduction of ETS2 if the national price is above the ETS2 price. This also explains the negligible impact found in the scenario based on a price of €33/tCO2, which includes a negative impact in countries where the national carbon price in 2027 is above that level.
Further sources of uncertainty surrounding the impact of ETS2 include the transition from national carbon pricing schemes to ETS2, the pass-through to consumer prices and the impact of potential compensatory measures. For example, countries may use revenues from ETS2 as compensation measures, which may have a dampening effect on the inflationary impacts stemming from ETS2, particularly if they are used to lower energy taxes (e.g. on electricity). The pass-through of ETS2 may also not be in line with the historical pass-through underlying the baseline impact assessment. On the national level, the way ETS2 replaces the national carbon pricing scheme may vary. In addition, as highlighted in the European Commission’s Autumn 2025 Economic Forecast, ETS2 is expected, over time, to protect the EU economy from fossil fuel price shocks by incentivising a reduction in reliance on fossil fuels. In this respect, and given that ETS2 is an important cornerstone for achieving the EU’s climate targets, any further delay in its introduction could pose significant risks to the attainment of these targets.
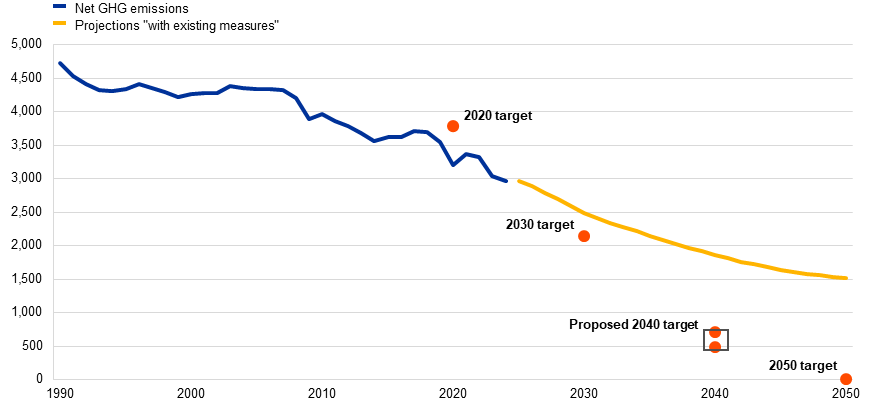
Taking a broader perspective, the full raft of climate policy measures already implemented seems to be insufficient to meet the EU’s 2030 emission reduction target under the Fit for 55 agenda. The decline in economic activity during the COVID-19 pandemic led to a sharp fall in emissions to levels below the 2020 EU greenhouse gas (GHG) emissions targets, while the reduction in energy usage during the recent energy crisis led to a further sharp decline in 2023 (Chart C, panel a). In addition, there has been a decline in energy intensity in all euro area countries since the early 1990s, although considerable cross-country heterogeneity remains (Chart C, panel b). Despite these improvements, the most recent emission projections by EU Member States show that, with the climate measures currently implemented, the EU’s emissions targets for 2030 and beyond will not be met.[19] Additional measures are therefore likely to be required.
Chart C
Greenhouse gas emissions
a) EU greenhouse gas emissions and targets
(million tonnes of carbon dioxide equivalent)
b) Euro area greenhouse gas emissions intensity of GDP
(tonnes of carbon dioxide equivalent emissions per €1,000 of GDP)
Sources: European Environment Agency and ECB staff calculations. 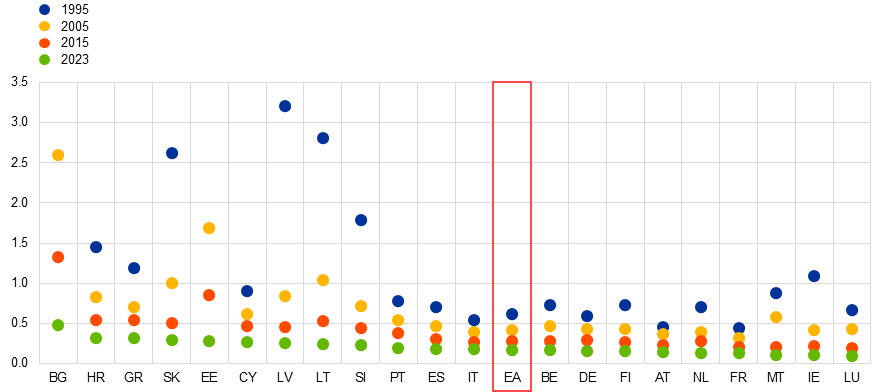
Notes: The data used for panel a) are taken from Member States’ greenhouse gas (GHG) emission projections 2025 that include existing measures. The 2040 target refers to the European Commission’s proposal for a net 90% reduction from 1990 levels, with a domestic target of 85% and up to 5% of international carbon credits, which is being negotiated with the European Council and European Parliament. In panel b), the countries are ordered by emission intensity in 2023; 1995 values are not shown for Bulgaria (5.0) and Estonia (7.0).
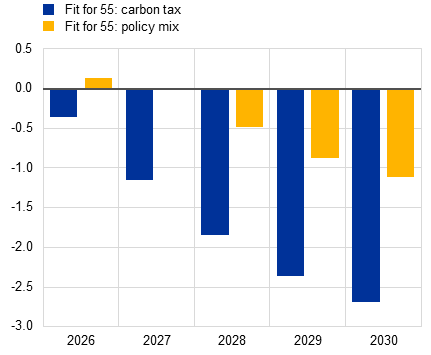
We assess the potential impact of additional measures needed to meet the EU’s 2030 emission reduction target, using the New Area-Wide Model (NAWM-E).[20] Over and above the emission reductions that are expected to be achieved with existing measures, an additional 13% reduction by 2030 is needed to meet the EU’s Fit for 55 target.[21] Our scenarios are based on the effective carbon price as calculated by the OECD. We consider two scenarios: (i) the Fit for 55 carbon tax scenario, which satisfies the 2030 emission reduction target only through higher carbon prices, and (ii) the Fit for 55 policy mix scenario, which considers a mix of carbon taxes and non-carbon tax elements to enable the 2030 emission reduction target to be met. The second scenario also meets secondary targets on the clean energy share and energy consumption, proxied through a 1.2% increase in clean energy total factor productivity.[22]
Meeting the EU’s 2030 emissions target could imply upside risks to inflation and downside risks to growth, especially if the target is mainly achieved through carbon pricing. If the 2030 target is met solely through higher carbon taxes (Chart D, blue bars), the impact on inflation peaks at 0.4 percentage points above the baseline in 2027 and remains elevated until 2030, while real GDP falls by 2.5% by 2030. However, the higher tax alone cannot deliver the Fit for 55 targets for energy use and clean energy. In the Fit for 55 policy mix scenario (Chart D, yellow bars), HICP inflation increases by almost 0.3 percentage points above the baseline in 2027 and 2028, while GDP falls by 1% by 2030. Higher clean energy productivity increases the clean energy share and greater substitution elasticities reduce energy consumption, in line with EU targets. The overall higher clean energy efficiency allows the carbon tax to be left at lower levels, mitigating both the fall in GDP and the higher inflation.
Chart D
Impact of climate policy scenarios on real GDP and inflation
|
Real GDP |
Headline inflation |
|
(percentages) |
(percentage points) |
 |
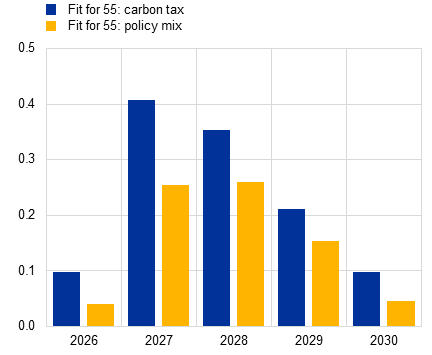 |
Notes: Dynamic responses are based on New Area-Wide Model (NAWM-E) simulations, with existing measures up to 2024 remaining unchanged. The impacts are reported relative to the projections baseline. Simulations start in 2026 and assume that economic agents have perfect foresight regarding the expected future path of the carbon tax and any productivity changes.[23] The policy rate remains constant throughout the projection horizon.
The results of the model-based climate policy scenarios suggest upside risks to the projections baseline for inflation and downside risks for growth, with the impacts depending on the type of transition measure implemented. It should be noted that the model does not explicitly incorporate regulatory elements of the Fit for 55 package, including their economic impacts, so the targets might be met through different policy combinations not captured in this analysis, with varying implications for growth and inflation. The scenarios are also not specific about the type of carbon taxes needed, as the increases in effective carbon rates in the scenarios could reflect higher carbon pricing not just in the sectors covered by the EU emissions trading schemes (including higher ETS2 prices), but also in other sectors.
Headline inflation is projected to decrease from 2.1% in 2025 to 1.9% in 2026 and 1.8% in 2027, before rising to 2.0% in 2028, mainly owing to energy inflation (Chart 7). Headline inflation is expected to drop from 2.1% in the last quarter of 2025 to 1.9% in the first quarter of 2026, largely owing to energy base effects. The lower average rate for headline inflation for the whole of 2026 reflects a decline in HICPX inflation owing to a moderation in services inflation, alongside weaker food inflation. The further decrease in headline inflation in 2027 mirrors a continued decline in HICPX inflation, which is partly offset by a reversion of energy inflation to zero rates, while food inflation should remain unchanged. The rise in headline inflation to 2.0% in 2028 is mainly attributed to a significant increase in energy inflation, driven by climate transition-related fiscal measures and, in particular, the introduction of the new Emissions Trading System (ETS2), which pushes headline inflation up by 0.2 percentage points (see Box 2). Excluding the impact of ETS2, headline inflation would remain slightly below target (1.9%) in 2028 also, as energy inflation dynamics excluding ETS2 remain very low by historical standards.[24] HICP inflation excluding energy is expected to decline gradually and to settle at 2.0% in both 2027 and 2028, while HICPX inflation is expected to stabilise at or close to 2.0% in the medium term.
Chart 7
Euro area HICP inflation
(annual percentage changes)
Notes: The vertical line indicates the start of the current projection horizon. The ranges shown around the central projections provide a measure of the degree of uncertainty and are symmetric by construction. The ranges are based on past projection errors, after adjustment for outliers. The bands, from darkest to lightest, depict the 30%, 60% and 90% probabilities that the outcome of HICP inflation will fall within the respective intervals. For more information, see the box entitled “Illustrating the uncertainty surrounding the projections” in the March 2023 ECB staff macroeconomic projections for the euro area.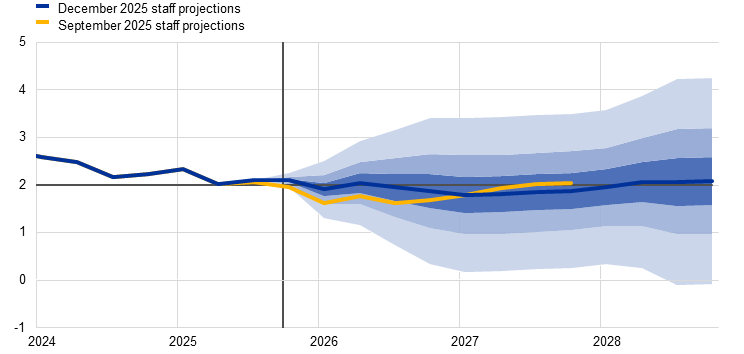
Chart 8
Euro area HICP inflation – decomposition into the main components
(annual percentage changes, percentage points)
Note: The vertical line indicates the start of the current projection horizon.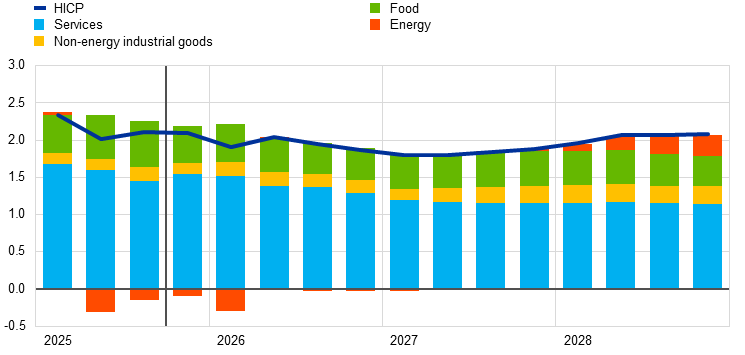
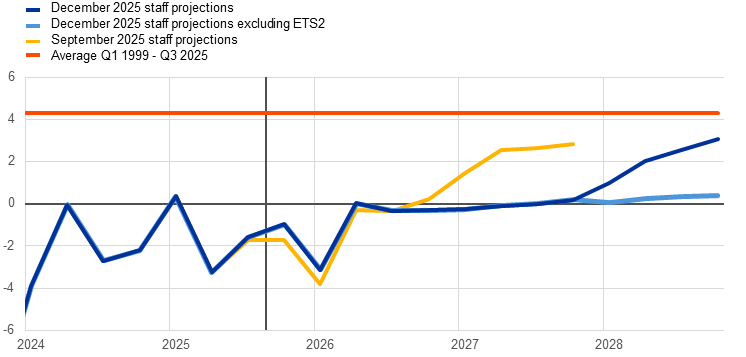
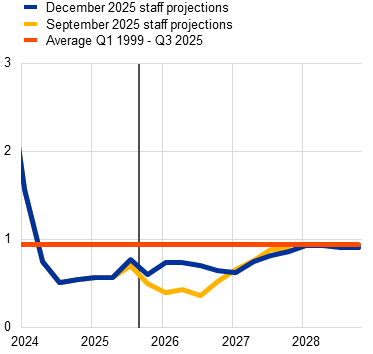
Energy inflation is projected to remain subdued until late 2027, before rising notably in 2028 with the introduction of ETS2 (Chart 9, panel a). The sharp decline in energy inflation during the first quarter of 2026 is largely attributed to a pronounced downward base effect in the transport fuels component. In addition, an expected reduction in electricity prices in Germany, driven by lower network fees, is seen as contributing to the decline in energy prices seen in early 2026. As these effects fade, energy inflation will remain subdued, in line with rather flat energy price assumptions (see Box 1). The noticeable rise in energy inflation to 2.2% in 2028 is seen to be driven mainly by the implementation of the EU Fit for 55 package, particularly the new ETS2 for the heating of buildings and for transport fuels, which is estimated to contribute 1.9 percentage points to energy inflation in 2028 (see Box 2).
Chart 9
Outlook for HICP energy and food inflation
a) HICP energy
(annual percentage changes)
b) HICP food
(annual percentage changes)
Note: The vertical line indicates the start of the current projection horizon.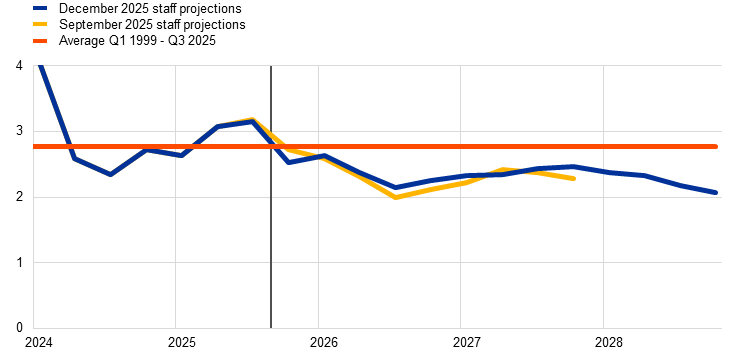
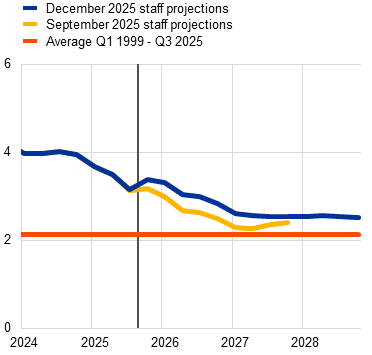
Food inflation is projected to continue to decline noticeably in the short term, as commodity prices ease and weather-related factors fade, and to remain at moderate levels throughout 2028 (Chart 9, panel b). Specifically, in 2025 food inflation is expected to fall from 3.2% in the third quarter to 2.5% in the fourth quarter, reflecting the recent easing in certain food commodity prices, such as cocoa and coffee, as well as the fading impact of adverse weather conditions observed over the summer. The continued moderation through late 2026 is attributed to lower euro area food commodity prices and downward base effects from the strong price increases in mid-2025. On average, food inflation is projected to stand at 2.4% in 2026-27, before easing further to 2.2% in 2028. These levels are below the long-term average and in line with benign assumptions for energy and food commodity prices.
Table 5
Price and cost developments for the euro area
(annual percentage changes, revisions in percentage points)
|
|
December 2025 |
Revisions vs September 2025 |
||||||
|---|---|---|---|---|---|---|---|---|
|
2024 |
2025 |
2026 |
2027 |
2028 |
2025 |
2026 |
2027 |
|
|
HICP |
2.4 |
2.1 |
1.9 |
1.8 |
2.0 |
0.0 |
0.2 |
-0.1 |
|
HICP excluding ETS21) |
2.4 |
2.1 |
1.9 |
1.8 |
1.9 |
0.0 |
0.2 |
0.1 |
|
HICP excluding energy |
2.9 |
2.5 |
2.2 |
2.0 |
2.0 |
0.0 |
0.2 |
0.1 |
|
HICP excluding energy and food |
2.8 |
2.4 |
2.2 |
1.9 |
2.0 |
0.0 |
0.3 |
0.1 |
|
HICP excluding energy, food and changes in indirect taxes |
2.8 |
2.4 |
2.2 |
1.9 |
2.0 |
0.1 |
0.3 |
0.1 |
|
HICP non-energy industrial goods |
0.8 |
0.6 |
0.7 |
0.8 |
0.9 |
0.0 |
0.3 |
0.0 |
|
HICP services |
4.0 |
3.4 |
3.0 |
2.6 |
2.5 |
0.0 |
0.3 |
0.3 |
|
HICP energy |
-2.2 |
-1.4 |
-1.0 |
0.0 |
2.2 |
0.2 |
0.1 |
-2.4 |
|
HICP food |
2.9 |
2.8 |
2.4 |
2.4 |
2.2 |
-0.1 |
0.1 |
0.1 |
|
GDP deflator |
3.0 |
2.4 |
2.2 |
2.1 |
2.1 |
0.1 |
0.1 |
0.1 |
|
Import deflator |
-0.5 |
-0.1 |
0.7 |
1.7 |
1.8 |
-0.2 |
0.1 |
0.0 |
|
Compensation per employee |
4.5 |
4.0 |
3.2 |
2.9 |
3.0 |
0.6 |
0.5 |
0.2 |
|
Productivity per employee |
-0.1 |
0.7 |
0.6 |
0.9 |
0.9 |
0.1 |
0.1 |
0.1 |
|
Unit labour costs |
4.6 |
3.3 |
2.6 |
2.0 |
2.1 |
0.5 |
0.4 |
0.1 |
|
Unit profits2) |
-1.1 |
0.7 |
1.4 |
2.2 |
2.3 |
-0.1 |
-0.2 |
0.2 |
Notes: Revisions are calculated using figures rounded to one decimal place. The figures for the GDP and import deflators, unit labour costs, compensation per employee and productivity per employee refer to seasonally and working day-adjusted data. Historical data may differ from the latest Eurostat publications owing to data releases after the cut-off date for the projections. Data are available for downloading, also at quarterly frequency, from the Macroeconomic Projection Database on the ECB’s website.
1) Regarding the impact of ETS2 on the HICP rate in 2028, see footnote 24.
2) Unit profits are defined as gross operating surplus and mixed income (adjusted for the income of the self-employed) per unit of real GDP.
HICPX inflation is expected to decline from 2.4% in 2025 to 2.2% in 2026 and then to stabilise at or close to 2% in the later years of the projection horizon (Chart 10), in line with fading labour cost pressures on services inflation. While HICPX inflation is projected to edge up to 2.4% in the final quarter of 2025 and remain there in the first quarter of 2026, it is expected to moderate to 1.9% by the first quarter of 2027. The initial decline in HICPX inflation is seen to be driven primarily by the slowdown in services inflation, mirroring easing labour cost pressures (Chart 11). The disinflation process in the services component is expected to come to a halt in 2027, in line with a stabilisation in labour cost growth. Non-energy industrial goods inflation is expected to remain subdued in the coming months, supported by the appreciation of the euro, before gradually converging towards its historical average of around 1% by late 2027 and remaining there for the rest of the projection horizon, leading to a small uptick in HICPX inflation in 2028.
Chart 10
Euro area HICP inflation excluding energy and food
(annual percentage changes)
Notes: The vertical line indicates the start of the current projection horizon. The ranges shown around the central projections provide a measure of the degree of uncertainty and are symmetric by construction. The ranges are based on past projection errors, after adjustment for outliers. The bands, from darkest to lightest, depict the 30%, 60% and 90% probabilities that the outcome of HICPX inflation will fall within the respective intervals. For more information, see the box entitled “Illustrating the uncertainty surrounding the projections” in the March 2023 ECB staff macroeconomic projections for the euro area.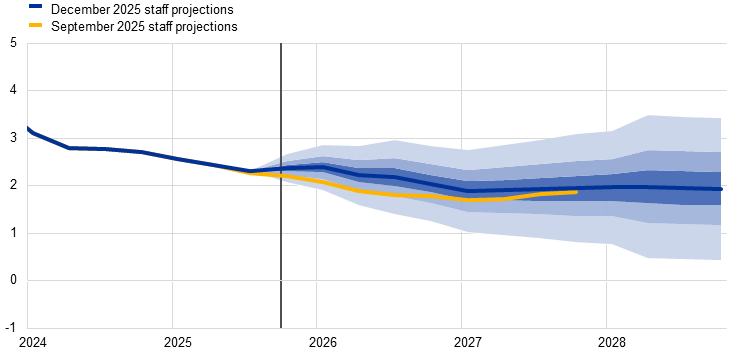
Chart 11
Outlook for HICP non-energy industrial goods and services inflation
|
a) Non-energy industrial goods inflation |
b) Services inflation |
|---|---|
|
(annual percentage changes) |
(annual percentage changes) |
 |
 |
Note: The vertical line indicates the start of the current projection horizon.
The ECB’s monetary policy measures since December 2021 are expected to have, on balance, a notable, although declining, dampening impact on inflation over the projection horizon. Given the much longer lags than in the case of growth, the dampening impact of the tightening phase of monetary policy is estimated to still outweigh the subsequent loosening phase over the full projection horizon.
Compared with the September 2025 projections, the outlook for headline HICP inflation remains unchanged for 2025 and has been revised up by 0.2 percentage points for 2026 and down by 0.1 percentage points for 2027 (Chart 12). HICPX inflation is unchanged for 2025 but has been revised up by 0.3 percentage points for 2026 and 0.1 percentage points for 2027. The unchanged headline inflation rate for 2025 reflects largely stable projections for its main components. For 2026, the upward revision to headline inflation is driven primarily by stronger than expected outcomes for energy, services and non-energy industrial goods inflation. Meanwhile, the downward revision for 2027 is largely attributable to the expected postponement of the ETS2 scheme, although this is partially offset by stronger services inflation, in line with upward revisions to labour cost projections.
Chart 12
Revisions to the inflation projection compared with the September 2025 projections
(percentage points)
Note: The revisions are calculated based on unrounded figures.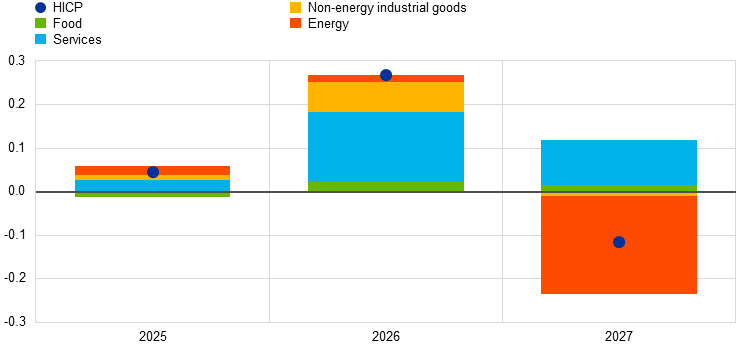
Nominal wage growth is expected to ease further through 2026 and then move sideways over the remainder of the projection horizon. Growth in compensation per employee increased to just over 4% in the third quarter of 2025, which is above the expectations in the September projections. It is projected to moderate as of the last quarter of 2025, largely owing to a lower contribution from wage drift.[25] It is expected to average 4.0% in 2025, before slowing to 3.2% in 2026 and 2.9% in 2027 (Chart 13). In 2028 it is projected to tick up to 3.0%, reflecting a slightly higher contribution from wage drift and also higher social security contributions in Germany, while growth in negotiated wages continues to gradually decline. Real wage growth is projected to decline further and gradually converge towards productivity growth in the latter half of the projection horizon. Compared with the September 2025 projections, growth in compensation per employee has been revised up across the entire projection period – by 0.6 percentage points for 2025, 0.5 percentage points for 2026 and 0.2 percentage points for 2027. In part, this is due to the stronger than expected wage growth in the second and third quarters of 2025. However, the revisions also reflect new information on minimum wage increases and a higher expected impact of minimum wages on aggregate wages compared with the September 2025 projections.
Chart 13
Outlook for wage developments
(annual percentage changes)
Notes: The vertical line indicates the start of the current projection horizon. The data shown refer to compensation per employee.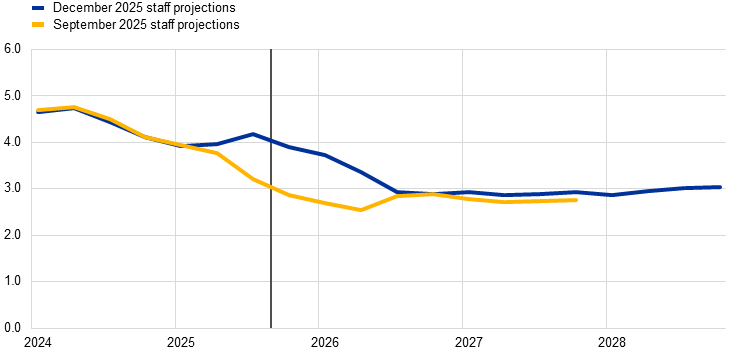
Growth in unit labour costs is projected to decline through 2027, driven by lower wage growth and, to some extent, higher productivity, and then to level off at 2.1% in 2028. Unit labour cost growth ticked up slightly in the third quarter of 2025 and is expected to remain over 3% until early 2026. An easing in the growth of compensation per employee is anticipated to lead to a slowdown in unit labour cost growth throughout 2026. On average, unit labour cost growth is expected to moderate from 3.3% in 2025 to 2.6% in 2026 and 2.0% in 2027, before edging up to 2.1% in 2028, slightly above its long-term average. Compared with the September 2025 projections, unit labour cost growth has been revised up for each year of the horizon owing to stronger wage growth, despite slightly higher productivity.
Domestic price pressures, as measured by the growth of the GDP deflator, are expected to decrease in 2026, on the back of lower growth in unit labour costs, and stabilise just above 2.0% (Chart 14). Despite some volatility in the growth rate of the GDP deflator during 2025, owing to fluctuations in the contribution of unit profits, the annual GDP deflator growth rate is projected to decline from an average of 2.4% in 2025 to 2.2% in 2026 and to stabilise at 2.1% in 2027 and 2028, slightly above its long-term average. As growth in unit labour costs moderates, unit profit growth is expected to increase gradually over the projection horizon, supported by the ongoing economic recovery, initially weak import price growth, strengthening productivity growth and a temporary accounting boost – now delayed until 2028 – stemming from the statistical treatment of ETS2.[26] Compared with the September 2025 projections, GDP deflator growth has been revised up by 0.1 percentage points per year across the projection horizon.
Chart 14
Domestic price pressures
(annual percentage changes, percentage point contributions)
Note: The vertical line indicates the start of the current projection horizon.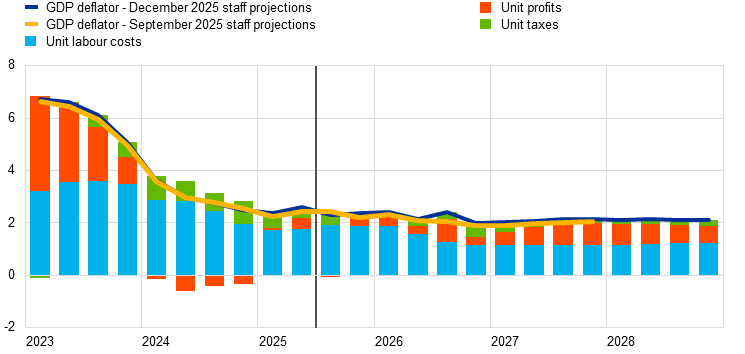
Import price changes should remain slightly negative until early 2026 but return to moderate positive rates thereafter, as the dampening impact of the past appreciation of the euro fades. In annual terms, the growth rate of the import deflator is projected to rise from -0.1% in 2025 to 0.7% in 2026, followed by a stronger increase to 1.7% in 2027 and 1.8% in 2028. In comparison with the September 2025 projections, the downward revision to the profile of import price inflation in 2025 is also due to recent data outcomes and is in line with lower assumptions for energy commodity prices. For 2026, the small upward revision reflects the slightly weaker exchange rate over the projection horizon (see Box 1), while the import price deflator is unrevised for 2027.
6.1 Alternative energy price paths
Alternative paths for energy commodity prices suggest similar risks to inflation on the upside and on the downside. The staff projections are based on the technical assumptions outlined in Box 1. In this sensitivity analysis, alternative downside and upside paths are derived from the 25th and 75th percentiles of the option-implied neutral densities for both oil and gas prices.[27] According to these densities, risks to oil prices are broadly balanced while for gas prices they indicate some upside risks to the technical assumptions (Chart 15), A constant price sensitivity analysis is also carried out for both oil and gas prices. In each case, a synthetic energy price index (a weighted average of the oil and gas price paths) is computed and the impacts are assessed using ECB and Eurosystem macroeconomic models. The average results across these models are shown in Table 6.
Chart 15
Alternative paths for energy price assumptions
a) Oil price assumption
(USD/barrel)
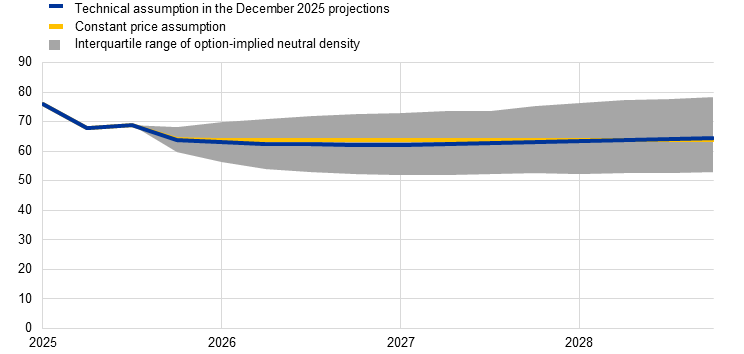
b) Gas price assumption
(EUR/MWh)
Sources: Morningstar and ECB calculations. 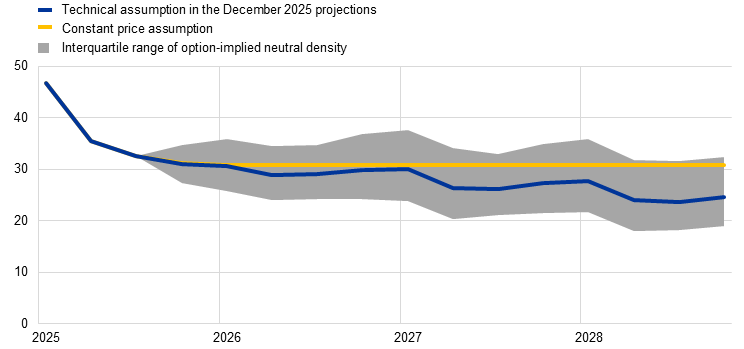
Note: The option-implied densities for gas and oil prices are extracted from 26 November 2025 market quotes for options on ICE Brent crude oil and Dutch TTF natural gas futures with fixed quarterly expiry dates.
Table 6
Alternative energy price paths and their impact on real GDP growth and HICP inflation
|
Path 1: 25th percentile |
Path 2: 75th percentile |
Path 3: constant prices |
||||||||||
|---|---|---|---|---|---|---|---|---|---|---|---|---|
|
2025 |
2026 |
2027 |
2028 |
2025 |
2026 |
2027 |
2028 |
2025 |
2026 |
2027 |
2028 |
|
|
(deviations from baseline levels, percentages) |
||||||||||||
|
Oil prices |
-1.5 |
-13.7 |
-16.6 |
-17.7 |
1.5 |
14.2 |
18.1 |
21.1 |
0.0 |
2.1 |
1.8 |
-0.4 |
|
Gas prices |
-2.5 |
-17.0 |
-21.0 |
-23.1 |
2.5 |
20.0 |
26.9 |
31.7 |
0.0 |
3.9 |
11.8 |
22.9 |
|
Synthetic energy price index |
-1.7 |
-14.3 |
-17.5 |
-18.6 |
1.7 |
15.2 |
19.4 |
22.8 |
0.0 |
2.7 |
5.4 |
7.4 |
|
(deviations from baseline growth rates, percentage points) |
||||||||||||
|
Real GDP growth |
0.0 |
0.0 |
0.1 |
0.1 |
0.0 |
-0.1 |
-0.1 |
-0.1 |
0.0 |
0.0 |
0.0 |
0.0 |
|
HICP inflation |
0.0 |
-0.5 |
-0.5 |
-0.3 |
0.0 |
0.5 |
0.5 |
0.3 |
0.0 |
0.1 |
0.2 |
0.1 |
Notes: In this sensitivity analysis, a synthetic energy price index that combines oil and gas futures prices is used. The 25th and 75th percentiles refer to the option-implied neutral densities for the oil and gas prices on 26 November 2025. The constant oil and gas prices take the respective value as at the same date. The macroeconomic impacts are reported as averages of a number of ECB and Eurosystem staff macroeconomic models.
6.2 Alternative exchange rate paths
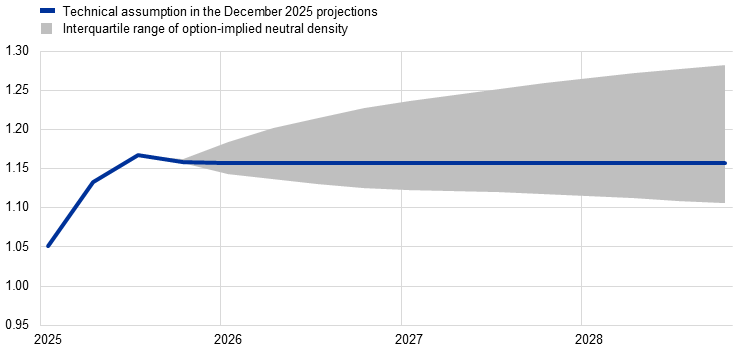
Market-based distributions for the exchange rate are skewed towards a further appreciation of the euro, indicating some downside risks to growth and inflation. The technical assumptions for exchange rates in the baseline projections are held constant over the projection horizon. Alternative downside and upside paths are derived from the 25th and 75th percentiles of option-implied neutral densities for the USD/EUR exchange rate on 26 November 2025, which was tilted towards a modest appreciation of the euro (Chart 16). The impacts of these alternative paths are assessed using ECB and Eurosystem staff macroeconomic models. Table 7 shows the impacts on output growth and inflation averaged across these models.
Chart 16
Alternative paths for the USD/EUR exchange rate
Sources: Bloomberg, ECB staff calculations.
Notes: An increase implies an appreciation of the euro. The 25th and 75th percentiles refer to the option-implied densities for the USD/EUR exchange rate on 26 November 2025.
Table 7
Impact on real GDP growth and HICP inflation
|
Path 1: 25th percentile |
Path 2: 75th percentile |
|||||||
|---|---|---|---|---|---|---|---|---|
|
2025 |
2026 |
2027 |
2028 |
2025 |
2026 |
2027 |
2028 |
|
|
USD/EUR exchange rate |
1.13 |
1.13 |
1.12 |
1.11 |
1.13 |
1.21 |
1.25 |
1.27 |
|
USD/EUR exchange rate (% deviation from baseline) |
0.0 |
-2.0 |
-3.2 |
-4.0 |
0.1 |
4.3 |
7.8 |
10.1 |
|
(deviations from baseline growth rates, percentage points) |
||||||||
|
Real GDP growth |
0.0 |
0.1 |
0.1 |
0.1 |
0.0 |
-0.1 |
-0.2 |
-0.2 |
|
HICP inflation |
0.0 |
0.1 |
0.1 |
0.1 |
0.0 |
-0.1 |
-0.2 |
-0.3 |
Sources: Bloomberg and ECB staff calculations.
Notes: An increase implies an appreciation of the euro. The 25th and 75th percentiles refer to the option-implied neutral densities for the USD/EUR exchange rate on 26 November 2025. The macroeconomic impacts are reported as averages of a number of ECB and Eurosystem staff macroeconomic models.
Box 3
Comparison with forecasts by other institutions and the private sector
The December 2025 Eurosystem staff projections are generally within the range of other forecasts for GDP growth and HICP inflation. The staff projection for growth lies at the top of the range of forecasts from other institutions and surveys of private sector forecasters for 2025, which is likely due to the inclusion of the most recent data releases, and remains within the range for the rest of the projection horizon. For inflation, the Eurosystem staff projection is within the narrow range of other available forecasts for 2026, while it is below the range for 2027 and in line with it for 2028. Part of the gap for 2027, however, may relate to the recent announcement of the postponement of the EU Emissions Trading System 2 (ETS2) from 2027 to 2028.[28] The Eurosystem staff projection for HICPX inflation is slightly above the other forecasts for 2026 and slightly below them for 2027.
Table
Comparison of recent forecasts for euro area real GDP growth, HICP inflation and HICP inflation excluding energy and food
(annual percentage changes)
|
|
Date of release |
Real GDP growth |
HICP inflation |
HICP inflation excl. energy and food |
||||||||||
|---|---|---|---|---|---|---|---|---|---|---|---|---|---|---|
|
2025 |
2026 |
2027 |
2028 |
2025 |
2026 |
2027 |
2028 |
2025 |
2026 |
2027 |
2028 |
|||
|
Eurosystem staff projections |
December 2025 |
1.4 |
1.2 |
1.4 |
1.4 |
2.1 |
1.9 |
1.8 |
2.0 |
2.4 |
2.2 |
1.9 |
2.0 |
|
|
OECD |
December 2025 |
1.3 |
1.2 |
1.4 |
– |
2.1 |
1.9 |
2.0 |
– |
2.4 |
2.1 |
2.0 |
– |
|
|
Consensus Economics |
December 2025 |
1.4 |
1.1 |
1.4 |
1.4 |
2.1 |
1.8 |
2.0 |
2.0 |
2.4 |
2.0 |
– |
– |
|
|
European Commission |
November 2025 |
1.3 |
1.2 |
1.4 |
– |
2.1 |
1.9 |
2.0 |
– |
2.4 |
2.1 |
2.0 |
– |
|
|
Survey of Professional Forecasters |
October 2025 |
1.2 |
1.1 |
1.4 |
– |
2.1 |
1.8 |
2.0 |
– |
2.4 |
2.0 |
2.0 |
– |
|
|
International Monetary Fund |
October 2025 |
1.2 |
1.1 |
1.4 |
1.3 |
2.1 |
1.9 |
2.1 |
2.0 |
– |
– |
– |
– |
|
Sources: OECD Economic Outlook, 4 December 2025; Consensus Economics Forecasts, 11 December 2025 (data for 2027 and 2028 are taken from the October 2025 survey); European Commission Autumn 2025 Economic Forecast, 17 November 2025; ECB Survey of Professional Forecasters, 31 October 2025; and IMF World Economic Outlook, 14 October 2025.
Notes: These forecasts are not directly comparable with one another or with the Eurosystem staff macroeconomic projections, as they were finalised at different points in time. Additionally, they use different methods to derive assumptions for fiscal, financial and external variables, including oil, gas and other commodity prices. The Eurosystem staff macroeconomic projections report working day-adjusted annual growth rates for real GDP, whereas the European Commission and the International Monetary Fund report annual growth rates that are not adjusted for the number of working days per annum. Other forecasts do not specify whether they report working day-adjusted or non-working day-adjusted data.
© European Central Bank, 2025
Postal address 60640 Frankfurt am Main, Germany
Telephone +49 69 1344 0
Website www.ecb.europa.eu
All rights reserved. Reproduction for educational and non-commercial purposes is permitted provided that the source is acknowledged.
For specific terminology please refer to the ECB glossary (available in English only).
PDF ISBN 978-92-899-7336-6, ISSN 2529-4687, doi:10.2866/3955478, QB-01-25-149-EN-N
HTML ISBN 978-92-899-7335-9, ISSN 2529-4687, doi:10.2866/1069761, QB-01-25-149-EN-Q