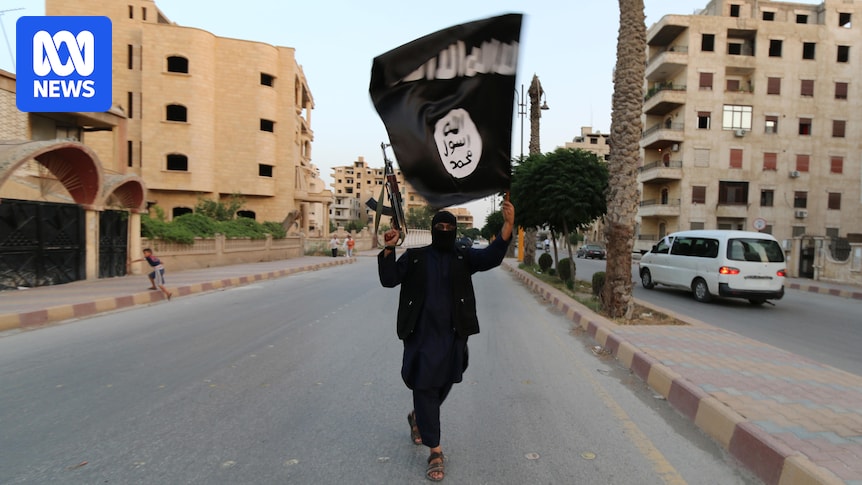
Introduction
The global burden of obesity has reached unprecedented levels, emerging as a leading public health concern across both high-income and developing countries. Defined as a body mass index (BMI) of 30 kg/m² or more, obesity has witnessed a dramatic rise in prevalence, increasing from 4.6% in 1980 to approximately 14.0% by 2019.1,2 Data from the World Health Organization (WHO) indicate that, as of 2016, over 1.9 billion adults were overweight, with more than 650 million classified as obese.3 This alarming trend spans all age groups and demographics, implicating a constellation of sociocultural, behavioral, and nutritional determinants. Central to this phenomenon is a global dietary transition marked by increased intake of energy-dense, highly processed foods high in fats and sugars.4,5 The expansion of global food supply chains and urbanization has led to greater availability of such diets, contributing to poor dietary quality and the replacement of traditional food practices.6–8 This nutrition transition, especially in low- and middle-income countries, further accelerates the rise of obesity.
In parallel, rising levels of sedentary behavior—driven by urban infrastructure, occupational patterns, and digital media consumption—have exacerbated this nutritional shift. Prolonged screen time, reduced physical activity, and limited engagement in outdoor recreational activities are increasingly prevalent among youth and adults, thereby promoting positive energy balance and fat accumulation.4,9 The COVID-19 pandemic has intensified these patterns, with lockdowns and school closures contributing to increased obesity rates among children and adolescents.10,11 Additionally, cultural shifts, including the Westernization of diets and the decline of home-cooked meals, have weakened protective dietary traditions and normalized fast-food consumption, particularly among younger populations.5,12 Together, these converging factors underscore the need for integrative public health strategies that address both nutritional and behavioral determinants of obesity.
Beyond the epidemiological concerns, the biological mechanisms underlying obesity have gained increasing research attention. One critical dimension of obesity pathogenesis is the expansion of white adipose tissue (WAT) and its intricate link with mitochondrial dysfunction. WAT is the primary energy storage tissue, and its pathological expansion under chronic positive energy balance disrupts cellular homeostasis and metabolic regulation. Excessive WAT accumulation impairs adipose tissue function through hypoxia, inflammation, and lipotoxicity, resulting in systemic insulin resistance and metabolic complications, such as type 2 diabetes and cardiovascular diseases.13,14 WAT expansion leads to the hypertrophy of adipocytes, which compromises mitochondrial bioenergetics, reduces oxidative capacity, and impairs fatty acid oxidation, culminating in the generation of reactive lipid species and the deterioration of metabolic health.15–17
Furthermore, local hypoxia due to adipocyte enlargement contributes to inflammatory cascades. As adipocytes outgrow their vascular supply, hypoxic conditions upregulate pro-inflammatory cytokines such as tumor necrosis factor-alpha (TNF-α) and interleukin-6 (IL-6), which in turn exacerbate mitochondrial dysfunction and fuel a state of chronic low-grade inflammation.18–21 These effects are further magnified by impaired vascular function and endothelial stress, which compromise nutrient and oxygen delivery to adipose tissue.22 The adipokine profile also undergoes significant changes in obesity, with reduced adiponectin and dysregulated leptin secretion contributing to impaired mitochondrial biogenesis and energy imbalance.14,23 Downregulation of energy-sensing pathways such as AMP-activated protein kinase (AMPK) is frequently observed in obesity, further compromising mitochondrial integrity and promoting metabolic inflexibility.15
The transformation of WAT into beige adipose tissue (BeAT)—a process known as browning—represents a promising adaptive mechanism for enhancing mitochondrial function and increasing thermogenic capacity. However, obesity-related inflammation and cellular dysfunction can suppress this adaptive response, leading to compromised energy dissipation and exacerbated fat accumulation.24,25 These mechanistic insights emphasize the centrality of mitochondrial health in WAT to overall metabolic homeostasis and underscore the need for interventions targeting both adipose remodeling and mitochondrial integrity.
A growing body of evidence implicates the gut microbiota in the pathogenesis of obesity, particularly via alterations in microbial diversity and the Firmicutes/Bacteroidetes (F/B) ratio. The gut microbiome is intricately linked with nutrient metabolism, energy extraction, immune modulation, and endocrine signaling. Numerous studies have shown that individuals with obesity tend to have a higher F/B ratio compared to lean individuals, suggesting that a Firmicutes-dominant microbiota enhances the capacity for energy extraction from the diet.26–29 Firmicutes ferment dietary fibers into short-chain fatty acids (SCFAs), which can serve as additional energy substrates, thereby increasing caloric absorption and promoting adiposity.30,31 In contrast, Bacteroidetes are associated with more efficient carbohydrate metabolism and a leaner phenotype.32,33 Thus, a skewed F/B ratio contributes to the positive energy balance characteristic of obesity.34
In addition to energy metabolism, the gut microbiota modulates systemic inflammation and immune responses. The overrepresentation of Firmicutes has been associated with increased inflammatory cytokine expression and compromised intestinal barrier integrity, which further exacerbate insulin resistance and metabolic syndrome.35–37 The microbiota’s influence extends to hormonal regulation of appetite and satiety, affecting leptin and ghrelin pathways.38,39 Notably, interventions that modulate the gut microbiota—including prebiotic and probiotic supplementation—have demonstrated potential in improving the F/B ratio and metabolic outcomes.40–43 These findings highlight the gut microbiota as both a contributor to and a potential target for obesity treatment.
In response to these multifactorial contributors to obesity, several dietary and pharmacological interventions have been explored for their potential to restore metabolic balance. Among them, brown rice, commercial meal replacements, and thiazolidinediones (TZDs) have garnered significant attention. Brown rice retains the bran and germ layers, offering a higher content of fiber, antioxidants, and essential nutrients compared to refined white rice. Its fiber content improves gastrointestinal motility, supports the proliferation of beneficial gut bacteria, and enhances satiety, contributing to reduced caloric intake and improved glycemic control.44–46 Brown rice consumption has also been linked to a decreased risk of type 2 diabetes, supporting its inclusion in metabolic disease prevention strategies.
Meal replacements represent another strategic intervention, offering controlled caloric intake with optimized macronutrient composition. Clinical trials have demonstrated that meal replacements lead to greater weight loss and improved adherence compared to conventional diets.47,48 High-protein, low-glycemic formulations have been shown to enhance insulin sensitivity and reduce fat mass while preserving lean body mass.49,50 Furthermore, their standardized composition facilitates long-term dietary compliance and supports structured nutritional interventions.51,52
Pharmacologically, TZDs such as pioglitazone exert beneficial effects on insulin sensitivity and adipose tissue function by activating peroxisome proliferator-activated receptor gamma (PPARγ). This activation promotes adipocyte differentiation, enhances glucose uptake, and redistributes fat from visceral to subcutaneous depots, reducing obesity-related metabolic risks.53–55 Notably, TZDs have also been implicated in modulating gut microbiota composition, potentially contributing to their metabolic effects.47,56
In light of these findings, the present study aims to comparatively evaluate the effects of brown rice, meal replacements, and TZDs on mitochondrial function in white adipose tissue and gut microbiota composition, particularly the Firmicutes/Bacteroidetes ratio, within a high-fat, high-fructose (HFHF) diet-induced obesity model in rats. By integrating assessments of dietary impact, mitochondrial dynamics, and microbial profiles, this study seeks to illuminate potential mechanisms through which these interventions mitigate obesity-related metabolic disturbances. This integrative approach may provide a foundation for targeted therapeutic strategies addressing both systemic metabolism and gut-adipose axis interactions in the context of obesity.
Materials and Methods
Study Design
This study employed a post-test only controlled group design within a laboratory in vivo experimental framework. The protocol was conducted at the Laboratory for Animal Model Development, Faculty of Medicine, Universitas Brawijaya. Ethical clearance was obtained from the Ethics Committee of the Faculty of Health Sciences, Universitas Brawijaya (Reference No: 2020/UN10.F17.10.4/TU/2023), and all procedures were carried out in accordance with internationally accepted standards for animal care and use approved by the Animal Lab Medicine Faculty – Universitas Brawijaya follows the 3Rs, the Five Freedoms, and Indonesian Government Regulation No. 95/2012 on veterinary public health and animal welfare.
The selected design was appropriate for investigating the comparative effects of dietary and pharmacological interventions in an obesity model, as it enables outcome analysis after the intervention period without prior baseline measurements, reducing potential handling-induced stress on the animals. The use of Sprague Dawley rats is well-established in metabolic studies due to their susceptibility to diet-induced obesity and their physiological similarity to human metabolic responses.13,15
Animal and Grouping
Twenty male Sprague Dawley rats aged 8–14 weeks, with initial body weights ranging between 150 and 250 g, were selected. All animals were confirmed to be in healthy condition prior to allocation. Randomization was performed using simple random sampling to assign animals into five groups (n = 4 per group), based on dietary regimen as follows:
- Group 1, control: Standard AIN-93M diet;
- Group 2, HFHF: high-fat, high-fructose;
- Group 3, HFHF with BR: HFHF diet supplemented with brown rice;
- Group 4, HFHF with TZD: HFHF diet with thiazolidinedione (TZD) treatment;
- Group 5, HFHF with MR: HFHF diet supplemented with commercial meal replacement.
Rats exhibiting signs of illness—such as dull fur, hair loss, abnormal behavior, or unusual discharge from bodily orifices—were excluded from the study. Animals that died before completion of the intervention period were also excluded from analysis.
Interventions
Obesity was induced in Groups 2 to 5 over a 14-week period by administering a high-fat, high-fructose (HFHF) diet formulated to mimic human dietary patterns associated with obesity and metabolic syndrome in humans.26,40 The specific nutrient compositions of the standard, HFHF, and intervention diets administered to each group are detailed in Table 1. The control group received a standard AIN-93M diet.
Table 1 The Compositions of the Diet per 100 g
|
At the end of the 14th week, animals from Groups 1 (Control) and 2 (HFHF) were euthanized to serve as pre-intervention benchmarks. White adipose tissue (WAT) was collected for mitochondrial analysis, and fecal samples were obtained for gut microbiota profiling.
During the subsequent 12 weeks (weeks 15–26), animals in Groups 3 to 5 received dietary or pharmacological interventions:
- Brown Rice (BR): Substitution of HFHF carbohydrate sources with whole grain brown rice.
- TZD Treatment: Daily administration of TZD at an appropriate dosage determined from prior literature.54
- Meal Replacement (MR): Inclusion of a high-fiber, balanced macronutrient meal replacement product.
Throughout the study, daily food and fluid intakes were recorded by measuring feed and fructose solution leftovers. Body weight was measured weekly. The Lee Index (g/cm³), a recognized obesity indicator in rodent models, was calculated using the formula: Lee Index = [Body weight^(1/3) / Nasal-anal length (cm)] × 1000. This index was employed to confirm obesity status (>300 g/cm³).17
Mitochondrial Analysis
Mitochondrial content and distribution in WAT were assessed using Bio Tracker™ 488 Green Mitochondria Dye, which selectively stains active mitochondria based on membrane potential. Tissue samples were fixed and stained following manufacturer protocols, then visualized using fluorescence microscopy.
Images were captured at magnifications optimized to distinguish mitochondrial morphology and density. Quantification was performed via image analysis software to evaluate fluorescence intensity, a proxy for mitochondrial membrane potential and activity.18 This analysis was conducted at the Central Biomedical Laboratory, Faculty of Medicine, Universitas Brawijaya.
Gut Microbiota Analysis
At week 26, fecal samples (1–2 g) were collected from each rat and stored at −40°C until analysis. Microbial DNA was extracted, and quantitative Real-Time Polymerase Chain Reaction (RT-PCR) was conducted targeting 16S rRNA genes specific to Firmicutes and Bacteroidetes. Total DNA was extracted from fecal samples using QIAamp Fast DNA Stool Mini Kit (QIAGEN, Germany) according to the manufacturer’s protocol. Quantification of the Firmicutes and Bacteroidetes phyla was performed using quantitative PCR (qPCR) targeting specific 16S rRNA gene regions.
The following primer sequences were used:
Forward: 5’-TGAAACTYAAAGGAATTGACG-3’
Reverse: 5’-ACCATGCACCACCTGTC-3’
Forward: 5’-GGARCATGTGGTTTAATTCGATGAT-3’
Reverse: 5’-AGCTGACGACAACCATGCAG-3’
The qPCR reactions were carried out in a total volume of 20 µL, consisting of 10 µL SYBR Green Master Mix (Applied Biosystems), 0.5 µL of each primer (10 µM), 2 µL of DNA template, and nuclease-free water. Amplification was conducted using a StepOnePlus™ Real-Time PCR System (Applied Biosystems) with the following thermal cycling conditions:Initial denaturation at 95°C for 10 minutes, followed by 40 cycles of denaturation at 95°C for 15 seconds, annealing at 60°C for 30 seconds, and extension at 72°C for 30 seconds.
Standard curves were generated using serial dilutions of cloned 16S rRNA gene fragments to ensure accurate quantification. All reactions were performed in triplicate. Negative controls (no template) were included to monitor contamination, and melting curve analysis was performed to confirm the specificity of amplification.
The Firmicutes/Bacteroidetes (F/B) ratio was calculated using the relative quantification method: 2^−ΔCt, where ΔCt represents the difference in threshold cycles between the two bacterial groups. This ratio served as a proxy for gut microbiota composition, given its established association with obesity phenotypes.27,37
Statistical Analysis
Data were expressed as mean ± standard deviation (SD). Continuous variables such as body weight, energy intake, fiber intake, and mitochondrial counts were tested for normality and homogeneity using Shapiro–Wilk and Levene’s tests, respectively. Where necessary, variables were log-transformed to meet assumptions for parametric testing.
One-way Analysis of Variance (ANOVA) followed by Tukey’s post-hoc test was used to assess group differences. Linear regression was employed to examine associations between fiber intake, F/B ratio, and mitochondrial count. Statistical significance was set at p < 0.05. All analyses were performed using IBM SPSS Statistics for Windows, Version 26.
This methodology enables robust exploration of the interconnections between diet, gut microbiota, and mitochondrial dynamics in a controlled obesity model. By integrating morphological, microbial, and biochemical assessments, the study provides a comprehensive framework for evaluating the mechanistic effects of nutritional and pharmacological interventions on metabolic health.
Results
Body Weight Trends Across Experimental Groups
Longitudinal assessment of body weight demonstrated significant variations among the five experimental groups (Figure 1A). At baseline (week 1), no statistically significant differences in body weight were observed among the groups (p > 0.05). However, by week 14, after administration of the high-fat high-fructose (HFHF) diet in Groups 2–5, there was a pronounced increase in body weight, most notably in the HFHF group, indicating successful obesity induction.
![]() |
Figure 1 Impact of different treatments on anthropometry over time in obese rat models. (A) Body weight (g); (B) Lee index (g/cm³). Data are expressed as mean ± SD for body weight and Lee index at weeks 1, 14, and 26 (n = 4 per group). Error bars represent standard deviation (SD). Data points labeled with different symbols (*, #, &) indicate significant differences between groups (p < 0.05) according to one-way ANOVA followed by Tukey’s post hoc test.
|
The HFHF group exhibited the steepest weight gain throughout the study, culminating in the highest body weight at week 26 (p < 0.05). Conversely, the control group displayed a gradual and modest increase in body weight over the same period, reflecting a typical growth pattern in the absence of dietary perturbation. The brown rice (BR) group experienced a notable deceleration in weight gain between weeks 14 and 26, suggesting a mitigating effect of BR on HFHF-induced weight gain. The TZD group followed a similar trajectory, with weight gain plateauing after week 14, indicating that TZD might attenuate further weight accrual post-obesity induction. Meanwhile, the meal replacement (MR) group showed intermediate results: although body weight remained elevated at week 26 compared to the control group, it was significantly lower than the HFHF group, suggesting a partial protective effect.
LEE Index Variation as an Obesity Indicator
The LEE index, a morphological obesity marker equivalent to the BMI in rodents, also varied significantly across groups (p < 0.05) (Figure 1B). At week 14, both the HFHF and BR groups exceeded the obesity threshold (>300 g/cm³), confirming successful model induction. However, by week 26, the BR group exhibited a substantial reduction in LEE index, falling below the obesity threshold, which underscores its potential in reversing diet-induced obesity. Similarly, the TZD group experienced a notable drop in LEE index post-intervention, indicating its effectiveness in modulating adiposity.
In contrast, the HFHF group continued to show an upward trajectory in LEE index, reaching its peak at week 26, thereby confirming that the HFHF diet perpetuates obesity. Notably, its LEE index was significantly higher than that of the control group, further supporting the obesogenic effect of the HFHF diet. The MR group maintained a relatively stable LEE index around the obesity threshold, suggesting moderate efficacy in obesity prevention. The control group consistently maintained LEE index values below the threshold across all time points, as expected.
Post hoc comparisons indicated that the BR group had a significantly higher LEE index than both the TZD and MR groups, as denoted by distinct annotation letters in the figure.
Dietary Intake Characteristics
Dietary intake parameters are summarized in Table 2. Energy intake was highest in the HFHF group (126.01 ± 23.71 kcal/day), followed by BR (87.85 ± 10.37 kcal/day), whereas the MR and control groups had the lowest energy intake (p < 0.001). These findings reflect the high caloric density of the HFHF diet and the moderate intake regulation associated with fiber-enriched interventions such as BR and MR. The TZD group also demonstrated relatively low energy intake, possibly reflecting pharmacologically induced appetite suppression.
![]() |
Table 2 Dietary Intake Characteristics Across Treatment Groups During Intervention (Mean ± SD, n = 4)
|
Protein intake was significantly elevated in the BR group due to its dietary formulation, whereas the MR group exhibited a slightly lower protein intake. The HFHF group had moderate protein intake, while the TZD and control groups displayed the lowest values.
Regarding fat intake, the HFHF group again showed the highest values, consistent with the high lipid content of the diet. The BR group also had substantial fat intake, while the TZD and MR groups showed significantly reduced fat consumption. Carbohydrate intake mirrored energy intake trends, with HFHF rats consuming the highest levels, while MR rats showed minimal carbohydrate intake. Fiber intake differed significantly among groups (p < 0.001), with BR (6.36 ± 1.01 g/day) and MR (5.74 ± 0.22 g/day) exhibiting the highest values (Figure 2). The TZD group had the lowest fiber intake, potentially limiting its microbiota-modulating capacity.
![]() |
Figure 2 Fiber across different groups. Data are expressed as mean fiber intake ± SD (n = 4 per group). Bars labeled with different symbols (*, #) indicate significant differences between groups (p < 0.05) according to one-way ANOVA followed by Tukey’s post hoc test.
|
Firmicutes/Bacteroidetes (F/B) Ratio
Gut microbiota composition, assessed through the Firmicutes/Bacteroidetes (F/B) ratio, revealed significant group differences (Figure 3). The HFHF group exhibited the highest F/B ratio (~1.9), indicative of microbial dysbiosis commonly associated with obesity.26,27 The TZD group also showed a moderately elevated ratio (~1.5), whereas the BR and MR groups had ratios approximating 1.3 and 1.0, respectively, suggesting a more balanced microbiota and healthier metabolic state.
![]() |
Figure 3 Firmicutes/Bacteroidetes (F/B) ratio across treatment groups. Higher ratios indicate increased Firmicutes dominance, typically associated with greater energy extraction efficiency. F/B ratio is a unitless value derived from the relative abundance of each phylum.
|
The control group maintained a near-equal balance (F/B ≈ 1.0), consistent with a normobiotic gut profile. These findings support previous reports that a higher F/B ratio is associated with increased energy harvest and fat accumulation, while a lower ratio correlates with improved metabolic outcomes.32,35
Mitochondrial Abundance in Adipose Tissue
Quantitative analysis of mitochondrial abundance in white adipose tissue (WAT) showed significant differences among groups (Figure 4). The MR group displayed the highest mitochondrial count (~60 units), followed by the TZD group (~50 units). These results suggest a marked enhancement of mitochondrial biogenesis or activity in these intervention groups.
![]() |
Figure 4 The Number of mitochondria representative Mitotracker staining of WAT in the (A) control group; (B) HFHF group; (C) brown rice group; (D) TZD group; (E) MR group; (F) The number of mitochondria across different groups. Data are expressed as mean number of mitochondria ± SD (n = 4 per group).
|
The BR and control groups had intermediate values (~30–40 units), while the HFHF group had the lowest mitochondrial count (~30 units), consistent with diet-induced mitochondrial impairment. These findings reinforce existing literature on the deleterious effects of high-fat diets on mitochondrial function and the potential for dietary and pharmacological strategies to restore mitochondrial health.13,18 Despite these observable differences, statistical analysis showed that the variations were not statistically significant (p > 0.05), indicating that the differences in mean mitochondrial counts did not reach the threshold for significance.
Correlation Between Fiber Intake and F/B Ratio
Correlation analysis (Figure 5) revealed a positive association between dietary fiber intake and a more balanced F/B ratio across groups. The BR and MR groups, which had the highest fiber intake, also exhibited the most favorable microbiota compositions. In contrast, the HFHF and TZD groups, with lower fiber intakes, maintained elevated F/B ratios, indicating an association between dietary fiber and microbial homeostasis.33,37
![]() |
Figure 5 Linear regression analysis of the relationship between fiber intake and Firmicutes/Bacteroidetes ratio across all groups. R² values demonstrate the strength of association.
|
Combined Effects of Diet on Mitochondria and Microbiota
A 3D bubble plot (Figure 6) integrated fiber intake, F/B ratio, and mitochondrial count. The BR and MR groups clustered in the quadrant representing high fiber intake, balanced microbiota, and elevated mitochondrial abundance. The TZD group showed relatively high mitochondrial activity despite lower fiber intake, suggesting that TZD may exert direct pharmacological effects on mitochondrial biogenesis and metabolic signaling pathways.47,53 In contrast, the HFHF group was isolated in the quadrant indicating low fiber intake, high F/B ratio, and diminished mitochondrial content, reinforcing the detrimental effect of this dietary pattern on metabolic health.
![]() |
Figure 6 3D bubble plot illustrating the relationship among fiber intake (x-axis), F/B ratio (y-axis), and mitochondrial count (bubble size) across all groups. Bubble size reflects mean mitochondrial abundance.
|
Together, these findings demonstrate that interventions with BR and MR exert beneficial metabolic effects by modulating gut microbiota composition and enhancing mitochondrial activity. TZD, while effective in improving mitochondrial outcomes, was less impactful on microbiota composition, likely due to its lower fiber content. This multidimensional analysis highlights the interdependent roles of diet, gut microbiota, and mitochondrial function in the context of obesity and provides insight into the mechanistic efficacy of these interventions.
Discussion
The present study evaluated the comparative efficacy of brown rice (BR), thiazolidinediones (TZDs), and commercial meal replacements (MRs) in modulating obesity-related outcomes in an HFHF-induced rat model. The discussion herein integrates experimental findings with relevant literature to interpret observed physiological, biochemical, and microbiological changes, while highlighting the implications and limitations of the study.
The HFHF diet successfully induced obesity, evidenced by significant weight gain, elevated Lee Index values, and adverse metabolic alterations, corroborating earlier studies where excessive fructose intake disrupted hypothalamic satiety signaling by reducing leptin sensitivity and decreasing expression of anorexigenic peptides60. As expected, this diet promoted hyperphagia, triglyceride accumulation, and adipocyte hypertrophy, supporting previous findings linking high-fructose diets to WAT expansion, insulin resistance, and hepatic steatosis.13,17
The Lee Index served as a reliable indicator of obesity severity, with values >300 g/cm^3 observed in HFHF-fed rats by week 14, aligning with thresholds established for rodent obesity classification15. In contrast, interventions involving BR and TZD effectively reduced the Lee Index below this critical threshold, demonstrating their potential to reverse obesity phenotypes despite initial weight gains. MRs also showed a stabilizing effect, albeit less pronounced.
Analysis of nutrient intake revealed the highest caloric and fat consumption in the HFHF group, while BR and MR groups, rich in fiber, demonstrated moderated energy intake and improved metabolic indices. The high fiber content in BR (43.6 g/100 g) and MR (49.7 g/100 g) likely contributed to satiety, reduced energy intake, and modulated lipid metabolism, consistent with prior evidence on dietary fiber’s role in weight management.57
Dietary fiber’s fermentation into short-chain fatty acids (SCFAs) plays a crucial role in host metabolism. SCFAs such as acetate and butyrate not only serve as energy sources but also regulate gut barrier integrity and immune function.35 In the current study, the BR and MR groups exhibited improved gut microbial profiles and mitochondrial abundance, suggesting SCFA-mediated metabolic benefits. Notably, these groups had lower Firmicutes/Bacteroidetes (F/B) ratios and higher mitochondrial counts, indicating gut eubiosis and enhanced energy metabolism.
The F/B ratio, often used as a marker of gut dysbiosis, was significantly elevated in the HFHF group (~1.9), consistent with findings that associate higher F/B ratios with obesity and increased energy harvest.26,27 BR and MR interventions normalized this ratio (~1.3 and 1.0, respectively), demonstrating dietary fiber’s capacity to restore microbial balance and reduce obesity risk. These results align with prior studies where high-fiber diets were linked to increased Bacteroidetes abundance and reduced adiposity.58
Mitochondrial quantification further elucidated intervention effects. The HFHF group exhibited the lowest mitochondrial count in WAT, reflecting impaired mitochondrial biogenesis likely due to lipotoxicity, inflammation, and hypoxia.14,19 Conversely, the MR group showed the highest mitochondrial abundance (~60 units), followed by TZD and BR groups, implicating these interventions in mitochondrial restoration. This observation echoes the findings of Pollicino (2023), who highlighted the Mediterranean diet’s capacity to reduce mitochondrial ROS and improve respiration.59 Furthermore, although Mitotracker-based staining reflects mitochondrial abundance and membrane potential, it does not directly assess mitochondrial bioenergetics. Future studies should incorporate functional assays such as ATP production, mtDNA copy number, and oxidative phosphorylation to enhance mechanistic insight.
TZDs, specifically PPAR-γ agonists like rosiglitazone, have been shown to induce browning of WAT and enhance mitochondrial function by upregulating UCP1 and PRDM16 expression.53 However, their limited effect on the F/B ratio suggests that while TZDs improve cellular metabolism, they lack direct influence on microbial ecology. Additionally, the dose-dependent risks associated with TZDs, including fluid retention, heart failure, and mitochondrial toxicity, underscore the importance of cautious administration.60,61
In contrast, BR and MR exhibited a dual mechanism—modulating both gut microbiota and mitochondrial biogenesis—without the adverse effects observed in pharmacological approaches. Gamma-oryzanol, a bioactive component of BR, has been implicated in metabolic regulation through hypothalamic and hepatic pathways, although not primarily via microbiota modulation.62,63
The 3D bubble plot visualization integrated dietary fiber, microbiota composition, and mitochondrial count, demonstrating that high-fiber groups (BR and MR) clustered within the quadrant representing favorable metabolic outcomes. This multi-parametric representation reinforces the synergistic role of diet in regulating host-microbiota-mitochondria interactions, a concept supported by Colangeli (2023), who demonstrated that gut microbiota regulates mitochondrial function and energy expenditure.64
Moreover, findings in this study align with previous reports suggesting that Firmicutes abundance is enhanced by high-fat intake, leading to increased LPS production and inflammatory signaling.65 The association between microbiota-driven inflammation and metabolic dysfunction has been extensively reviewed, with cytokine-mediated mitochondrial inhibition and apoptosis contributing to obesity pathology.20,21
Despite its relevance, this study has several limitations that warrant consideration. The small sample size (n = 4/group), although aligned with exploratory preclinical models, may limit statistical power and increase the risk of Type I and II errors. Future research should incorporate power calculations and larger cohorts. Mechanistic interpretations regarding SCFA-mediated benefits, mitochondrial biogenesis, and hypothalamic regulation have been revised as hypotheses, given the absence of direct markers such as SCFA levels, UCP1 expression, or AMPK/PGC-1α signaling. Additionally, reliance on the Firmicutes/Bacteroidetes (F/B) ratio as the sole microbiota marker is acknowledged as a limitation. Broader microbiome analyses, including diversity indices and taxonomic resolution, are recommended in future studies. We also recognize that the intervention diets were not isocaloric, which may confound interpretations of mitochondrial and microbial changes. However, ad libitum feeding was intentionally applied to simulate real-world overnutrition. Lastly, while the findings are promising, recommendations for clinical trials have been reframed to emphasize the need for further mechanistic and preclinical validation prior to translation into human studies.
In conclusion, this research underscores the potential of dietary strategies—particularly those high in fiber—to ameliorate obesity by restoring gut microbiota balance and mitochondrial function. These findings support the integration of nutritional interventions into obesity management protocols and emphasize the importance of holistic approaches targeting both host metabolism and microbial ecology. Further studies exploring the mechanistic underpinnings and clinical translation of these findings are warranted to enhance therapeutic precision in metabolic disease management.
Conclusion
This study provides compelling evidence that dietary interventions using brown rice (BR) and meal replacements (MR), as well as pharmacological treatment with thiazolidinediones (TZDs), exert distinct yet overlapping effects in ameliorating diet-induced obesity in a rodent model. The high-fat, high-fructose (HFHF) diet effectively induced obesity, as indicated by increased body weight, elevated Lee Index, disrupted gut microbiota composition, and reduced mitochondrial abundance in white adipose tissue (WAT). Each intervention produced differential impacts on these metabolic parameters.
Among the key findings, BR and MR significantly improved gut microbiota balance, as reflected by more favorable Firmicutes/Bacteroidetes (F/B) ratios, and promoted higher mitochondrial counts in WAT, suggesting enhanced cellular energy metabolism. These effects are likely attributable to the high dietary fiber content and associated short-chain fatty acid production, which modulate both microbial ecology and host metabolic signaling pathways. BR also demonstrated unique benefits, potentially mediated by bioactive compounds such as γ-oryzanol.
TZD treatment, while effective in improving mitochondrial abundance and reversing obesity markers, exhibited a more limited impact on gut microbiota composition, indicating that its metabolic benefits may be primarily mediated through PPARγ activation and mitochondrial biogenesis rather than modulation of gut flora. Nonetheless, its role in promoting the browning of WAT and enhancing oxidative capacity is notable.
These findings underscore the interrelated roles of diet, gut microbiota, and mitochondrial function in the development and management of obesity. The integration of microbiota and mitochondrial metrics into obesity research enhances our understanding of the mechanistic pathways underlying metabolic health and supports the development of targeted, non-pharmacological interventions.
Importantly, this study contributes to the growing literature advocating for dietary strategies—particularly those rich in whole grains and fiber—as sustainable and safe approaches to managing obesity and its complications. It also highlights the potential complementary role of pharmacotherapy when dietary modifications alone are insufficient.
Future research should expand on these findings by employing larger sample sizes, comprehensive microbial and metabolomic profiling, and mechanistic studies exploring host-microbe-mitochondria interactions. Clinical trials translating these preclinical insights into human populations will also be essential for validating the practical applicability of these interventions.
In sum, this study advances the understanding of how specific dietary and pharmacological interventions influence obesity-related metabolic pathways and reinforces the critical role of diet quality in promoting long-term metabolic health.
Abbreviations
ATP, adenosine triphosphate; BAT, brown adipose tissue; BeAT, beige adipose tissue; BR, brown rice; F/B ratio, the Firmicutes-Bacteroidetes ratio; HFHF, high-fat, high-fructose; LPL, lipoprotein lipase; LPS, lipopolysaccharides; MedDiet, Mediterranean diet; MR, meal replacement; mtROS, mitochondrial reactive oxygen species; Myf5−, myogenic factor 5 negative cells; Myf5+, myogenic factor 5 positive cells; PGE2, prostaglandin E2; PPARy, peroxisome proliferator-activated receptor gamma; PRDM16, protein PR-domain containing 16; RT-PCR, real-time polymerase chain reaction; SCFA, short-chain fatty acids; SD, standard deviation; T2DM, type 2 diabetes mellitus; TG, triglycerides; TZD, thiazolidinediones; UCP1, uncoupling protein 1; VLDL, very low-density lipoprotein; WAT, white adipose tissue.
Data Sharing Statement
The raw data including mitochondria raw data, analytical codes, and other collected data that support the findings of this study are available from the corresponding author upon request.
Ethics Approval and Consent to Participate
Ethical approval was granted by the Ethics Committee, Faculty of Health Sciences, Universitas Brawijaya (2020/UN10.F17.10.4/TU/2023).
Acknowledgments
The authors would like to thank the Faculty of Health Sciences, Universitas Brawijaya, for their support in this study.
Author Contributions
All authors made a significant contribution to the work reported, whether that is in the conception, study design, execution, acquisition of data, analysis and interpretation, or in all these areas; took part in drafting, revising or critically reviewing the article; gave final approval of the version to be published; have agreed on the journal to which the article has been submitted; and agree to be accountable for all aspects of the work.
Funding
This research was funded by BPPM funding under contract number 2/UN10.F17.01/PT.01.03.2/2023.
Disclosure
The authors declare that the study was conducted in the absence of any commercial or financial relationships that could be construed as a potential conflict of interest.
References
1. Boutari C, Mantzoros C. A 2022 update on the epidemiology of obesity and a call to action: as its twin COVID-19 pandemic appears to be receding, the obesity and dysmetabolism pandemic continues to rage on. Metabolism. 2022;133:155217. doi:10.1016/j.metabol.2022.155217
2. Jeong S, Jung J, Yang Y, et al. 2023 obesity fact sheet: prevalence of obesity and abdominal obesity in adults, adolescents, and children in Korea from 2012 to 2021. J Obes Metab Syndr. 2024;33(1):27–35. doi:10.7570/jomes24012
3. Kim K, Shin Y. Males with obesity and overweight. J Obes Metab Syndr. 2020;29(1):18–25. doi:10.7570/jomes20008
4. Chooi Y, Ding C, Magkos F. The epidemiology of obesity. Metabolism. 2019;92:6–10. doi:10.1016/j.metabol.2018.09.005
5. Fan H, Zhang X. Prevalence of and trends in the co-existence of obesogenic behaviors in adolescents from 15 countries. Front Pediatr. 2021;9:664828. doi:10.3389/fped.2021.664828
6. Fox A, Feng W, Asal V. What is driving global obesity trends? Globalization or “modernization”? Glob Health. 2019;15(1):32. doi:10.1186/s12992-019-0457-y
7. Chong B, Jayabaskaran J, Kong G, et al. Trends and predictions of malnutrition and obesity in 204 countries and territories: an analysis of the global burden of disease study 2019. EClinicalMedicine. 2023;57:101850. doi:10.1016/j.eclinm.2023.101850
8. Fontes F, Damasceno A, Jessen N, et al. Prevalence of overweight and obesity in Mozambique in 2005 and 2015. Public Health Nutr. 2019;22(17):3118–3126. doi:10.1017/s1368980019002325
9. Sun X, Du T. Trends in weight change patterns across life course among US adults, 1988–2018: population-based study. BMC Public Health. 2023;23(1):17137. doi:10.1186/s12889-023-17137-x
10. Park H, Seo J, Jung H, Lim J. Prevalence and trends in obesity and severe obesity in Korean children and adolescents, 2007–2020: a population-based study. Pediatr Int. 2023;65(1):e15472. doi:10.1111/ped.15472
11. Kang S, Seo M, Kim S, Park M. Changes in lifestyle and obesity during the COVID-19 pandemic in Korean adolescents: based on the Korea youth risk behavior survey 2019 and 2020. Ann Pediatr Endocrinol Metab. 2022;27(4):281–288. doi:10.6065/apem.2142228.114
12. Gilla S, Abida H. Prevalence of overweight and obesity among women older than 20 years. Int J Community Med Public Health. 2019;6(5):2229. doi:10.18203/2394-6040.ijcmph20191849
13. Heinonen S, Jokinen R, Rissanen A, Pietiläinen K. White adipose tissue mitochondrial metabolism in health and in obesity. Obes Rev. 2019;21(2):e12958. doi:10.1111/obr.12958
14. Chait A, Hartigh L. Adipose tissue distribution, inflammation and its metabolic consequences, including diabetes and cardiovascular disease. Front Cardiovasc Med. 2020;7:22. doi:10.3389/fcvm.2020.00022
15. White U. Adipose tissue expansion in obesity, health, and disease. Front Cell Dev Biol. 2023;11:1188844. doi:10.3389/fcell.2023.1188844
16. Wang J, Yang L, Yang L, et al. Adipose dysfunction in adulthood insulin resistance of low-birth weight mice: a proteomics study. Diabetes Metab Syndr Obes. 2022;15:849–862. doi:10.2147/dmso.s353095
17. Longo M, Zatterale F, Naderi J, et al. Adipose tissue dysfunction as determinant of obesity-associated metabolic complications. Int J Mol Sci. 2019;20(9):2358. doi:10.3390/ijms20092358
18. Morigny P, Boucher J, Arner P, Langin D. Lipid and glucose metabolism in white adipocytes: pathways, dysfunction and therapeutics. Nat Rev Endocrinol. 2021;17(5):276–295. doi:10.1038/s41574-021-00471-8
19. Karlina R, Lutter D, Miok V, et al. Identification and characterization of distinct brown adipocyte subtypes in C57BL/6J mice. Life Sci Alliance. 2020;4(1):e202000924. doi:10.26508/lsa.202000924
20. Haroun N, Bennour I, Seipelt E, et al. Maternal vitamin D deficiency in mice increases white adipose tissue inflammation in offspring. Cells. 2022;11(13):2024. doi:10.3390/cells11132024
21. Corrêa L, Heyn G, Magalhães K. The impact of the adipose organ plasticity on inflammation and cancer progression. Cells. 2019;8(7):662. doi:10.3390/cells8070662
22. Phuong T, Walker A, Henson G, et al. Deletion of ROBO4 prevents high‐fat diet‐induced adipose artery and systemic metabolic dysfunction. Microcirculation. 2019;26(5):e12540. doi:10.1111/micc.12540
23. Song A, Dai W, Jang M, et al. Low- and high-thermogenic brown adipocyte subpopulations coexist in murine adipose tissue. J Clin Invest. 2019;130(1):247–257. doi:10.1172/jci129167
24. Ma P, Xiao J, Hou B, et al. Carbonic anhydrase 2 mediates anti-obesity effects of black tea as thermogenic activator. Food Sci Hum Wellness. 2024;13(5):2917–2936. doi:10.26599/fshw.2022.9250236
25. Im H, Park J, Im S, Han J, Kim K, Lee Y. Regulatory roles of g-protein coupled receptors in adipose tissue metabolism and their therapeutic potential. Arch Pharm Res. 2021;44(2):133–145. doi:10.1007/s12272-021-01314-w
26. Kim J, Choi Y, Kwon H, et al. Effect of gut microbiome on minor complications after a colonoscopy. Intest Res. 2021;19(3):341–348. doi:10.5217/ir.2020.00057
27. Duan M, Wang Y, Zhang Q, Zou R, Guo M, Zheng H. Characteristics of gut microbiota in people with obesity. PLoS One. 2021;16(8):e0255446. doi:10.1371/journal.pone.0255446
28. Hassan N, El-Masry S, Shebini S, et al. Gut dysbiosis is linked to metabolic syndrome in obese Egyptian women: potential treatment by probiotics and high fiber diets regimen. Sci Rep. 2024;14(1):xx. doi:10.1038/s41598-024-54285-5
29. Liu R, Shu Y, Qi W, et al. Protective effects of almond oil on streptozotocin-induced diabetic rats via regulating Nrf2/HO-1 pathway and gut microbiota. J Food Qual. 2021;2021:1–14. doi:10.1155/2021/5599219
30. Bao M, Hou K, Xin C, et al. Portulaca oleracea L. extract alleviated type 2 diabetes via modulating the gut microbiota and serum branched‐chain amino acid metabolism. Mol Nutr Food Res. 2022;66(11):e202101030. doi:10.1002/mnfr.202101030
31. Kim J, Kim Y, Oh G, Jung W, Park S. How is gut microbiome of patients with familial adenomatous polyposis different from healthy people? Medicine. 2022;101(49):e32194. doi:10.1097/md.0000000000032194
32. Zeng T, Cao Y, Yin J, et al. Unraveling the gut microbiota of Tibetan chickens: insights into highland adaptation and ecological advantages. Microbiol Spectr. 2024;12(11). doi:10.1128/spectrum.00519-24
33. Sutoyo D, Atmaka D, Sidabutar L. Dietary factors affecting firmicutes and bacteroidetes ratio in solving obesity problem: a literature review. Media Gizi Indones. 2020;15(2):94–109. doi:10.20473/mgi.v15i2.94-109
34. Cui W, Chen F, Sun Z, et al. Catabolism of phenolics from grape peel and its effects on gut microbiota during in vitro colonic fermentation. J Sci Food Agric. 2024;104(12):7182–7193. doi:10.1002/jsfa.13540
35. Pan H, Li Z, Xie J, et al. Berberine influences blood glucose via modulating the gut microbiome in grass carp. Front Microbiol. 2019;10:1066. doi:10.3389/fmicb.2019.01066
36. Wu N, Zhou J, Mo H, et al. The gut microbial signature of gestational diabetes mellitus and the association with diet intervention. Front Cell Infect Microbiol. 2022;11:800865. doi:10.3389/fcimb.2021.800865
37. Cheng Z, Zhang L, Yang L, Chu H. The critical role of gut microbiota in obesity. Front Endocrinol. 2022;13:1025706. doi:10.3389/fendo.2022.1025706
38. Wei X, Zong W, Gao Y, Peng S, Liu K, Zheng Y. Effects of the traditional Chinese medicine Tang Luo Ning on intestinal flora and oxidative stress in diabetic rats. Evid Based Complement Alternat Med. 2020;2020(1):3452625. doi:10.1155/2020/3452625
39. Nehmi‐Filho V, Freitas J, Franco L, et al. Modulation of the gut microbiome and firmicutes phylum reduction by a nutraceutical blend in the obesity mouse model and overweight humans: a double‐blind clinical trial. Food Sci Nutr. 2024;12(4):2436–2454. doi:10.1002/fsn3.3927
40. Mamun M, Rakib A, Mandal M, Singh UP. Impact of a high-fat diet on the gut microbiome: a comprehensive study of microbial and metabolite shifts during obesity. Cells. 2025;14(6):463. doi:10.3390/cells14060463
41. Ali M. Gender dependent gut microbiome in obese Egyptian individuals. Rec Pharm Biomed Sci. 2019;39–42. doi:10.21608/rpbs.2019.10975.1024
42. Caudet J, Trelis M, Cifre S, Soriano J, Rico H, Merino-Torres J. Interplay between intestinal bacterial communities and unicellular parasites in a morbidly obese population: a neglected trinomial. Nutrients. 2022;14(15):3211. doi:10.3390/nu14153211
43. Hankel J, El‐Wahab A, Grone R, et al. Faecal microbiota of dogs offered a vegetarian diet with or without the supplementation of feather meal and either cornmeal, rye or fermented rye: a preliminary study. Microorganisms. 2020;8(9):1363. doi:10.3390/microorganisms8091363
44. Annunziata G, Verde L, Falco A, Colao A, Muscogiuri G, Barrea L. Very low energy ketogenic therapy (vlekt), not only a price matter: a comparison study on average costs of vlekt with fresh foods and replacement meals. Nutrients. 2025;17(3):422. doi:10.3390/nu17030422
45. Chen B, Hong S, Wang Y, Hu Q, Ma D. Efficacy of meal replacement products on weight and glycolipid metabolism management: a 90-day randomized controlled trial in adults with obesity. Nutrients. 2024;16(19):3284. doi:10.3390/nu16193284
46. Klein P, Tyrlíková I, Pirolli N, Barber A, Tyrlík M, Goldman L. Pilot study of “classic” 3:1 ketogenic diet complete meal replacement treatment of obesity-related type 2 diabetes. J Obes Chronic Dis. 2019;3(1):xx. doi:10.17756/jocd.2019-024
47. Kempf K, Röhling M, Banzer W, et al. High-protein, low-glycaemic meal replacement improves physical health-related quality of life in high-risk persons for metabolic syndrome—a subanalysis of the randomised-controlled acoorh trial. Nutrients. 2022;14(15):3161. doi:10.3390/nu14153161
48. Astbury N, Piernas C, Hartmann‐Boyce J, Lapworth S, Aveyard P, Jebb S. A systematic review and meta‐analysis of the effectiveness of meal replacements for weight loss. Obes Rev. 2019;20(4):569–587. doi:10.1111/obr.12816
49. Barrea L, Caprio M, Camajani E, et al. Ketogenic nutritional therapy (kenut)—a multi-step dietary model with meal replacements for the management of obesity and its related metabolic disorders: a consensus statement from the working group of the club of the Italian society of endocrinology (sie)—diet therapies in endocrinology and metabolism. J Endocrinol Invest. 2024;47(3):487–500. doi:10.1007/s40618-023-02258-2
50. Kempf K, Röhling M, Banzer W, et al. High-protein, low-glycaemic meal replacement decreases fasting insulin and inflammation markers—a 12-month subanalysis of the acoorh trial. Nutrients. 2021;13(5):1433. doi:10.3390/nu13051433
51. Chen L, Ludin A, Shahar S, Manaf Z, Tohit N. Meal replacement in dietary management of type-2 diabetes mellitus: a scoping review protocol. Syst Rev. 2020;9(1):xx. doi:10.1186/s13643-020-01517-0
52. Skeldon M, Harris D, Dent R, Shiau J. A comparison of virtual and in person delivery of a full meal replacement program for obesity. Obes Sci Pract. 2023;10(1):e718. doi:10.1002/osp4.718
53. Gómez J, Izaola-Jáuregui O, Primo D, et al. Effect of two meal replacement strategies on cardiovascular risk parameters in advanced age patients with obesity and osteoarthritis. Nutrients. 2020;12(4):976. doi:10.3390/nu12040976
54. Maston G, Franklin J, Gibson A, et al. Attitudes and approaches to use of meal replacement products among healthcare professionals in management of excess weight. Behav Sci. 2020;10(9):136. doi:10.3390/bs10090136
55. Andela S, Burrows T, Baur L, Coyle D, Collins C, Gow M. Efficacy of very low‐energy diet programs for weight loss: a systematic review with meta‐analysis of intervention studies in children and adolescents with obesity. Obes Rev. 2019;20(6):871–882. doi:10.1111/obr.12830
56. Lin T, Guo Y, Gordon C, et al. Association between sugar-sweetened beverage consumption as meal substitutes, workload, and obesity in nurses: a cross-sectional study. Int J Environ Res Public Health. 2019;16(24):4984. doi:10.3390/ijerph16244984
57. Kundi Z, Lee J, Pihlajamäki J, et al. Dietary fiber from oat and rye brans ameliorate western diet–induced body weight gain and hepatic inflammation by modulating short‐chain fatty acids, bile acids, and tryptophan metabolism. Mol Nutr Food Res. 2020;65(1):1900580. doi:10.1002/mnfr.201900580
58. de Wit N, Derrien M, Bosch-Vermeulen H, et al. Saturated fat stimulates obesity and hepatic steatosis and affects gut microbiota composition by an enhanced overflow of dietary fat to the distal intestine. Am J Physiol Liver Physiol. 2012;303:G589–G599. doi:10.1152/ajpgi.00488.2011
59. Pollicino F, Veronese N, Dominguez LJ, Barbagallo M. Mediterranean diet and mitochondria: new findings. Exp Gerontol. 2023;176:112165. doi:10.1016/j.exger.2023.112165
60. He Y, Zhang R, Yu L, et al. Pparγ acetylation in adipocytes exacerbates bat whitening and worsens age-associated metabolic dysfunction. Cells. 2023;12(10):1424. doi:10.3390/cells12101424
61. Riess ML, Elorbany R, Weihrauch D, Stowe DF, Camara AKS. PPARγ-independent side effects of thiazolidinediones on mitochondrial redox state in rat isolated hearts. Cells. 2020;9(1):252. doi:10.3390/cells9010252
62. Kozuka C, Yabiku K, Sunagawa S, et al. Brown rice and its component, gamma-oryzanol, attenuate the preference for high-fat diet by decreasing hypothalamic endoplasmic reticulum stress in mice. Diabetes. 2012;61(12):3084–3093. doi:10.2337/db11-1767
63. Fujiwara H, Hiraoka R, Kawashima Y. The absorption, elimination, distribution and metabolism of triterpene alcohol ferulate (y-Oryzanol). Yakubutsu Ryoho. 1972;5:123–130.
64. Colangeli LE, Escobar Marcillo DI, Simonelli V, et al. The crosstalk between gut microbiota and white adipose tissue mitochondria in obesity. Nutrients. 2023;15(7):1–19.
65. Ley RE, Turnbaugh PJ, Klein S, Gordon JI. Microbial ecology. Human gut microbes associated with obesity. Nature. 2006;444(7122):1022–1023. doi:10.1038/4441022a