Incidence of BAM in patients with IBD
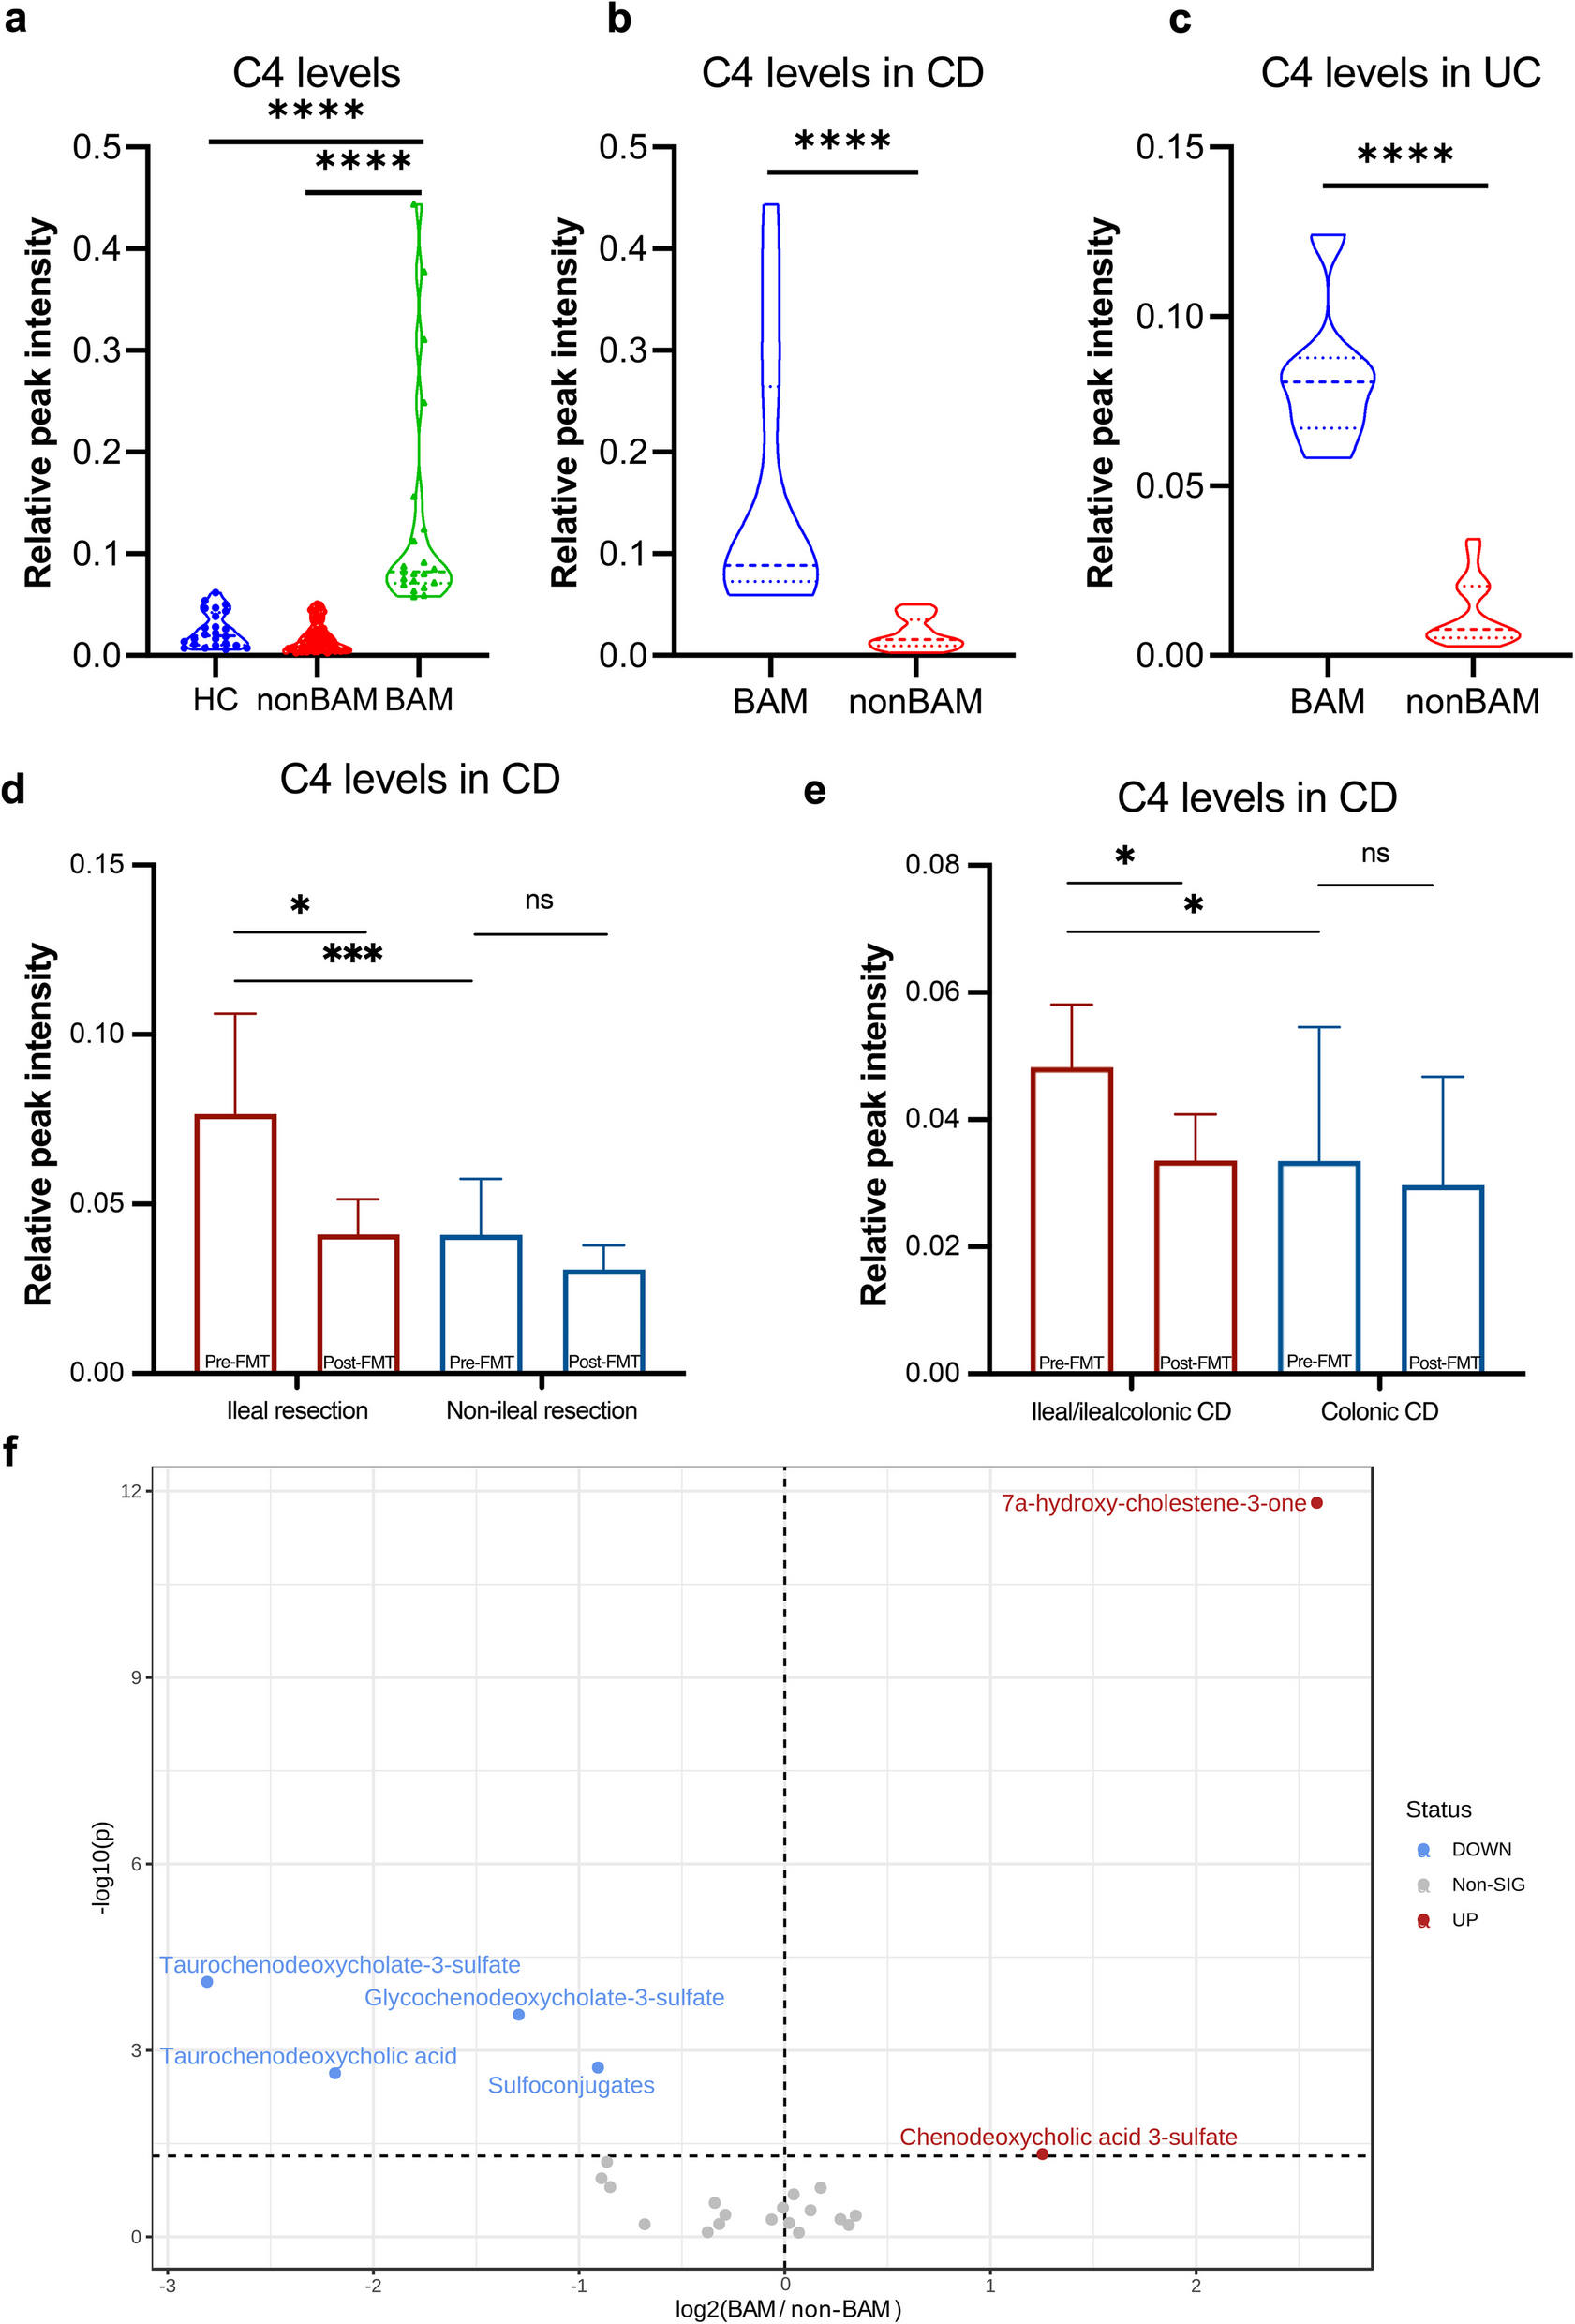
This study included 37 pairs of patients with UC and 69 pairs of patients with CD before and after treatment into the final analysis, along with a healthy control group of 24 individuals without liver and gastrointestinal diseases. The serum level of C4 in patients with IBD considered to be pathologically elevated when exceeding the upper limit of healthy control. As shown in Fig. 1a, 21 patients with IBD were considered as BAM and their serum C4 levels were significantly higher than those of healthy controls and non-BAM group (P < 0.0001, respectively). A total of 20.29% (14/69) of patients with CD and 18.92% (7/37) of patients with UC were diagnosed with BAM using the upper limit of C4 in healthy controls (Fig. 1b, c). Clinical characters such as age, sex, disease activity, and age of diagnosis had no difference between BAM group and non-BAM group (Table 1).
The serum level of C4 in patients with IBD and HC, and metabolites related to bile acid synthesis. The serum level of C4 a between patients with IBD and healthy controls. b in CD patients with or without BAM. c in UC patients with or without BAM. d in CD patients with ileal resection/non-ileal resection. e in CD patients with ileal/ileocolonic lesions. f Differential metabolites related to bile acid synthesis between BAM group and non-BAM group. CD, Crohn’s disease; UC, Ulcerative Colitis; HC, healthy control; BAM, Bile Acid Malabsorption. **** p < 0.0001
Additionally, among the BAM group in patients with CD, the proportion of ileal type and ileocolonic type were as high as 85.71% (12/14), and 50.00% (7/14) of the patients had a history of ileal resection (Table 1), only 12.73% (7/55) of non-BAM patients had a history of ileal resection (P = 0.005). The C4 levels in CD patients with ileal resection were higher than that in non-resection group (P < 0.005, Fig. 1d).
IBD patients with BAM have altered serum metabolome and fecal microbiome
A total of 2012 metabolites classified into 193 metabolic class or super classes based on HMDB taxonomy were identified using untargeted metabolomic analysis. When comparing metabolites related to BA synthesis between BAM group and non-BAM group, C4 and chenodeoxycholic acid 3-sulfate significantly increased in BAM group before FMT, while taurochenodeoxycholate-3-sulfate, glycochenodeoxycholate-3-sulfate, and taurochenodeoxycholic acid (TCDCA) showed a significant decrease trend (Fig. 1f). Concurrently, the level of sulfated BAs catalyzed by enzymes such as sulfotransferase 2A1 (SULT2A1) in the liver, also decreased significantly in BAM group (Fig. 1f).
There were significant differences in serum metabolism between disease groups (BAM and non-BAM) and health group (Additional file 1: Fig. S1a, b) both in the negative mode and positive mode. A total of 238 serum metabolites exhibited significant differences were observed in serum metabolome between BAM and non-BAM groups (Additional file 1: Fig. S1c, d).
PLS-DA analysis in metabolites showed significant differences between disease groups and healthy group (Additional file 1: Fig. S2a), while OPLS-DA analysis showed no difference between disease groups (Additional file 1: Fig. S2b). There were differences in 12 metabolic classes, in which quinone and hydroquinone lipids, retinoids, glycerophosphoethanolamines, oxosteroids and cholestane steroids, and glycerophosphocholines significantly increased in the BAM group (P < 0.05, Additional file 1: Fig. S2c), which belong to the “Lipids and Lipid-like Molecules” superclass. The predominant differential metabolites (55.56%, 75/135) such as glycerophosphocholines and glycerophosphoethanolamines in BAM group belonged to Lipids and Lipid-like Molecules superclass (Additional file 2: Table S1).
The 16S rRNA sequencing data clustered and annotated 875 OTUs, the distribution of OTUs before FMT across different classifications was illustrated in Additional file 1: Fig. S3a (Venn). There were 385 OTUs shared among the BAM, non-BAM, and healthy groups, while 150, 74, and 4 OTUs were uniquely present in healthy group, non-BAM, and BAM groups, respectively. The top 15 genera were displayed in Additional file 1: Fig. S3b. Notably, the composition of Bacteroides and Parabacteroides were similar in BAM, non-BAM, and healthy groups. At the genus level of the dominant bacteria in the disease group, pathogens including Escherichia and Enterococcus showed the highest proportion in BAM group, followed by non-BAM group, while Veillonella demonstrates the opposite trend. Streptococcus and Lachnoclostridium exhibited a similar composition in BAM and non-BAM groups. Conversely, Prevotella, Faecalibacterium, Subdoligranulum, Ruminococcus, and Megamonas were relatively enriched in healthy individuals.
At the diversity level, both BAM and non-BAM groups exhibited lower richness and Shannon diversity compared to healthy group, but there was no significant difference between BAM and non-BAM groups (Additional file 1: Fig. S3c, d). The analysis of β-diversity revealed that both BAM group and non-BAM group exhibited significant separation from healthy group (Additional file 1: Fig. S3e).
Results from the LEfSe analysis at the genus level (Additional file 1: Fig. S3f) revealed that the characteristic microbiota of healthy group interestingly resembled those with high abundance in the healthy condition. Microbiota of non-BAM group were characterized by genera such as Gemella, Parasutterella, Morganella, Tyzzerella, Peptostreptococcus, and Bifidobacterium. Elevated levels of Escherichia, Enterococcus, Fusobacterium, Akkermansia, and Erysipelatoclostridium were related to the occurrence of BAM.
To further clarify the microbial differences associated with BAM in patients with IBD, we compared and identified 18 differential microbiota at the OTU level between disease groups (Additional file 1: Fig. S4). Of these, 15 OTUs were dominant in BAM group, only 3 OTUs exhibited high relative abundance in non-BAM group, such as Bacteroides coprocola DSM 17136 (OTU48), Alloprevolella sp. (OTU60), and Barnesiella sp. (OTU117).
Simultaneously, we further conducted Mantel analysis correlating the differential microbiota with predicted KEGG pathways. As shown in Fig. 2a in BAM group, a high correlation was observed among Selenomonas sp. oral taxon 136 (OTU480), Lachnoanaerobaculum sp. (OTU349), and Selenomonas artemidis (OTU434). Stomatobaculum sp. (OTU715) was highly correlated with Eubacterium brachy ATCC 33089 (OTU592) and showed moderate positive correlation with KEGG pathways of amino acid metabolism (r = 0.465), digestive system (r = 0.309), and metabolism of cofactors and vitamins (r = 0.415). OTU592 also demonstrated a positive correlation with the digestive system pathway (r = 0.367). Stomatobaculum sp. (OTU631) exhibited a positive correlation with cellular processes and signaling (r = 0.317).
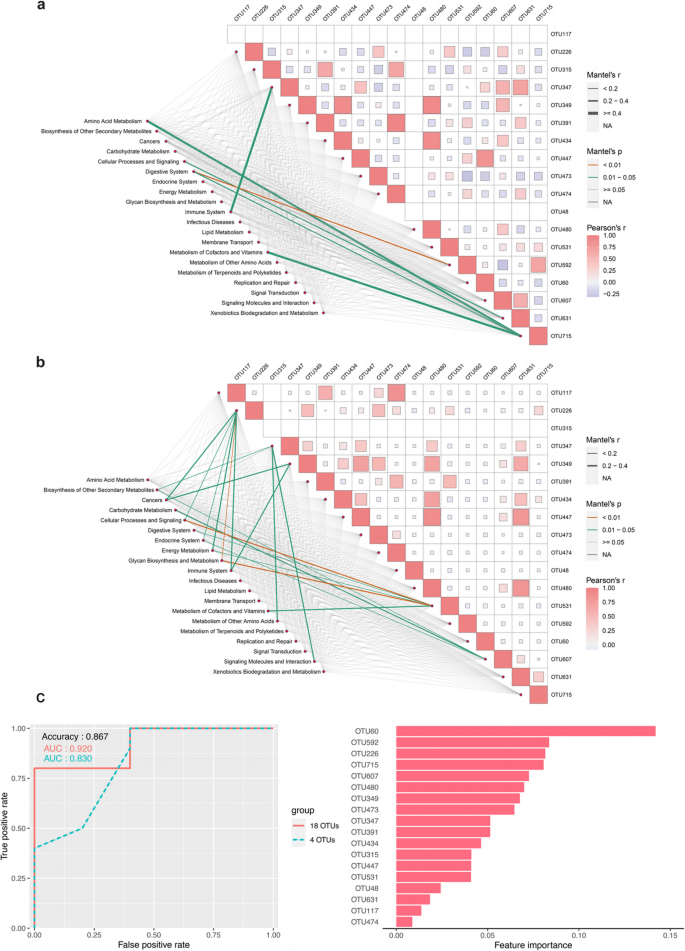
Mantel analysis correlating the differential microbiota with predicted KEGG pathways and random forest classifier. a Mantel analysis in BAM group. b Mantel analysis in non-BAM group. c A random forest classifier constructed with 18 differential OTUs to predict the occurrence of BAM in patients with IBD. Adjusted P values were shown through false discovery rate control. BAM, Bile Acid Malabsorption
In the non-BAM group (shown in Fig. 2b), only Bacteroides sp. (OTU315) was not enriched. Similarly, OTU480, OTU349, and OTU434 continued to exhibit high correlations. Moreover, OTU631 had a high correlation with OTU349, OTU480, and Leptotrichia sp. oral clone FP036 (OTU447). Out of 20 annotated KEGG pathway categories, 12 pathways showed some correlations with the changes in OTUs.
Interaction and prediction between differential microbiota and metabolites
As illustrated in Additional file 1: Fig. S5a and b, there is a close correlation between differential microbiota and metabolites in non-BAM group. Conversely, the connections between differential taxa in BAM group are not so close, with only a significant negative correlation between OTU631 and 7alpha-hydroxy-3-oxochol-4-en-24-oic acid. However, the relationship between different microbiota in non-BAM group was relatively close, with more positive correlations between the differential metabolites and microbiota. For example, OTU592 is associated with glycochenodeoxycholate-3-sulfate and taurochenodeoxycholate-3-sulfate, OTU60 is linked with glycochenodeoxycholate-3-sulfate. Gitogenin is related to Actinomycetaceae sp. (OTU531) and Megasphaera micronuciformis (OTU607) and positively related to C4, while Scardovia wiggsiae F0424 (OTU391) is directly associated with C4.
Furthermore, we constructed a random forest model based on 18 OTUs to predict the occurrence of BAM in patients with IBD. As shown in Fig. 2c, the AUC reached 0.92 on the test set, with an accuracy of 86.7% and an F1-score of 0.909. After selecting the top 4 OTUs (OTU60, OTU226: Eubacterium nodatum group, OTU592, and OTU715) based on importance ranking for another round of random forest model construction, the results indicated a slight decrease in AUC on the test set to 0.83, but the F1-score and accuracy remained unchanged.
BAM and IBD improved after FMT
Of the BAM group, 1-month post-FMT, 61.90% (13/21) and 52.38% (11/21) achieved clinical response and clinical remission, respectively, while 65.88% (56/85) and 43.53% (37/85) achieved clinical response and clinical remission in non-BAM group (Fig. 3a). 66.67% (14/21) and 52.38% (11/21) achieved clinical response and clinical remission in BAM group, respectively, while 49.41% (42/85) and 40.00% (34/85) achieved clinical response and clinical remission in non-BAM group 3-month post-FMT (Fig. 3a). Whether the patients with IBD were diagnosed as BAM or non-BAM had no effect on the clinical efficacy 1 month and 3 months post-FMT, either in clinical response (P = 0.80, 1 month post-FMT; P = 0.22, 3 months post-FMT) or in clinical remission (P = 0.48, 1 month post-FMT; P = 0.33, 3 months post-FMT). Compared with non-BAM group, BAM group had a higher proportion of improvement in abdominal pain and diarrhea after FMT. As illustrated in Fig. 3b, the number of patients in BAM group with abdominal pain decreased from 85.71% (18/21) to 42.86% (9/21) 1 month post-FMT and to 38.10% (8/21) 3 months post-FMT. While in non-BAM group, 52.94% (45/85) and 57.65% (49/85) of patients still had abdominal pain, 1 month and 3 months post FMT, respectively. In terms of diarrhea (Fig. 3c), 42.86% (9/21) and 54.12% (46/85) of patients (BAM vs. non-BAM) complained of diarrhea 1 month post FMT, while at 3 months post FMT, there were 42.86% (9/21) and 52.94% (45/85) of patients (BAM vs. non-BAM) still had diarrhea. The detailed changes of abdominal pain grades and diarrhea times are shown in Fig. 3f–i.
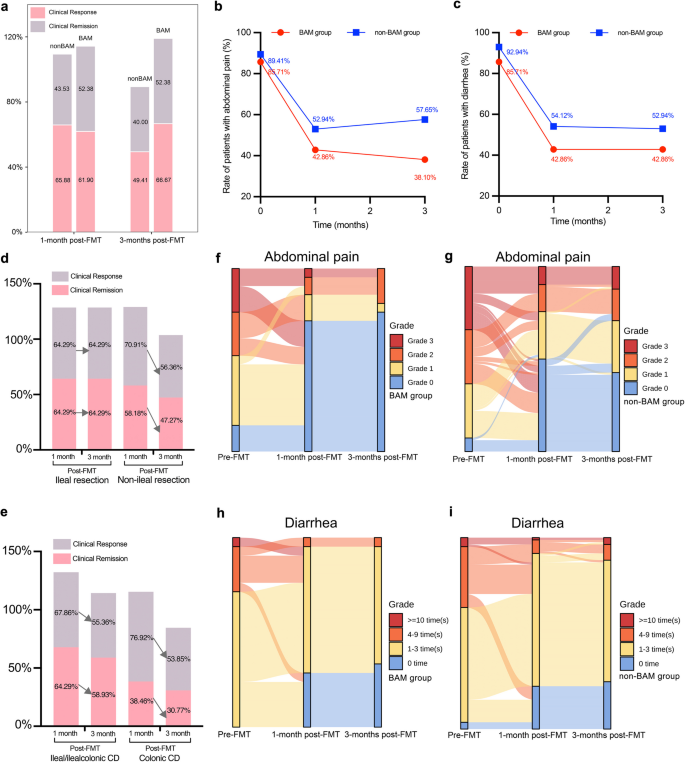
Patients’ clinical outcomes in BAM and non-BAM group. a Proportion of clinical response and remission. b Rate of patients with abdominal pain in BAM group before and after FMT. c Rate of patients with diarrhea in BAM group before and after FMT. d Proportion of clinical response and remission in CD patients with ileal resection/non-ileal resection. e Proportion of clinical response and remission in CD patients with ileal/ileocolonic lesions. f, g Sankey diagram of grade changes in patients with abdominal pain in BAM group and non-BAM group before and after FMT. h, i Sankey diagram of times changes in patients with diarrhea in BAM group and non-BAM group before and after FMT. BAM, Bile Acid Malabsorption
The C4 levels in CD patients with ileal resection decreased significantly after FMT, while the decrease of C4 in non-resection group showed no significant difference (P = 0.12, Fig. 1d). Patients with ileal/ileocolonic lesions got more obvious decrease of C4 than colonic lesions group (P = 0.01 vs. P = 0.53, Fig. 1e). CD patients with ileal/ileocolonic lesions or ileal resection were attended to achieve higher and more stable rate of clinical response and remission than colonic CD or non-resection (Fig. 3d, e).
In BAM group, the symptoms of diarrhea and abdominal pain improved when the level of serum C4 decreased significantly after FMT (P < 0.001, Fig. 4a). There was no significant change in the level of BAs except glycochenodeoxycholate-3-sulfate (Fig. 4a). In non-BAM group, the decrease trend of C4 had no significant difference and even exhibited an increase trend in some patients. However, bile acid metabolism changed significantly in non-BAM group, the levels of CA, CDCA, DCA, glycolithocholic acid, glycoursodeoxycholic acid, and chenodeoxycholic acid 3-sulfate increased significantly after FMT (Fig. 4b).
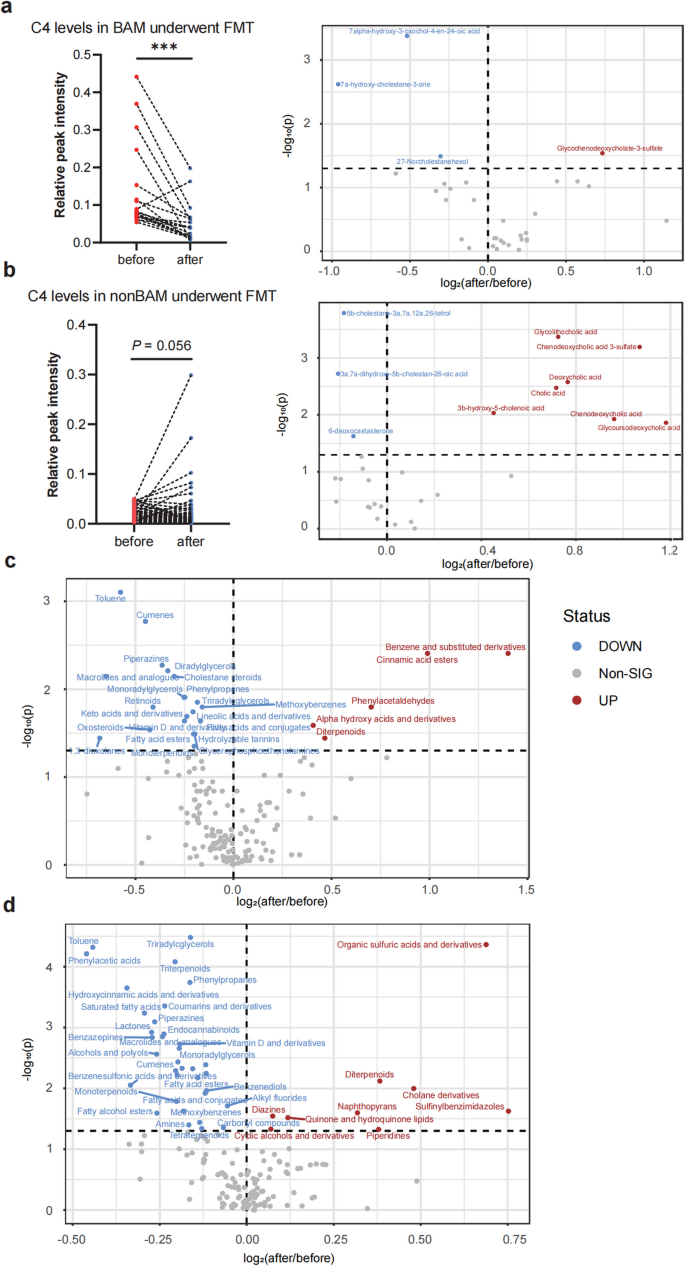
The serum level of C4 and metabolites changes related to bile acid synthesis in BAM and non-BAM group. a C4 level in BAM after FMT and Volcano plot of bile acids in BAM patients before and after FMT. b C4 level in non-BAM after FMT and Volcano plot of bile acids in non-BAM patients before and after FMT. c Volcano plot of other differential metabolic classes in BAM before and after FMT. d Volcano plot of other differential metabolic classes in non-BAM before and after FMT. BAM, Bile Acid Malabsorption. *** p < 0.001
Significant improvement in lipid metabolism can be observed at both metabolic classes and single metabolite levels in BAM group (Additional file 2: Table S2). The levels of Lactones, Fatty alcohol esters, Fatty acid esters, Monoradylglycerols, Cholestane steroids, Triradylcglycerols, Lineolic acids and derivatives, Vitamin D and derivatives, Glycerophosphoethanolamines, Diradylglycerols, and Retinoids significantly decreased after FMT (Fig. 4c), which belonged to Lipids and Lipid-like Molecules superclass. A similar distribution can also be observed in metabolites which significantly decreased after FMT in BAM group, 42.75% (115/269) of which belonged to Lipids and Lipid-like Molecules superclass (Additional file 1: Table S2).
In non-BAM group, with a significant improvement in lipid metabolism 1 week post-FMT (Additional file 2: Table S3). The levels of Lactones, Fatty alcohol esters, Fatty acid esters, Monoradylglycerols, Vitamin D and derivatives, Triradylcglycerols, Endocannabinoids, Triterpenoids, Monoterpenoids, and Tetraterpenoids significantly decreased after FMT, which belonged to Lipids and Lipid-like Molecules superclass (Fig. 4d).
The 16S rRNA sequencing data clustered and annotated 934 OTUs. The top 10 genera were displayed in Fig. 5a. The dominant genera before and after treatment are similar with each other. Notably, the pathogenic genus Fusobacterium, ranked 7th, is absent in healthy group. Surprisingly, among the genera with low abundance in healthy group, such as Escherichia and Veillonella, there was a decreasing trend after FMT treatment in both BAM and non-BAM group. Similarly, among the genera with high abundance in healthy group, such as Faecalibacterium, Prevotella, and Subdoligranulum, there was an increasing trend after FMT treatment.
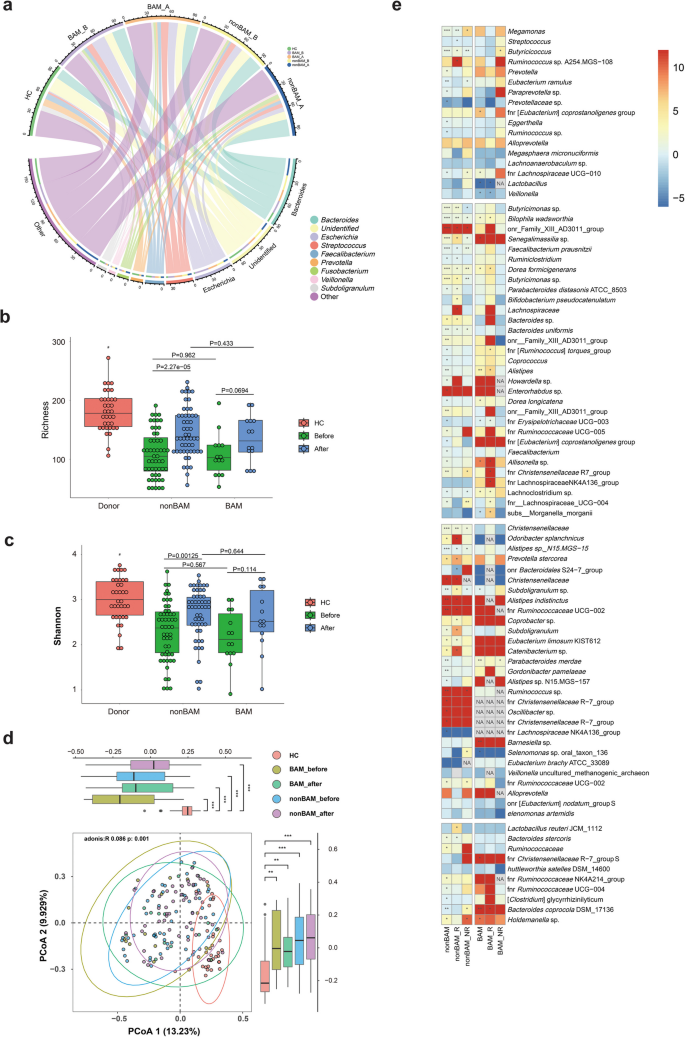
Microbial signatures associated with short-term responsiveness to FMT in BAM, non-BAM and HC group. a Relative abundance of the top 10 genera after FMT. b, c Comparison of α-diversity (richness and Shannon index) before and after FMT. d Comparison of β-diversity (PCoA of Bray–Curtis distance) before and after FMT. e Heat map of differential microbiota between response and non-response group (here the response status included clinical response and clinical remission) in BAM and non-BAM group. Adjusted P values were shown through false discovery rate control. HC, healthy control; BAM, Bile Acid Malabsorption; BAM_R, patients with BAM and have response after FMT; BAM_NR, patients with BAM and have no response after FMT; nonBAM_R, patients have no BAM and have response after FMT; nonBAM_NR, patients have no BAM and have no response after FMT; NA, no significance. * p < 0.05; ** p < 0.01; *** p < 0.001
At the diversity level, the richness and Shannon diversity of both BAM non-BAM group after FMT were still lower than those of healthy group but had a trend towards healthy group. However, there is no significant difference between BAM and non-BAM group (Fig. 5b, c). PCoA analysis revealed that the distribution of samples after FMT in BAM and non-BAM groups tended to converge towards healthy group (Fig. 5d).
The abundance of differential microbiota between BAM and non-BAM groups after FMT were shown in Fig. 5e. In BAM group, most genera exhibited significantly decreased abundance after FMT, such as OTU480, OTU226, Veillonella sp. (OTU347), OTU349, Shuttleworthia satelles DSM 14600 (OTU473), and OTU531, etc. Except for a fraction of genera such as OTU48 (P = 0.003) and OTU117 (P = 0.008) were significantly increased, and OTU447, OTU60, and OTU592 showed an increasing trend. Notably, after FMT treatment, both the response group (here the response status included clinical response and clinical remission) and non-response group experienced a significant increase in OTU48 and OTU117, demonstrating a transition from absence to presence. Additionally, compared to the non-response group, the response group exhibited relatively lower growth of OTU48 but higher growth of OTU117. Furthermore, OTU60 and OTU715 started to show enrichment in response group compared to their baseline levels before FMT, while OTU715 still displayed a decreasing trend in non-response group. Similarly, OTU447 and OTU391 exhibited an opposite trend of enrichment between response group and non-response group.
Within non-BAM group, the differential genera displayed trends similar to which observed in the BAM group, except for OTU48 and OTU592. The abovementioned genera OTU48 and OTU592 exhibited a declining trend after FMT treatment in non-BAM group, with OTU48 notably showing an opposing trend of increase in non-response group (P = 0.012). While the majority of microbiota exhibited no statistically differences, other OTUs that showed opposing trends between response group and non-response group within non-BAM group were Actinomyces dentalis (OTU474), OTU480 (up in non-response group, P = 0.022), OTU226, OTU715, OTU60, OTU607, OTU434, and OTU447. The differential microbiota may be focal points of our future research.
FMT can improve PBA supplementation-exacerbated colitis in acute mice models
In an acute enteritis mice model (Fig. 6a), disease activity index (DAI) scores progressively increased after PBA (CA and CDCA) supplementation (Fig. 6f). From day 4, DAI scores in CA + DSS group were stably and significantly higher than that in single DSS group, and at day 5, DAI scores in CDCA + DSS group began to have the same rising trend. At the endpoint, the differences of DAI between groups were most pronounced, with CA + DSS group showing a significant increase over the DSS group (P < 0.001), and CA group showing a significant increase over control group (P < 0.001) (Fig. 6f). Even after DSS withdrawn, the exacerbated colitis phenotype continued. The severity of colitis was inversely correlated with colon length and positively correlated with spleen index. Mice in CA + DSS group had significantly shorter colons than those in the DSS group (Fig. 6c, g, P = 0.007), and their spleen index were significantly higher than DSS group (Fig. 6d, h). At the endpoint, representative images of the colon from different groups showed smooth mucosa in control group while CA and CDCA groups exhibited unclear vasculature with granular and reddened surfaces in mucosa. The DSS group showed rough mucosa with small erosions and bleeding, and CA + DSS and CDCA + DSS groups displayed extensive ulceration and obvious spontaneous bleeding (Fig. 6e). Histopathological scores (including severity of inflammation, extent of injury, and crypt damage) in CA + DSS and CDCA + DSS group were significantly higher than DSS group (Fig. 6b, i). We measured inflammatory cytokine expression in the serum to explore whether CA and CDCA supplementation exacerbated colitis by modulating cytokine levels. As shown in Additional file 1: Fig. S6a and b, compared to the DSS group, CA and CDCA significantly increased the expression of pro-inflammatory cytokines such as TNF-α and IL-1β in single-DSS mice. However, the anti-inflammatory cytokine IL-10 was significantly decreased in CA + DSS and CDCA + DSS groups (Additional file 1: Fig. S6c).
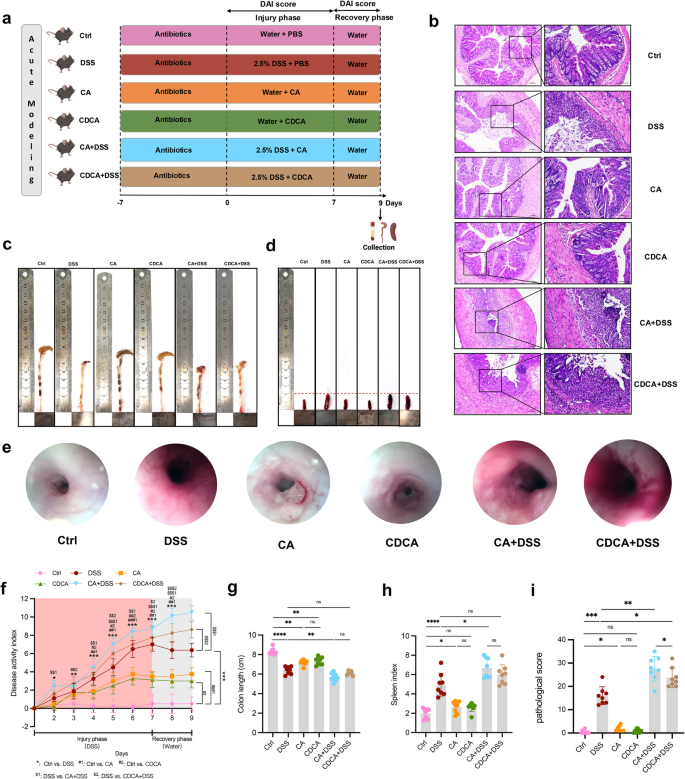
Primary BA administration in acute modeling mice. a Flow chart. b Representative H&E images, c Representative colon images, d Representative spleen images, e Representative endoscopic images of the colon, f DAI score, g Colon length, h Spleen index, i Pathological score of acute modeling mice. ns p > 0.05; * p < 0.05; ** p < 0.01; *** p < 0.001
Treatment with FMT from healthy donors ameliorated the exacerbated colitis phenotype induced by CA and CDCA (Fig. S7a). This was evidenced by reduced DAI scores: which progressively decreased in the treatment experiment and were significantly lower than untreated CA/CDCA + DSS group (Fig. S7f). The colon length, spleen index, and histopathological scores in FMT-treated CA/CDCA + DSS group were also significantly different from untreated CA/CDCA + DSS group (Fig. S7b–d, g–i). At the endpoint, representative images of the colon showed healed smooth mucosa in FMT-treated CA/CDCA + DSS group (Fig. S7e). Intestinal barrier integrity indicated that FMT treatment significantly increased mRNA levels of tight junction proteins in the colonic tissue compared to untreated CA/CDCA + DSS group, including Zonula Occludens-1 (ZO-1) and Occludin (Additional file 1: Fig. S8b, c, P < 0.001), as well as the mucus layer protein Mucin 2 (Muc2) (Additional file 1: Fig. S8a, P < 0.001). Additionally, FMT reduced the mRNA expression of pro-inflammatory cytokines such as TNF-α and IL-1β in the intestinal mucosa compared to untreated CA/CDCA + DSS group (Additional file 1: Fig. S6h, i, P < 0.001), while significantly increasing IL-10 levels (Additional file 1: Fig. S6g, P < 0.001). These changes of cytokine levels in serum were consistent with those observed in the colon (Additionalfile 1: Fig. S6d, e, f). Interestingly, FMT treatment significantly reduced C4 levels in CA + DSS/CDCA + DSS groups (Additional file 1: Fig. S8d, P < 0.001), accompanied by a decrease in cytochrome P450 7A1 (CYP7A1), cytochrome P450 8B1 (CYP8B1), and an accumulation of cytochrome P450 27A1 (CYP27A1), both of which are involved in the synthesis and metabolism of C4 and BAs (Additional file 1: Fig. S8e-g).
PBA supplementation-exacerbated colitis in chronic mice models
We also explored the significant role of primary BAs (PBAs, CA, and CDCA) in inducing chronic intestinal injury in mice model (Fig. S9a). After 7 days’ antibiotics supplementation and PBA supplementation for 1 month, DAI evaluation for mild to moderate intestinal injury was observed and more obvious than non-antibiotics group (Fig. S9g). Histopathological scores and representative images showed local accumulation of inflammatory cells and some crypt damage in antibiotics + PBA supplementation (Fig. S9b, e). The colon length and spleen index in antibiotics + PBA supplementation group were also significantly different from antibiotics + ctrl group (Fig. S9c, d, f).