Literature screening and patient data extraction
The literature search and screening process for this study is detailed in Fig. 1. Initial searches identified 696 Chinese and 2,006 English articles, plus 8 from conference abstracts/references, totaling 2,710. After removing 895 duplicates, title/abstract screening excluded 1,567, and full-text review excluded another 165. Ultimately, 83 articles were eligible for data extraction. Of these, 77 cases were excluded for being non-HCC or duplicates. Finally, we gathered a cohort of 373 HCC patients with available graft rejection information, of whom 254 had relatively complete individual data. For transparency, the number of patients with relatively complete data and graft rejection information for each publication, together with the Web Link, is provided in Additional file 2: Table S1, while details on variable-specific missing data status (Complete, Completely missing, Partially missing) are summarized in Additional file 3: Dataset S1.
Literature quality assessment
A total of 83 studies were included: 46 case reports (55.4%), 32 case series (38.6%), and 5 cohort studies (6.0%), assessed using design-specific checklists. Case reports exhibited strong reporting quality, with 32 (69.5%) rated as high quality, 10 (21.7%) as moderate, and 4 (8.7%) as low. Key strengths included clear demographic descriptions (95.7% yes for Q1) and clinical timelines (93.5% yes for Q2). However, case reports demonstrated complete demographic/timeline reporting but had critical gaps in diagnostic documentation and adverse event tracking. Common limitations included inconsistent documentation of diagnostic methods (45.7% no for Q4) and adverse events (52.2% unclear/no for Q7). Case series (n =32) exhibited moderate to high quality: 22 (68.8%) rated high, 7 (21.9%) moderate, and 3 (9.4%) low. Strengths included clear reporting of demographics, clinical information, and outcomes (>90.0% yes for Q6, Q7, and Q8), as well as statistical methods (96.9% yes for Q10). Here, “statistical methods” only referred to basic descriptive statistics, not advanced analytical designs. However, 43.8% of the case series lacked clear inclusion criteria (Q1), and 25.0% failed to ensure consecutive participant inclusion (Q4). Among five cohort studies, none were low quality; two (40%) were moderate due to insufficient follow-up information and inadequate handling of loss to follow-up (Q9, Q10). Overall, most studies (68.7%) across designs met high-quality thresholds, supporting methodological rigour for evidence synthesis. Detailed quality assessments are provided in Additional file 4: Table S2-4.
Clinical characteristics of HCC patients with peri-LT ICIs use at our center
Thirteen male patients were included after screening in our center, with a median age of 52 years (IQR: 50-55 years). All patients received ICIs prior to LT, with 84.6% (n = 11) of them using anti-PD-1 agents. Specifically, 38.5% (n = 5) of patients were treated with sintilimab, and 53.8% (n = 7) received ICIs as first-line therapy. The median number of ICI cycles administered was 2.5 (IQR: 2.0-4.0 cycles), and the median washout period between the final dose of ICIs and LT was 67 days (IQR: 35-154 days). Regarding non-ICI treatment measures, 61.5% (n = 8) of patients underwent surgery, 69.2% (n = 9) received TACE, and 76.9% (n = 10) were treated with TKIs, of which lenvatinib was used in 53.8% (n = 7) of cases. Notably, none of the patients experienced graft rejection following LT. During the follow-up period, 38.5% (n = 5) of patients experienced tumour recurrence, with a median recurrence-free survival time (RFS) of 270 days (IQR: 150-390 days). One patient (7.7%) died, and the median overall survival (OS) time was 270 days (IQR: 150-390 days). Detailed patient characteristics are provided in Additional file 5: Table S5. After integrating with literature cases, a cohort of 386 patients with graft rejection data and 267 with complete data was obtained.
Global and regional distribution of included cases with peri-LT ICI Use
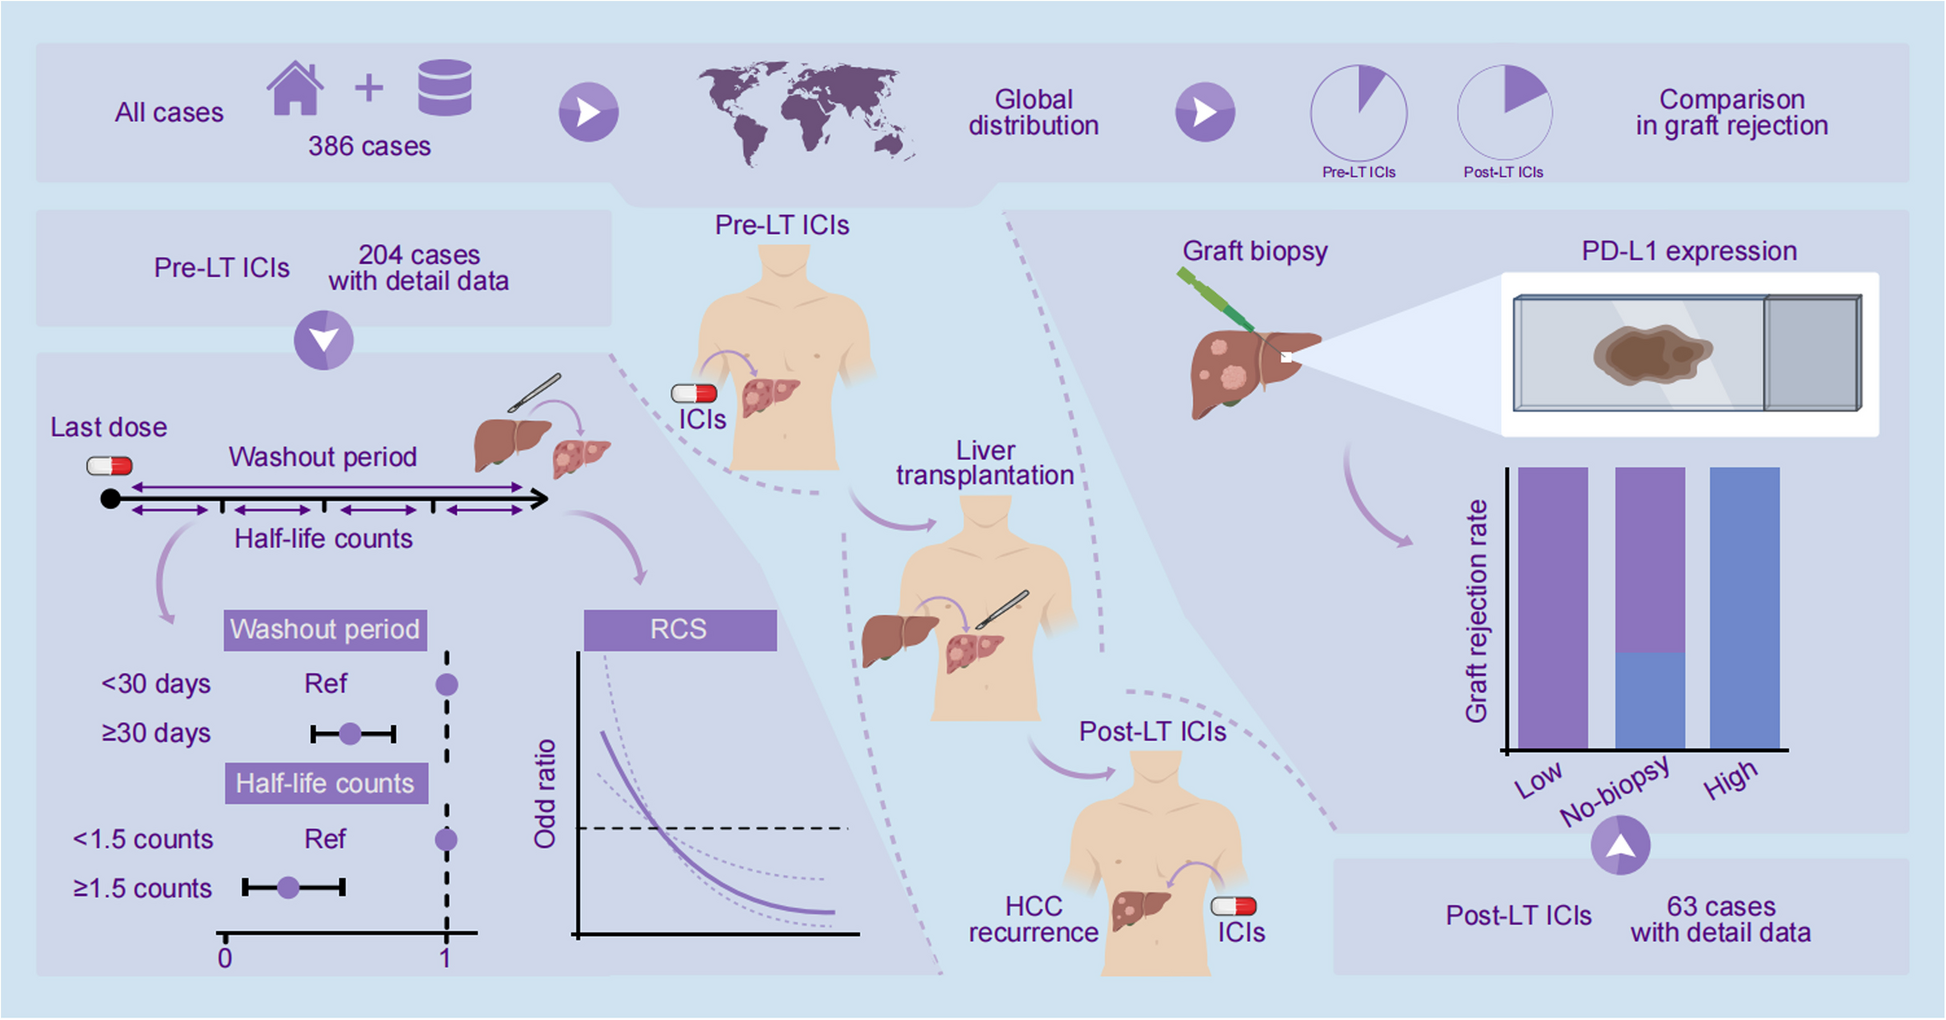
This global cohort study analyzed 386 HCC cases related to Peri-LT ICI use, as indicated in Fig. 2A and B and Additional file 6: Table S6. The overall distribution of cases is as follows: 66.3% (n = 256) were from Asia, primarily from China, followed by the Americas (n = 96, 24.9%), Europe (n = 31, 8.0%), and Africa (n = 3, 0.8%). At the national level, China reported the highest number of cases (n = 235, 60.9%), while the USA had the second-highest (n = 93, 24.1%). In terms of literature sources, 79.0% (n = 305) of cases originated from English databases, 17.6% (n = 68) from Chinese databases, and 3.4% (n = 13) from unpublished studies. Regarding study type, cohort studies accounted for 45.3% (n = 175) of cases, case series constituted 43.3% (n = 167), and case reports made up 11.4% (n = 44).
Graft rejection outcomes by ICIs treatment phase and subgroup analyses
In terms of graft rejection, 71 cases (18.4%) experienced rejection, with 17.5% (n = 54) occurring in the Pre-LT ICIs group and 22.1% (n = 17) in the Post-LT ICIs group (Fig. 2C, Additional file 6: Table S6). Notably, there was no statistically significant difference in graft rejection rates between the two groups (Fig. 2D, P = 0.351). However, significant differences were observed in the distribution of ICI medication phases across variables, including country, region, and study type (all P < 0.001, Additional file 6: Table S6). For instance, Pre-LT ICIs usage was predominant in Asia (n = 219, 70.9%) and cohort studies (n = 175, 56.6%), while Post-LT usage was more common in Europe (n = 18, 23.4%) and case series studies (n = 59, 76.6%). Subgroup analyses showed no significant differences in graft rejection rates between Pre-LT and Post-LT ICIs groups across various countries, regions, literature sources, or study types (all P>0.05, Additional file 7: Figure S1 A-D).
Further analysis of patients who experienced graft rejection revealed significant differences in rejection severity and mortality between the Pre-LT and Post-LT ICI groups. As shown in Fig. 3A, patients in the Post-LT group had a higher proportion of graft loss/dysfunction (n = 8, 47.1%) compared to the Pre-LT group (n = 14, 25.9%), while the proportion of complete recovery was significantly lower in the Post-LT group (n = 2, 11.8%) than in the Pre-LT group (n = 31, 57.4%). This indicates that graft rejection tends to be more severe in the Post-LT setting. Consistent with this finding, Fig. 3B demonstrates that the proportion of patients in whom graft rejection directly caused death was substantially higher in the Post-LT group (n = 8, 47.1%) compared to the Pre-LT group (n = 10, 18.5%).
Graft rejection outcomes in pre-LT/Post-LT ICI use and the relationship between washout period, half-life counts and graft rejection rate in pre-LT ICIs treatment HCC patients. A, B The bar plots illustrate the differences in graft rejection severity (A) and death events caused by graft rejection (B) between Pre-LT and Post-LT use of ICIs, with results indicating significant differences (p < 0.05) in both aspects, showing higher severity and death rates in Post-LT cases. C, D The bar plots present the differences in graft rejection between patients with washout periods of ≤30 days versus >30 days (C) and half-life counts of ≤1.5 versus >1.5 counts (D), both revealing significant associations (p < 0.05) between these factors and graft rejection risk
Clinical characteristics of HCC patients receiving pre-LT ICIs
We examined patients who received ICIs before LT. This section includes a total of 204 patients with detailed records, as shown in Table 1. The cohort comprised 131 patients (64.2%) aged ≤60 years and 47 patients (23.0%) aged >60 years, with the majority being male (n = 158, 77.5%). HBV was the leading etiology (n = 95, 46.6%), followed by HCV (n = 19, 9.3%), ALD (n = 8, 3.9%), and MASH/MASLD (n = 8, 3.9%). Tumor characteristics showed that 21 (10.3%) patients met the Milan criteria, while 134 (64.2%) exceeded these criteria. Twenty-six (12.7%) presented with a single tumor, whereas 93 (45.6%) had multiple tumors. ICIs were administered to all patients, with anti-PD-1 therapy being the most common (n = 154, 75.5%), followed by anti-PD-L1 (n = 22, 10.8%) and combination therapies (n = 9, 4.5%). The distribution of ICI cycles among patients is as follows: 11.8% (n = 24) received 1 cycle, 59.3% (n = 121) received 2-10 cycles, and 18.1% (n = 37) received more than 10 cycles. The median washout period was 48 days (IQR: 22–113 days), with 35.3% (n = 72) of patients experiencing a washout period of ≤30 days. The median half-life count was 2 counts, with 27.0% (n = 55) having a half-life of ≤1.5 counts. Other treatments included surgery (n = 38, 18.6%), radiotherapy (n = 6, 2.9%), chemotherapy (n = 19, 9.3%), and LRT (n = 145, 71.1%). TACE was performed in 56.9% (n = 116) of patients, local ablation in 15.7% (n = 144), and TKIs in 70.6% (n = 144). Immunosuppressive regimens included Basiliximab induction in 46.6% (n = 95) of patients, with maintenance immunosuppression consisting of MMF (n = 169, 82.8%), mTOR inhibitors (n = 82, 40.2%), CNIs (n = 179, 87.7%), and corticosteroids (n = 141, 69.1%).
Risk factor analysis for graft rejection in HCC patients receiving pre-LT ICIs
We investigated the differences between patients with graft rejection and those without among the 204 cases, as shown in Table 1. Of these, 44 experienced graft rejection and 160 did not. Significant differences were found in variables including ICIs (P=0.048), ICIs target (P=0.013), ICIs cycles (P=0.011), washout period (P=0.004 median; P=0.011 categorical), half-life counts (P=0.003 median; P<0.001 categorical), other treatments (surgery: P=0.036; LRT: P=0.006), and Basiliximab (P=0.026). Patients with a washout period ≤30 days had a 33.3% rejection rate, versus 15.2% for >30 days. Those with ≤1.5 half-life counts had a 41.8% rejection rate, versus 14.8% for >1.5 counts. These are shown in Fig. 3C and D.
For washout period, a duration >30 days was linked to a lower risk of graft rejection (OR=0.36, 95% CI: 0.18–0.72, P=0.004), consistent across models: Model 1 OR=0.35 (95% CI: 0.17-0.70, P=0.003), Model 2 OR=0.38 (95% CI: 0.18-0.78, P=0.008), Model 3 OR=0.40 (95% CI: 0.18-0.86, P=0.019), Model 4 OR=0.37 (95% CI: 0.17-0.77, P=0.008), and Model 5 OR=0.36 (95% CI: 0.17-0.75, P=0.006); Model 6 showed marginal significance (OR=0.42, 95% CI: 0.16-1.11, P=0.071). See Fig. 4A.
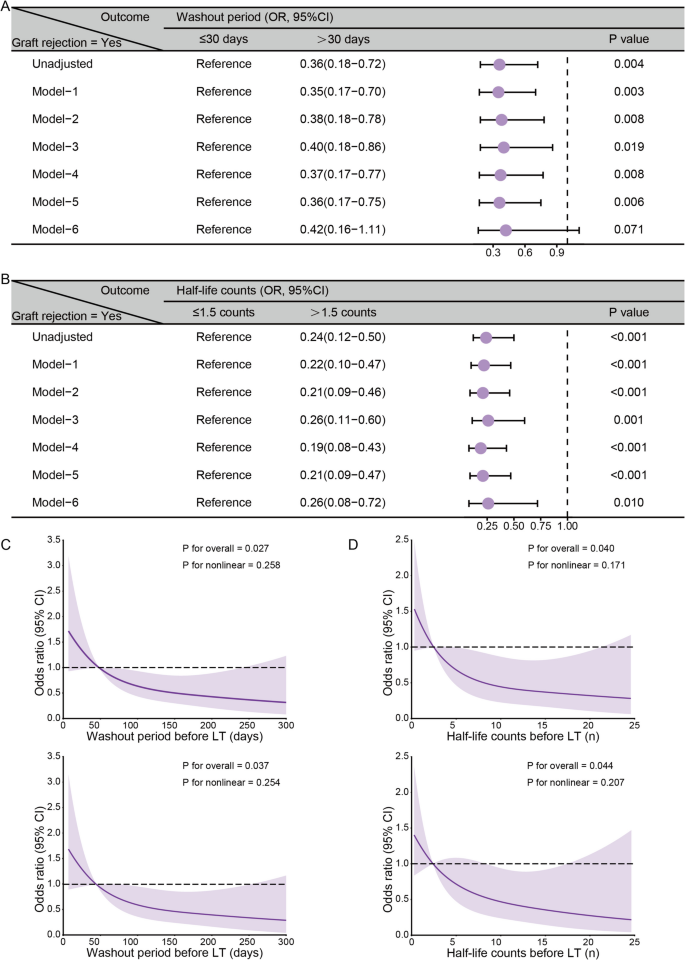
Multi-model validation and nonlinear relationships of washout period and half-life counts with graft rejection risk in pre-LT ICIs treatment HCC patients. A, B Association between ICIs washout period (A), half-life counts (B), and the risk of graft rejection across various adjustment models. The reference groups were a washout period of ≤30 days and half-life counts of ≤1.5. Models were adjusted as follows: Model 1 included age and gender; Model 2 added etiology, tumor number, and Milan criteria to Model 1; Model 3 included ICIs type, target, and cycles in addition to Model 1; Model 4 incorporated surgery, radiotherapy, chemotherapy, LRT, TKIs, and bevacizumab into Model 1; Model 5 added basiliximab, MMF, mTOR inhibitors, and corticosteroids to Model 1; and Model 6 combined all the variables from Models 1-5. (C, D) Dose-response relationships were evaluated using restricted cubic spline analyses for the washout period (days) (C) and half-life counts (n) (D), demonstrating unadjusted models (upper panels) and models adjusted for age and gender (lower panels)
Similarly, half-life counts >1.5 were linked to lower rejection risk (OR=0.24, 95% CI: 0.12-0.50, P<0.001), confirmed across all models: Model 1 OR=0.22 (95% CI: 0.10-0.47, P<0.001), Model 2 OR=0.21 (95% CI: 0.09-0.46, P<0.001), Model 3 OR=0.26 (95% CI: 0.11-0.60, P=0.001), Model 4 OR=0.19 (95% CI: 0.08-0.43, P<0.001), Model 5 OR=0.21 (95% CI: 0.09-0.47, P<0.001), and Model 6 OR=0.26 (95% CI: 0.08-0.72, P=0.010). See Fig. 4B.
The subgroup analysis (Additional file 8: Figure S2) showed consistent trends: longer washout periods (>30 days) and higher half-life counts (>1.5) were generally linked to lower rejection risk across age, gender, etiology, and other subgroups. Restricted cubic spline analyses further explored dose-response relationships (Fig. 4C–D). The unadjusted analyses showed significant overall associations for washout period (P=0.027) and half-life counts (P=0.040) with no evidence of nonlinearity. After adjustment for age and gender, overall associations remained (P=0.037 and P=0.044), still showing no nonlinearity (all P>0.2).
Prognostic factors affecting RFS and OS in HCC patients receiving pre-LT ICI Treatment
This study examined prognostic factors influencing RFS and OS in 204 patients who underwent Pre-LT ICIs Treatment. The median follow-up time for these patients was 325 days (IQR: 120-486 days). Forty-one patients (20.1%) experienced recurrence after LT, with a median RFS of 325 days (IQR: 22–113 days). Additionally, 23 patients (11.3%) died after LT, with a median OS of 48 days (IQR: 22–113 days). These results are presented in Table 1.
Univariate Cox analysis identified several variables significantly associated with RFS and OS (see Additional file 9: Table S7). For RFS, radiotherapy (HR=2.51, 95% CI: 1.03–5.38, P=0.043) and TACE (HR=2.97, 95% CI: 1.40–7.16, P=0.004) were significant. Basiliximab use was also linked to increased recurrence risk (HR=2.17, 95% CI: 1.09–4.50, P=0.028). For OS, corticosteroids (HR=12.17, 95% CI: 1.67–1549.2, P=0.007) and graft rejection (HR=5.17, 95% CI: 2.21–12.24, P<0.001) were significant predictors. Kaplan-Meier curves showed that graft rejection did not significantly impact RFS (Log-rank P=0.476, Additional file 10: Figure S3 A-B) but was associated with lower OS (72.6% vs. 94.2% at 1 year; 72.6% vs. 90.9% at 2 and 3 years; Log-rank P<0.001, Additional file 10: Figure S3 C-D).
Clinical characteristics in recurrence HCC patients receiving post-LT ICIs
The baseline characteristics of patients who experienced HCC recurrence after LT and were treated with ICIs are outlined below. This analysis included 63 patients with detailed data. The cohort was predominantly male, accounting for 73.0% (n = 46) of the patients. Regarding age distribution, 55.6% (n = 35) of the patients were aged ≤60 years, while 33.3% (n = 21) were >60 years. HBV and HCV were the most common etiologies, constituting 12.7% (n = 8) and 19.0% (n = 12) of cases, respectively. ICIs were primarily administered as non-first-line treatment (n = 57, 90.5%). Anti-PD-1 agents were the most prevalent (n = 46, 73.0%), with nivolumab being the most frequently utilized (n = 29, 46.0%). Most patients (n = 25, 39.7%) received ICIs between 1 and 5 years after LT. Notably, PD-L1 expression on the graft was evaluated in a subset of patients, with low PD-L1 expression noted in 22.2% (n = 14) of cases and high PD-L1 expression in 6.3% (n = 4) of cases. Recurrence or metastasis was most commonly observed in the liver (n = 22, 34.9%) and lungs (n = 31, 49.2%). TKIs were administered to 71.4% (n = 45) of patients, with sorafenib being the most common (n = 33, 52.4%). Immunosuppressive agents were given to the majority of patients, with CNIs being the most frequently used (n = 46, 73.0%), followed by mTOR inhibitors (n = 28, 44.4%) and MMF (n = 24, 38.1%). During follow-up, 47.6% (n = 30) died after recurrence. The median OS time following recurrence was 566 days (IQR: 321-990 days).
Analysis of risk factors for graft rejection in recurrence HCC patients receiving post-LT ICIs
Among the 63 patients receiving ICIs after LT, 13 experienced graft rejection while 50 did not. As shown in Table 2, when comparing patients with and without graft rejection, the two groups were similar across most characteristics, including demographics, etiology, ICI-related factors, HCC recurrence features, and immunosuppressive agent use, with no significant differences noted. However, a significant difference was found in graft PD-L1 expression (P<0.001, Fig. 5A). In the low PD-L1 group, graft rejection incidence was 0%; in the high PD-L1 group, it was 100%. Patients with low graft PD-L1 expression were significantly less likely to develop rejection than those with high expression (OR=0.19, 95% CI: 0.08–0.43, P<0.001, Fig. 5B). This association remained significant across six multiple logistic regression models, adjusting for different confounding factors. As shown in Fig. 5B, the ORs and 95% CIs consistently indicated lower rejection risk with low PD-L1 expression, with all P values <0.05 (Fig. 5B). This consistency highlights graft PD-L1 expression as a robust predictor of rejection in this population.
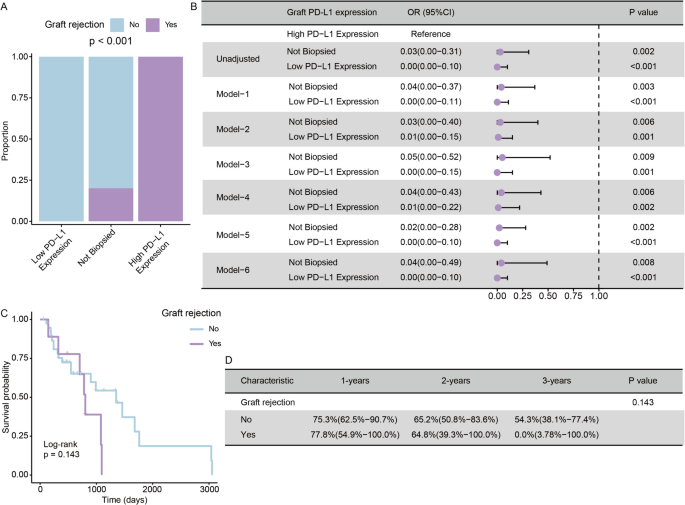
The Association between Graft PD-L1 Expression and Graft Rejection Rate, and the Impact of Graft Rejection on OS after Recurrence in HCC Patients Receiving Post-LT ICIs. A Bar chart comparing the proportion of graft rejection across different PD-L1 expression categories. B Forest plot displaying OR with 95% confidence intervals for graft rejection risk according to PD-L1 expression levels across different adjustment models. High PD-L1 expression served as the reference group. Low PD-L1 expression consistently demonstrated strong protective effects against graft rejection across all models (all p < 0.05). Models were adjusted as follows: Model 1 included age and gender; Model 2 adjusted for etiology; Model 3 included time from LT to ICIs; Model 4 included liver recurrence and time from LT to recurrence; Model 5 included TKIs and LRT; and Model 6 adjusted for MMF and mTOR inhibitors. C, D Kaplan-Meier curve and corresponding survival probability table comparing OS after recurrence between patients with graft rejection and those without it
Risk factor analysis for OS in recurrence HCC patients receiving post-LT ICIs
The analysis of OS following recurrence in HCC patients receiving Post-LT ICIs identified several potential risk factors, as detailed in Additional file 11: Table S8. Univariate Cox regression analysis indicated that MASH/MASLD etiology (HR = 13.56, 95% CI: 1.20–98.78, P = 0.038), a treatment interval exceeding five years from LT to ICIs (HR = 0.06, 95% CI: 0.00–0.80, P = 0.032), and TACE treatment (HR = 0.24, 95% CI: 0.03–0.92, P = 0.035) serve as significant predictors of OS. Other variables, including age, gender, HBV/HCV etiology, ICIs type, and time from LT to ICIs, did not show significant associations with OS (P > 0.05 for all). Interestingly, even graft rejection, which has been associated with poorer OS in the Pre-LT ICIs group, did not exhibit a significant association. The Kaplan-Meier curves also revealed no statistically significant difference in OS between patients with and without graft rejection (77.8% vs. 75.3% at 1 year; 64.8% vs. 65.2% at 2 years; 0.0% vs. 54.3% at 3 years; Log-rank P = 0.143, Fig. 5C-D). Nonetheless, the curves suggested a possible trend toward reduced survival in the rejection group at later timepoints, which may reflect limited sample size.