Material
[3H]5-HT (43.1 µCI mmol−1), [3H]dopamine (51.4 µCI mmol−1), [3H]nisoxetine (46.0 µCI mmol−1), [3H]WIN35428 (CFT) (82.6 µCI mmol−1), and Ultima GoldTM XR liquid scintillation cocktail were purchased from PerkinElmer (Boston, MA, USA). [3H]MPP+ (60 µCi mmol−1) was obtained from American Radiolabeled Chemicals (St. Louis, MO, USA). Cell culture dishes were purchased from Sarstedt (Nuembrecht, Germany). Methyl-β-cyclodextrin (MβCD) and water-soluble cholesterol (cholesterol chelated with MβCD, 51 mg cholesterol/g MβCD) were from Sigma-Aldrich (St. Louis, MO, USA). All other chemicals and cell culture supplies were from Sigma-Aldrich (St. Louis, MO, USA).
Cell culture
Human embryonic kidney (HEK) 293 cells (CRL-1573, ATCC, Manassas, Virginia, U.S.) stably expressing hSERT, hDAT, or hNET were maintained in humidified atmosphere (37 °C, 5% CO2) in Dulbecco’s Modified Eagle Medium (DMEM), supplemented with 10% heat-inactivated fetal calf serum (FCS), streptomycin (100 µg × 100 mL−1) and penicillin (100 U × 100 mL−1). Geneticin (50 µg × mL−1) was used as selection antibiotic. HEK293 cells have recently been authenticated using highly polymorphic short tandem repeat (STR) loci. STR loci were amplified with the PowerPlex® 16 HS System (Promega). Fragment analysis was done on an ABI3730xl (Life Technologies), and the resulting data were analyzed with GeneMarker HID software (Softgenetics). The results were matched with the Cellosaurus database to the cell line HEK293-DR-GFP-RAD51B-9 (RRID:CVCL_XX01): parental HEK293 cells (96.7%), stable HEK293 cell lines expressing YhDAT (90%)), YhNET (100%), and YhSERT (96.7%).
Mutagenesis and transfection of SERT to reduce PIP2 binding capacity
Mutations in SERT were introduced using the Quickchange Lightning Kit (Agilent) with the following primers: K352A: TGGCTTTTGCTAGCTACAACGCGTTCAACAACAACTGCTACC; K460A: GTTCCCACACGTCTGCGCAGCGCGCCGGGAGCGGTT. SERT-K352A/K460A was transiently transfected into HEK293 cells and grown in DMEM supplemented with 10% heat-inactivated FCS, streptomycin (100 µg × 100 mL−1), and penicillin (100 U × 100 mL−1) in a humidified atmosphere (37 °C, 5% CO2). Transfections were carried out using Lipofectamine Plus (Invitrogen); 5 µg of plasmid encoding SERT-K352A/K460A or wild-type SERT was used for transient transfection of cells in 10 cm culture dishes. Cells were assayed 48 h after transfection.
Membrane cholesterol depletion and replenishment
Freshly prepared solutions of MβCD or Cholesterol were dissolved in Krebs-HEPES buffer (KHB; 25 mM HEPES, 120 mM NaCl, 5 mM KCl, 1.2 mM CaCl2, 1.2 mM MgSO4, and 5 mM D-glucose, pH 7.3) and added to HEK293 cells expressing the MATs. The net amount of cholesterol in the cholesterol solution was calculated from the manufacturer’s lot data. A solution containing 50 µg/mL cholesterol had an approximate concentration of 1 mM MβCD as chelating agent. After incubation with various concentrations of MβCD or Cholesterol for 30 min at 37 °C, the buffer was aspirated, and the cells were washed twice with KHB. The cholesterol content in cell lysates was analyzed using the Amplex Red Cholesterol Assay Kit (Invitrogen) according to the manufacturer’s protocol.
Cytotoxicity
Potential cytotoxic effects of cholesterol depletion were assessed with the CellTiter 96® Non-Radioactive Cell Proliferation Assay (MTT) (Promega GmbH, Walldorf, Germany) according to the manufacturer’s protocol. The cells were incubated with 6 and 10 mM MβCD for 30 min at 37 °C. Subsequently, MTT dye solution was added, and the plate was incubated for 2 h at 37 °C. After addition of the solubilization solution and incubation for 1 h, absorbance was recorded at 570 nm using a BioTek Synergy H1 hybrid multi-mode reader (Agilent Technologies Austria, Vienna, Austria) with integrated Gen5 microplate reader and imaging software. The relative cell viability was quantified by comparing the absorbance values of treated wells and compared to vehicle control wells.
Uptake experiments
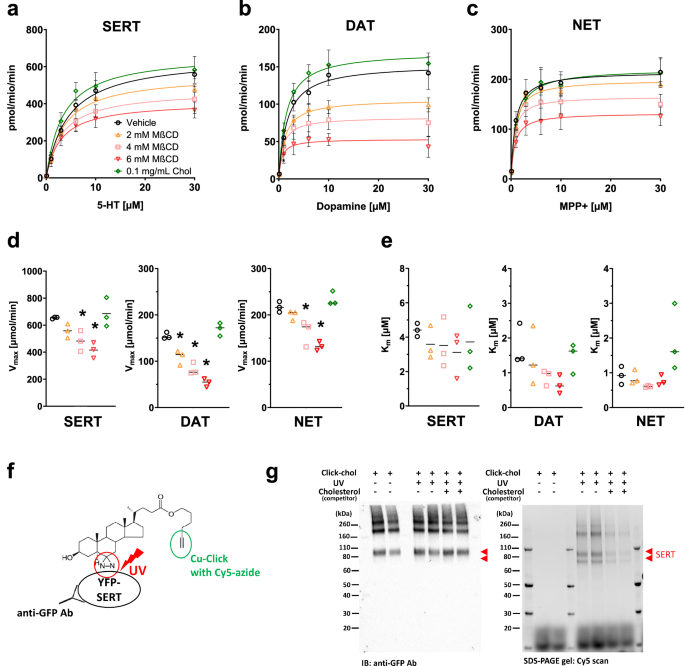
Experiments were performed as previously described [51, 52]. One day before the experiment, cells expressing the respective transporter were seeded onto poly-D-lysine-coated 96 well plates at a density of 30,000 cells per well in a final volume of 200 µL. For uptake experiments, the cell culture medium was replaced with 300 µL KHB with or without MβCD or cholesterol for 30 min at 37 °C. Next, the buffer was aspirated, and the cells were washed twice with KHB to remove any MβCD or cholesterol from the buffer. Then, the buffer was replaced with 0.1 µM [3H]5-HT (SERT), 0.1 µM [3H]dopamine (DAT), or 0.05 µM [3H]MPP+ (NET), and various concentrations of unlabeled substrate in a total volume of 50 µL. Uptake was terminated after 60 s by washing the cells with 200 µL ice-cold KHB. Subsequently, the cells were lysed with 200 µL Ultima GoldTM XR liquid scintillation cocktail, and the amount of tritium in the cells was measured with a Wallac 1450 MicroBeta® TriLux liquid scintillation counter. Non-specific uptake was determined in the presence of 30 μM paroxetine (SERT), 30 μM cocaine (DAT), or 30 μM nisoxetine (NET). Monoamine uptake data were fitted by nonlinear regression, Vmax and Km values were calculated from Michaelis-Menten’s least-squares fit with GraphPad Prism (Prism 9.0.2, GraphPad Software, San Diego, CA, USA).
Release experiments
Release experiments were conducted as described earlier [53]. In brief, cells expressing the respective transporter were seeded onto poly-D-lysine coated 96 well plates at a density of 30,000 cells per well in a final volume of 200 µL, 24 h before the experiment. The next day, the cells were preloaded with [3H]5-HT (hSERT), [3H]dopamine (hDAT), or [3H]MPP+ (hNET) by incubation with 0.05 µM of the respective tritiated neurotransmitter in KHB for 20 min at 37 °C. Then, the cells were washed twice with KHB supplemented with or without MβCD or cholesterol and incubated for 30 min at 37 °C. Next, the buffer was aspirated, and the cells were washed twice with KHB to remove any MβCD or cholesterol from the buffer. Subsequently, the cells were incubated with various concentrations of d-methamphetamine (METH) or para-chloroamphetamine (pCA) for 10 min at room temperature. Next, the supernatant was transferred to another 96-well plate and 200 µL Ultima GoldTM XR liquid scintillation cocktail was added to the cells and supernatant. The amount of tritium in the cells and the supernatant was assessed with a Wallac 1450 MicroBeta® TriLux liquid scintillation counter. The release of tritiated neurotransmitters was expressed as a percentage of the total radioactivity of cells and supernatant together normalized to the basal efflux of untreated cells. Non-specific release was determined in the presence of 30 µM paroxetine, 10 µM mazindol, or 30 µM nisoxetine for SERT, DAT, or NET, respectively.
Binding experiments
Membrane binding experiments were conducted as previously shown [51, 54]. Membranes for binding experiments were prepared from HEK293 cells stably expressing the respective transporter. The cells were rinsed twice with phosphate-buffered saline (137 mM NaCl, 2.7 mM KCl, 4.3 mM Na2HPO4, 1.5 mM KH2PO4, pH 7.4), harvested, and centrifuged at 400 g for 10 min at 4 °C. The pellets were resuspended in hypotonic HME buffer (20 mM HEPES NaOH pH 7.5, 1 mM EDTA, 2 mM MgCl2) and subsequently freeze-thawed twice using liquid nitrogen, followed by sonication for 10 s. Membranes were collected by centrifugation at 40,000 g for 15 min at 4 °C and resuspended in HME buffer. The membranes were pretreated with 6 mM MβCD, 0.1 mg/mL Chol, or vehicle for 30 min at 37 °C in binding buffer (20 mM Tris-HCl pH 7.5, 1 mM EDTA, 2 mM MgCl2, 120 mM NaCl, and 3 mM KCl). Next, the membranes were incubated with [3H]imipramine for SERT or [3H]CFT for DAT and NET in reactions of 0.3 mL. Nonspecific binding for SERT, DAT, and NET was determined in the presence of 10 µM paroxetine, 10 µM mazindol, and 30 µM nisoxetine, respectively. After 60 (SERT, DAT) or 30 min (NET), the reactions were terminated by rapid washing with ice-cold buffer and the membranes were collected onto glass fiber filters (Whatman GF/B). The samples were then dissolved in liquid scintillation cocktail and the amount of tritium bound to the membranes was determined by liquid scintillation counting.
Whole-cell patch-clamp
HEK293 cells stably expressing hSERT were seeded into poly-D-lysine coated 29 mm dishes (Nunclon™, Thermo Scientific, Denmark) at low density 24 h before the measurement. Substrate-induced SERT-mediated currents were determined as previously described [55, 56]. In brief, cells were voltage-clamped using the whole-cell patch-clamp technique. For recordings of steady-state currents and peak current recovery, glass pipettes were filled with internal solution (133 mM potassium gluconate, 5.9 mM NaCl, 1 mM CaCl2, 0.7 mM MgCl2, 10 mM HEPES, 10 mM EGTA, adjusted to pH 7.2 with KOH, final potassium concentration 163 mM). For recordings of peak currents relaxation rates, glass pipettes were filled with potassium and sodium-free internal solution (NaCl and potassium gluconate were replaced by NMDG chloride adjusted to pH 7.2 with NMDG). During measurements, the cells were continuously perfused with external solution (140 mM NaCl, 3 mM KCl, 2.5 mM CaCl2, 2 mM MgCl2, 10 mM HEPES, 20 mM glucose, adjusted to pH 7.3 with NaOH). Currents were recorded using an Axopatch 700B amplifier and pClamp 11.2 software (MDS Analytical Technologies) at room temperature. For recordings of steady-state currents, cells were voltage-clamped to a holding potential of −70 mV and 5-HT was applied for 5 s with intermittent washing steps of 5 s. For recordings of peak currents relaxation rates, cells were voltage-clamped to a holding potential of 0 mV and 5-HT was applied for 5 s with intermittent washing steps of 5 s. For peak current recovery recordings, cells were voltage-clamped to a holding potential of −70 mV and 10 µM 5-HT was applied for 500 ms followed by increasing washout intervals and subsequent 5-HT test pulses. The resulting current amplitudes in response to the 5-HT application were quantified using Clampfit 10.6 software. For analysis, traces were filtered using a 100-Hz digital Gaussian low-pass filter.
Confocal microscopy
HEK293 cells stably expressing YFP-hSERT, YFP-hDAT, or YFP-hNET were seeded into poly-D-lysine coated 29 mm dishes with 20 mm glass-bottom well (Cellvis, Sunnyvale, CA, USA) at a density of 20,000 cells per dish. The following day, the cell membranes were stained by incubation with 0.4% trypan blue for 1 min as previously described [34, 57,58,59]. Then, the dye was washed off and KHB supplemented with 10 mM MβCD or 0.1 mg/mL cholesterol was added. The dish was mounted above a 60× oil immersion objective on a Nikon A1R+ laser scanning confocal microscope system. Images were acquired using a 12 kHz resonant scanner. YFP was excited by a 488 nm laser line, while trypan blue was excited by a 561 nm laser line; the emission filters 525/50 nm and 595/50 nm were used. The emitted light was collected with a high-sensitivity GaAsP detector. The cells were imaged before and 30 min after the addition of MβCD, Chol, or blank.
FRET imaging
Experiments to assess the potential of membrane cholesterol alterations to induce conformational changes of the MATs were conducted using HEK293 cells transiently expressing a human SERT construct with either a fluorescence donor (CFP) or acceptor (YFP) attached to the N terminus. The cells were seeded into 29 mm dishes with 20 mm bottom (# 1.5 glass; Cellvis) at a density of 105 cells per dish two days before imaging. Before imaging, the cells were treated with MβCD, Chol, or vehicle for 30 min at 37 °C. FRET was measured with an iMIC inverted microscope (TILL Photonics GmbH) equipped with a 60× (1.49 NA) oil objective (Olympus). Fluorescence was excited with a 100 W Xenon Lamp (Polychrome, Till Photonics GmbH). The excitation light was filtered through 436/20 nm (CFP) or 514/10 nm (YFP) excitation filters (Semrock) and directed to the sample by a 442/514 dual-line dichroic mirror (Semrock). The emitted fluorescence light was filtered through a 480/40 nm and 570/80 nm dual emission filter (Semrock) and directed to a beamsplitter unit (Dichrotom, Till Photonics). The emission light was separated spatially according to the fluorescence wavelength using a 515 nm dichroic mirror (Semrock) and the resultant channels (<515 nm and >515 nm) were projected side by side onto an EMCCD chip (iXon Ultra 897Andor). Live Acquisition software (version 2.5.0.21; TILL Photonics GmbH) was used for recording. For optimal noise ratio and dynamic range, the camera was operated in 16-bit mode with a readout speed of 1 MHz. According to the manufacturer’s recommendation, an EM gain of 16 was applied to overcome the noise floor. Two images were taken per set (donor and acceptor emission after donor excitation and acceptor emission after acceptor excitation). Per cell treatment condition, ten sets were recorded on each experimental day and the images were then analyzed using Offline Analysis software (version 2.5.0.2; TILL Photonics GmbH). Background fluorescence was subtracted from each image and one region of interest (part of the plasma membrane) per cell was selected in the CFP channel. The average intensity of each region of interest was used for calculations. HEK293 cells expressing a CFP or YFP signal only were used to determine spectral bleed-through (BT) for the donor (0.57) and acceptor (0.04). Normalized FRET (NFRET) was calculated as follows:
$${NFRET}=frac{{I}_{{FRET}}-{{BT}}_{{Donor}}times {I}_{{Donor}}-{{BT}}_{{Acceptor}}times {I}_{{Acceptor}}}{sqrt{{I}_{{Donor}}times {I}_{{Acceptor}}}}$$
Maximum FRET was determined using a fused CFP-YFP construct [29].
Single-molecule microscopy
The mobile fraction and subunit stoichiometry of mGFP-hSERT were assessed as described previously [30, 41]. Fluorophores were excited at room temperature with 488 nm light from a directly modulated diode laser (LBX-488, installed in L6Cc laser combiner; Oxxius, Lannion, France). Custom-written software in LabVIEW (National Instruments, Austin, TX, USA) was used to adjust illumination intensity and timing. The laser beam was focused onto the back-focal plane of a Plan-Apochromat objective (100×/1.46 NA; Zeiss, Jena, Germany) mounted on an inverted Zeiss Axiovert 200 microscope. Appropriate emission filter sets (FF01-538/685-25; Semrock, Rochester, NY, USA, and zt488/640rpc; Chroma, Bellows Falls, VT, USA) were used to filter emission light. As detector we used a back-illuminated liquid nitrogen-cooled charge-coupled device camera (LNCCD1300-PB, Roper Scientific, Planegg, Germany). The excitation and photobleaching area was restricted by a slit aperture (Owis, Staufen im Breisgau, Germany). Stroboscopic illumination with excitation times of 5 ms was used; samples were excited and bleached in total internal reflection fluorescence (TIRF) mode.
Fluorescence recovery after photobleaching (FRAP) experiments were performed to determine the mobile fraction of mGFP-hSERT. A small area of the plasma membrane (∼50 µm2) was photobleached in TIRF mode and the fluorescence signal was measured every 10 s within a total time interval of 400 s. The data were fitted by a one-phase association curve.
$$I(t)/{I}_{0}={mf}times (1-{e}^{-{Kt}})$$
I0 represents the fluorescence signal before photobleaching, I(t) the fluorescence signal at time t, mf the mobile fraction, and K the recovery rate constant.
As individual single molecule signals cannot be distinguished as well-separated spots at high surface densities, a method referred to as “thinning out clusters while conserving stoichiometry of labeling” (TOCCSL) was applied to examine SERT oligomerization [30, 41, 60]. A prebleach image was recorded and used to assess the surface density of mGFP-hSERT. After 50 ms, an aperture-confined region of the bottom plasma membrane was photobleached for 2000 ms, using a laser intensity of ∼2 kW/cm2. The TOCCSL image was acquired after 15 s recovery time with a reduced excitation laser intensity of 0.4–0.6 kW/cm2 and used for obtaining the probability distribution of single spot brightness values B, ρ(B). To determine the brightness of single mGFP-hSERT molecules, ρ1(B), we repeatedly bleached cells for 200 ms with a laser intensity of ∼2 kW/cm2, resulting in only a few remaining fluorophores. Laser intensities were determined in epifluorescence configuration.
TOCCSL images were analyzed using an in-house algorithm implemented in MATLAB (Mathworks, Portola Valley, CA, USA). Pixel counts were converted to photon counts by offset subtraction and multiplying with the inverse gain; individual diffraction-limited fluorescent signals were fitted by a Gaussian function. The probability distribution of single spot brightness values, ρ(B), was used to determine the oligomeric state of mGFP–hSERT. Applying autoconvolution, the monomer brightness distribution ρ1(B) was used to calculate the expected distributions for dimers ρ2(B) and higher-order oligomers. The overall single spot brightness distribution ρ(B) was then fitted by a linear combination of ρ1(B), ρ2(B), and higher-order oligomers.
$$rho left({{{rm{B}}}}right)={sum }_{n=1}^{{n}_{max }}{alpha }_{n}times {rho }_{n}(B),{{{rm{with; normalization}}}}{sum }_{n=1}^{{n}_{max }}{alpha }_{n}=1$$
Fitting ρ(B) yielded the fractions αn of the different oligomeric states of co-diffusing transporter molecules carrying an active mGFP molecule. To calculate the standard deviations of each analysis, a bootstrapping method was applied, in which 50% of the data were analyzed in 100 repetitions.
Photoclick cholesterol labeling
Photoclick cholesterol (Avanti, Alabaster, AL, USA) is a cholesterol analog with a photo-reactivatable diazirine group and an alkyne group for conjugation to azide by click chemistry [61]. Live cell photoclick cholesterol labeling was performed as described [61]. Briefly, HEK293 cells stably expressing YFP-tagged human SERT were treated with 20 µM photoclick cholesterol for 30 min at 37 °C in the presence and absence of 100 µM excess cholesterol as a competitor. The cells were washed twice with cold PBS and then irradiated under 365 nm UV light for 5 min. Cells treated with 20 µM photoclick cholesterol but not UV-irradiated were used as a negative control. Cells were then harvested and solubilized in lysis buffer containing 1% Triton X-100, 20 mM Tris-HCl (pH 8.0), 150 mM NaCl, 1 mM EDTA, 1 mM sodium orthovanadate, 5 mM NaF, 5 mM sodium pyrophosphate, and a protease inhibitor mixture. YFP-hSERT proteins were immunoprecipitated from cell lysates using GFP nanobody-conjugated agarose beads (GFP-TRAP; Chromotek, Planegg-Martinsried, Germany). Proteins were then released from the beads at 95 °C for 10 min in reduction and alkylation buffer (100 mM Tris-HCl; pH = 8.5, 1% sodium dodecyl sulfate, 10 mM tris(2-carboxyethyl) phosphine, 40 mM 2-chloroacetamide). The click chemistry reaction with released proteins was performed using the Click-&-Go Click Chemistry Reaction Buffer Kit (Click Chemistry Tools, Scottsdale, AZ, USA) with Cy5-azide and copper (II) sulfate according to the instructions with minor modifications. Following the click reaction, proteins were separated on SDS-PAGE gels, and Cy5 fluorescence was detected using a ChemiDoc MP imaging system (Bio-Rad, Hercules, CA, USA). Proteins were then transferred to a nitrocellulose membrane (Thermo Scientific) and immunostained with a rabbit anti-GFP polyclonal antibody (Thermo Scientific) followed by an HRP-conjugated goat anti-rabbit secondary antibody (Thermo Scientific). Chemiluminescence detection was conducted with the ChemiDoc MP system (Bio-Rad) and image analysis was carried out with Image Lab software (Bio-Rad).
Statistical analysis
Experimental data were analyzed using Microsoft Excel and Prism software (GraphPad 10.0.1, Software Inc., La Jolla, CA, USA). Vmax and Km values obtained from uptake experiments were analyzed with two-way ANOVA followed by Dunnett multiple comparisons test. Bmax and Kd values obtained from binding experiments were compared to control using the unpaired t-test. k0.5 values obtained from electrophysiological recordings were analyzed with two-way ANOVA followed by Dunnett multiple comparisons test. Transporter oligomerization effects were analyzed using two-way ANOVA followed by Sidak’s multiple comparison test. *, **, and *** indicate P < 0.05, <0.01, and <0.001, respectively. Changes in transporter efflux were analyzed using two-way ANOVA followed by Sidak’s multiple comparison test, *, **, and *** indicate P < 0.05, P < 0.01, and P < 0.001, respectively. The statistical tests used are given in each figure legend. Values are displayed as the mean and standard deviation. Values of p ≤ 0.05 were considered significantly different.