Animals
Gt(ROSA)26Sortm14(CAGtdTomato)Hze (Ai14, #007908), Cx3cr1tm1Litt/J (#005582), Cx3cr1tm1.1(cre)Jung (#025524), Gt(ROSA)26Sortm32(CAG-COP4*H134R/EYFP)Hze conditional allele (Ai32, #012569) and Csf1rtm1.2Jwp (#021212) mice were obtained from the Jackson Laboratory. Hoxb8IRES-Cre and Hoxb8X-IRES-Cre mice were generated in our laboratory and reported by [11] and [9], respectively. Briefly, Hoxb8X-IRES-Cre homozygous mutant mice contain an X-IRES-Cre allele at the Hoxb8 locus. The X-IRES-Cre allele was generated by replacing six amino acids in the homeobox DNA-binding domain with five alanines and glutamic acid. These mice exhibit the typical pathological grooming behavior originally reported [28]. Csf1r∆FIRE mice were generated in our laboratory (details below), replicating the Csf1r∆FIRE mouse line initially reported in [20].
Generation of Csf1r
∆FIRE mutant mice
Csf1r∆FIRE mutant mice were generated by pronuclear injection with gRNA1(20 ng/µl) and gRNA2 (20 ng/µl) and Cas9 protein (20 ng/µl) in C57BL6/J zygotes. gRNA1 sequence: 5′-GACTTGCGGGGTCAGCAAAC-3′ and gRNA1 sequence: 5′-AGCCCCCAATGAGTCTGTAC-3′. Founders were crossed to C57BL6/J, and their offspring were backcrossed to C57BL6/J mice for at least five times before initiation of experiments.
Flow cytometry cell sorting and analysis
Hematopoietic progenitor isolation and cell sorting
Embryo isolation and dissection were performed as previously described [5, 6]. Fetal livers were dissected from E12.5 embryos and placed on ice in 5% fetal bovine serum (FBS, Atlanta Biologicals) in 1X Hanks’ balanced salt solution (HBSS, Gibco). Fetal liver tissue was pooled according to their respective genotype (i.e., Hoxb8 WT: Cx3cr1GFP/+; Hoxb8IRES-Cre/+; Rosa26CAG-LSL-tdTomato/+ or Hoxb8IRES-Cre/+; Rosa26CAG-LSL-tdTomato/+, Hoxb8 conditional mutant: Hoxb8X-IRES-Cre/conditional; Rosa26CAG-LSL-tdTomato/+), then gently dissociated mechanically. Cells were passed through an 80 µm cell strainer to obtain a single-cell suspension.
Anti-mouse antibodies used consisted of the following: TER-119 PerCP-Cy5.5 (1:50, BioLegend, #116228) and c-Kit PE-Cy7 (1:100, Biolegend, #105814) in 5% FBS/1% BSA/1X HBSS. Cells were incubated with their respective antibody cocktail for 30 min on ice. Cells were counter-stained with 3 µM DAPI in 1X HBSS. WT and conditional mutant Hoxb8 hematopoietic progenitors were defined with the immunophenotype signature of DAPI– Ter119– kithi tdTomato+ GFP+/- or DAPI– Ter119– kithi tdTomato+. Sorted WT and conditional mutant Hoxb8 hematopoietic progenitors were collected in sterile 1X HBSS media before transplantation. Flow cytometry data were obtained using the BD Bioscience FACS ARIA flow cytometry sorter. All FACS data were analyzed with FlowJo_v10.8.1 (Celeza GmbH).
Neonatal microglia cell isolation and cell sorting
Brains of neonatal mice were harvested and processed using the Brain Dissociation Kit for mouse and rat (#130-107-677, Miltenyi Biotec). Briefly, brains were dissected from P0–P4 mice and placed on ice in Dulbecco’s phosphate-buffered saline (DPBS, Gibco). Brains were from mice of the following genotypes (Hoxb8 WT: Hoxb8IRES-Cre/+; Rosa26CAG-LSL-tdTomato/+ or Cx3cr1GFP/+; Hoxb8IRES-Cre/+; Rosa26CAG-LSL-tdTomato/+). Neonatal brains were then enzymatically and mechanically dissociated using the gentleMACSTM Octo Dissociator with Heaters (#130-096-427, Miltenyi Biotec) for 30 min at 37 °C. Cells were passed through a 70 µm cell strainer to obtain a single-cell suspension, followed by debris removal and red blood cell lysis steps. To minimize background signal and false positive signals in our cell sorting procedure, cells were resuspended in Fc block (1:2000, purified CD16/32, Biolegend, #101302) in 5% FBS/1X HBSS for 10 min, 4 °C before cell antibody staining.
Anti-mouse or anti-mouse/human antibodies used consisted of the following: CD45 APC (1:160, Biolegend, #103112) and CD11b Alexa FluorTM 700 (1:160, Biolegend, #101222) in 5% FBS/1% BSA/1X HBSS. Cells were incubated with their respective antibody cocktail for 30 min on ice. Cells were counter-stained with 3 µM DAPI in 1X HBSS. Hoxb8 microglia (DAPI– CD45lo CD11bhi tdTomato+ or DAPI– CD45lo CD11bhi tdTomato+ GFP+) and non-Hoxb8 microglia (DAPI– CD45lo CD11bhi tdTomato– or DAPI– CD45lo CD11bhi tdTomato– GFP+) were sorted from the WT Hoxb8 backgrounds. Sorted microglial cells were collected in sterile 1X HBSS media before transplantation. Flow cytometry data were obtained using the BD Bioscience FACS ARIA flow cytometry sorter. All FACS data were analyzed with FlowJo_v10.8.1 (Celeza GmbH).
Csf1r
∆FIRE microglia isolation and flow cytometry analysis
Microglia isolation was performed as previously described [29]. Briefly, mice were euthanized by isoflurane and perfused with ice-cold 1X HBSS. Mouse brains were homogenized in a 15 mL Dounce homogenizer containing a digestion cocktail of 0.05% Collagenase D (Sigma), 0.1 µg/mL TLCK (Sigma), 0.025 U/mL DNase I (Sigma), and 0.5% Dispase (Roche), then digested at room temperature for 15 min. After centrifugation, cell pellets were resuspended in 5 mL of 30% Percoll/1X HBSS, overlaid with 5 mL 1X HBSS. The 70–30% interphase was collected and washed with 1X HBSS. The cell pellet was resuspended in 10% FBS/1X HBSS for flow cytometry analysis. Cells were stained with CD45 PE (1:100, Biolegend, #147711) and CD11b APC (1:100, Biolegend, #101212) in 1X HBSS on ice for 30 min. Cells were counter-stained with 3 µM DAPI in 1X HBSS. Flow cytometry data were obtained using the BD Bioscience FACSCanto II flow cytometry analyzer. All FACS data were analyzed with FlowJo_v10.8.1 (Celeza GmbH).
Intra-cerebral transplantations
Hematopoietic progenitors
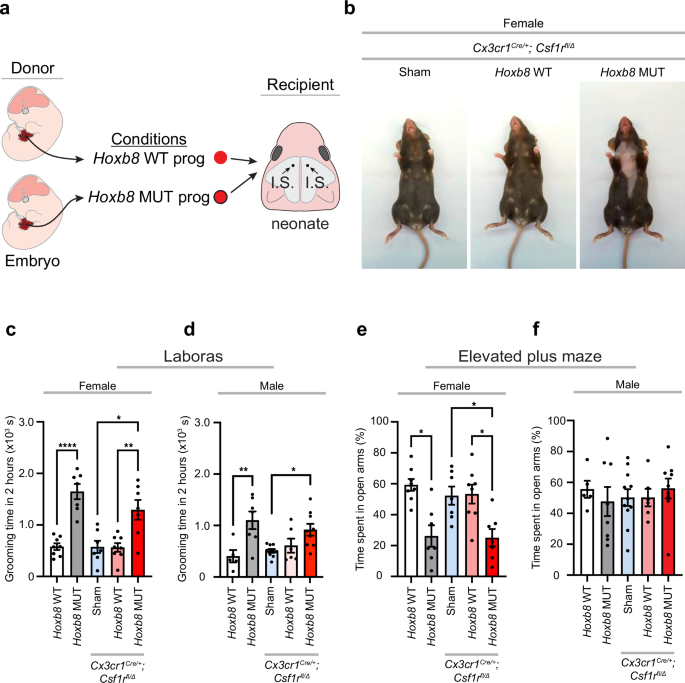
freshly sorted WT or conditional mutant Hoxb8 hematopoietic progenitors (~2.5 × 10⁴ DAPI– TER119– kithi tdTomato+ cells/2–3 µL) or sterile 1X HBSS (sham controls) were transplanted bilaterally into the frontal hemispheres of P1–P4 Cx3cr1Cre/+; Csf1rfl/+ and Cx3cr1Cre/+; Csf1rfl/Δ recipient mice.
Neonatal microglia
freshly sorted WT Hoxb8 (~2.5 × 10⁴ DAPI– CD45lo CD11bhi tdTomato+ or DAPI– CD45lo CD11bhi tdTomato+ GFP+ cells/2–3 µL) and WT non-Hoxb8 microglia (~2.5 × 10⁴ DAPI– CD45lo CD11bhi tdTomato– or DAPI– CD45lo CD11bhi tdTomato– GFP+ cells/2–3 µL) or sterile 1X HBSS (sham controls) were transplanted bilaterally into the frontal hemispheres of P1–P4 Csf1r∆FIRE/+ and Csf1r∆FIRE/∆FIRE recipient mice. For co-transplantation, freshly sorted WT Hoxb8 (~2.5 × 10⁴ DAPI– CD45lo CD11bhi tdTomato+ GFP+ cells/2–3 µL) and WT non-Hoxb8 microglia (~2.5 × 10⁴ DAPI– CD45lo CD11bhi tdTomato– GFP+ cells/2–3 µL) were mixed at the physiological equivalent of 70:30 WT non-Hoxb8:WT Hoxb8 microglia before bilateral transplantation into the frontal hemispheres of P1–P4 Csf1r∆FIRE/∆FIRE recipient mice. As controls, blind injections of total microglia (~2.5 × 10⁴ DAPI– CD45lo CD11bhi tdTomato+/- GFP+/- cells/2–3 µL), irrespective of lineage, were bilaterally transplanted in the same manner.
Cryosectioning and immunofluorescence
Postnatal brain tissue was processed and sectioned as previously described by [5]. For immunofluorescence, brain samples were briefly permeabilized with 0.2% Triton X-100, and 1% Sodium deoxycholate solution, then incubated overnight with a primary antibody mixture at 4 °C. The following day the sections were incubated with secondary antibodies for 2 h at room temperature. Sections were counter-stained with DAPI (D1306, Molecular Probes) and mounted with ProLongTM Diamond Antifade Mountant (P36961, Invitrogen) and microscope cover glass (1419-10, Globe Scientific). Images were acquired on the Leica TCS SP5 confocal microscope and processed and analyzed using Imaris x64 8.0.2 (Bitplane), as described below.
Primary antibodies used: chicken anti-GFP (1:500, GFP-1020, Aves Labs), guinea pig anti-tdTomato-GP-Af430 (1:250, Frontier Institute, AB_2631185), anti-rabbit Iba1 (1:500, Wako, 019-19741), rabbit anti-mouse Tmem119 (1:500, 209064, Abcam), rat anti-P2RY12 (1:200, Biolegend, 848002), and rat anti-mouse CD206 Alexa Fluor 647 (1:200, Biolegend, 141712). Secondary antibodies used: goat anti-chicken Alexa Fluor 488 (1:500, A-11039, Thermo Fisher Scientific), goat anti-guinea pig Alexa FluorTM 555 (1:500, A-21428, Thermo Fisher Scientifc,), goat anti-rabbit Alexa FluorTM 647 (1:500, A-21245, Thermo Fisher Scientific), and goat anti-rat Alexa Fluor 647TM (1:500, A-48265, Thermo Fisher Scientific). Both the primary and secondary antibodies that we have used have been tested for specificity and cross-reactivity.
Surgery implantation and housing
All survival surgeries were performed under aseptic conditions under stereotaxic equipment (Kopf instruments). Mice were anaesthetized using 4.0% isoflurane during induction and maintained at 1.5% throughout the surgical procedure. All surgically implanted mice were housed in individual cages till the end of the experiment. All stereotactic coordinates are in relation to bregma in mm. All mice received unilateral implantation of cannula (PlasticsOne, Roanoke, VA) for the brain region dorsomedial prefrontal cortex (dmPFC). Cannulas were implanted at the following stereotaxic coordinate: mPFC (+1.9 AP, 0.4 ML, −2.0 DV).
Optogenetic stimulation
For optical stimulation common to all behavioral experiments, multimode optical fiber (NA 0.37; 200 μm core; Thorlabs, Newton, NJ) was connected to a 473 nm light source through an FC/PC adapter. The free end of the fiber was connected to the implanted cannula before the initiation of the experiment. Following the experiment, the optic fiber was gently removed and a dust cap was secured on the cannula. The mice were kept back in the home cage to recover from the optogenetic stimulation.
Optogenetic induction of grooming behavior
All grooming behaviors in the experiments were measured by 6 min of video recordings with 2 min of each baseline, optogenetic stimulation and post stimulation condition within the home cage. The home cage environment was chosen for recording in order to ensure that other environmental factors do not affect the experimental outcome. Each experimental subject was pre-conditioned with optic fiber for 5 min before the experiment started. Laser power for the experimental and control subjects ranged between 2.8–7.6 mW for mPFC brain regions. The same laser powers were used to test control versus experimental subjects for the behavioral output. The laser power reported represents the power emerging from the laser light source. After each recording session, the optic fiber was carefully removed until the next experimental session. From the recorded videos, the behavioral phases of grooming were classified into phase III and phase IV if the experimental subject displayed facial grooming (phase III) or body grooming (phase IV). Each individual grooming bout corresponding to phase III and phase IV was scored for every experiment performed within the pre, during and post stimulation conditions for each experimental and control subject for every genotype tested. The latency or the onset of grooming was measured based on the first occurrence of phase III or phase IV grooming bout in response to optogenetic stimulation.
Confocal microscopy
Images were acquired on a Leica TCS SP5 confocal system. Brain sections were imaged for image acquisition with a 10X (0.4 NA, Leica) or 20X objective (0.4 NA, Leica) and 1.0X, 2.0X, or 5X digital zoom. Images were acquired at a 512 × 512 or 1024 × 1024 resolution and 200 or 400 Hz scan speed, using a 2.0 or 5.0 µm z-depth through the tissue.
Imaris image analysis
Images were processed using Imaris Image Analysis Software x64 (v8.0.2, Bitplane). The ‘Spots’ function counted the number of microglia per unit area (mm2). The diameter of the cell soma was set at 15 µm. To further identify the subsets of cells that co-label with Iba1, the spots were filtered using the ‘mean intensities’ of the fluorescence of the marker. The ‘Surface’ function was used to quantify the area of the analysis region.
Behavioral testing and analysis
All behavioral tests were performed between 6:30–10:00 pm, 30 min after the transition from light to dark phase, which begins at 6 pm. Mice were habituated to the behavioral room for 30 min under 0–5 Lux prior to testing acquisition. All tested mice were between 3–5-months-old.
Grooming test
The LABORAS behavioral assay (Metris B.V.) is a fully automated system that monitors specific mouse behaviors based on vibration (e.g., grooming, itching, locomotion, eating, drinking, and rest) and has been used in our laboratory [13]. Briefly, a single mouse is tested per cage and allowed to move freely while the software records the vibrations of their motions and assigns them to distinct behaviors. Illumination was at 0 Lux. To score behavioral phenotypes, mice underwent a two-hour trial once.
Light/dark box
The test apparatus consisted of a box (40 × 40 × 35 cm) divided into a dark, enclosed chamber and an open, brightly illuminated chamber. Illumination was at 600 Lux. To begin testing acquisition, a mouse was placed into the dark chamber (facing the transition opening) and allowed to move freely between the two chambers for 5 min. The total time spent in both chambers was analyzed. To score behavioral phenotypes, mice underwent a 5-min trial once. Animal movement was tracked using AnyMaze software.
Elevated plus maze
The apparatus consisted of four arms that were elevated ~50 cm from the ground: two enclosed by walls and the other with no walls. Illumination was at 100 Lux. Each mouse was acclimatized for 30 min in the testing room. To begin testing acquisition, each mouse was placed at the junction of the four arms with the mouse facing an open arm and allowed to move freely for 5 min as described by [30]. Duration in each arm was recorded by AnyMaze video-tracking software.
Statistical analysis
Data from all experiments were analyzed with GraphPad Prism software v10.0.1 (San Diego, CA). Unpaired t-tests were used for direct comparison between 2 data groups. Standard one-way and two-way ANOVA followed by post hoc analysis using Tukey’s multiple comparisons tests was used to compare multiple data groups. All data are graphically reported as mean ± sem. A P value < 0.05 was considered significant.
Ethics approval
All methods and experiments in this study have been performed on mice. Experimental procedures were approved by the Institutional Animal Care and Use Committee (IACUC) at the University of Utah, Public Health Service Assurance #D16-00018 (A3031-01).