Cell culture
MDCKII cells from the European Collection of Authenticated Cell Cultures (ECACC) operated by Public Health England, catalogue number 00062107, lot 19G037, (tested for Mycoplasma; authenticated before receipt) were cultured in Dulbecco’s minimum essential medium (DMEM) high glucose with 10% FBS (Thermo Fisher Scientific) and 100 μg ml−1 penicillin–streptomycin (Invitrogen) at 5% CO2, 37 °C.
Animal models and PCLSs
All animals were housed under specific pathogen-free conditions and cared for in accordance with the UK Home Office Animals (Scientific Procedures) Act of 1986 and the guidelines set by the Institutional Committees on Animal Welfare, project licence P68983265. Animal experiments received approval from the Ethical Review Process Committee at King’s College London and were conducted under a Home Office licence in the UK.
Ex vivo lung slices were obtained from male and female mice (B6N.219S6(Cg)-Scgb1a1tm1(cre/ERT)Blh/J) from 7 to 17 weeks of age. In brief, mice were humanely euthanized by injectable anaesthetic overdose followed by exsanguination through the femoral artery. The chest cavity was opened and the trachea was carefully exposed, where a small incision was made to accommodate the insertion of a 20Gx1.25 needle in a canula (SURFLO I.V. catheter). The lungs were then inflated with 2% low melting agarose (Thermo Fisher Scientific, BP1360) prepared in HBSS+ (Gibco, 14025). Then, lungs, along with the heart and trachea, were excised, washed in PBS and the lobes separated. Individual lobes were then embedded in 4% low-melting-point agarose and solidified on ice. Slices (thickness, 200 μm) were cut on a Leica VT1200S vibratome, washed and incubated in DMEM/F-12 medium supplemented with 10% FBS and antibiotics overnight (37 °C, 5% CO2). The ex vivo lung slices were imaged 24 h after dissection. Sections were experimentally treated under conditions described below and analysed blinded.
Osmolarity solutions
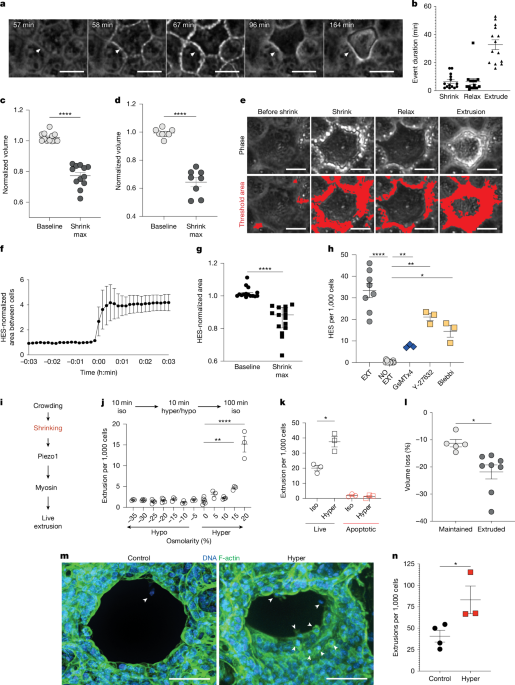
To test which osmolarities could drive LCE, we treated MDCKII cells or ex vivo precision-cut lung slices (both cultured in DMEM) with increasing amounts of d-mannitol (Sigma-Aldrich, M4125-1kg) or nuclease-free water (Ambion, AM9937) to create hyper or hypotonic medium, respectively. Initial DMEM osmolarities were measured using a freezing-point osmometer (Gonotec, Osmomat 3000), ranged from 334 to 368 mOsm kg−1, and were tested biweekly and each time a new batch was prepared.
Immunostaining
Cells were fixed with 4% formaldehyde in PBS at room temperature for 20 min, rinsed three times in PBS, permeabilized for 5 min in PBS containing 0.5% Triton X-100 and blocked for 10 min in AbDil (PBS + 5% BSA). The coverslips were then incubated in primary antibody (in PBS + 1% BSA) overnight at 4 °C, washed three times with PBS and incubated in secondary fluorescently conjugated antibodies. All antibodies were used at a dilution of 1:200 unless otherwise specified: rabbit Piezo1 (Novus, NBP1-78446), mouse S1P (Santa Cruz, sc-48356), rabbit KCNA1 (Alomone Labs, APC-161), rabbit KCNA2 (Alomone Labs, APC-010), rabbit LRRC8A (Alomone labs, AAC-001), mouse ZO1 (Invitrogen, 33-9100), rabbit ENaC antibodies SCNNA1 (Invitrogen, PA1-920A), SCNNB1 (Invitrogen, PA5-28909) and SCNNG1 (Invitrogen PA5-77797). Alexa Fluor 488, 568 and 647 goat anti-mouse and anti-rabbit IgG were used as secondary antibodies (Invitrogen). F-actin was stained using either conjugated 488 or 568 phalloidin (66 μM) at 1:500 and DNA with 1 μg ml−1 DAPI (Thermo Fisher Scientific) in all fixed-cell experiments.
For PLCSs, untreated slices were fixed with 4% paraformaldehyde or after 30 min or 2 h following various treatments, then blocked for 1 h in AbDil at room temperature and then incubated at 4 °C overnight in 1:100 primary rabbit anti-E-cadherin antibody (24E10, Cell Signaling 3195) in AbDil. After three 30-min washes in PBS + 0.5% Triton X-100, the slices were incubated again at 4 °C overnight with secondary antibodies (1:100 Alexa Fluor 488 goat anti-rabbit at (Thermo Fisher Scientific, A11008) + 1:100 Alexa Fluor 568 Phalloidin (Thermo Fisher Scientific, A12380). For live imaging, BioTracker ATP-Red live-cell dye 1:200 (Sigma-Aldrich SCT045) was incubated at 37 °C for 30 min before imaging.
Experiment and quantification methods
Extrusion
Extrusions from time-lapse phase videos of MDCKII cells and PCLSs were quantified by identifying cells that were eliminated from the monolayer or tissue through classical squeezing out from the surrounding monolayer. These cells were then followed backwards in time to quantify cell shrinkage, compared with initiation of extrusion. By contrast, cells that round up, divide and reincorporate into the monolayer were scored as mitoses. The cells that were already eliminated by extrusion at the beginning of filming were excluded from our quantifications.
QPI analysis
QPI acquisition relies on having nearby cell-free areas to measure cell mass. To achieve this, we grew monolayers on small patterned circles within a dish by adhering a silicone laser-cut 100 micromesh disk (Micromesh Array, MMA-0500-100-08-01) onto a non-tissue-culture-treated 35 mm dish (Ibidi, 81151). The dishes were plasma treated with the mesh in place using a chamber (Harrick Plasma, Cleaner PD-32G) applied in a vacuum (Agilent Technologies, IDP-3 dry scroll vacuum pump) for 10 min to create cell growth in a pattern required for quantification (Extended Data Fig. 1a). Immediately after plasma treatment, the silicone mesh was aseptically removed and MDCKII cells were seeded at a density of 128,000 cells per well in a 35 mm microscopy imaging dish (Ibidi, 81151) and incubated at 37 °C for 6 h in DMEM. Before filming, excess cells were removed from unpatterned areas by gently washing twice with DMEM and growing another 48 h.
To image, cells were placed in an on-stage incubator and islands showing the entire cell island boundary and encompassing empty space were filmed on a QPI microscope. A minimum of two images of empty space was used for background correction. Images were acquired every 2 min for 10 h at 37 °C, 5% CO2 and 88% humidity.
The dry mass was then calculated by subtracting the reference images from cells within the island to correct for background. The background was adjusted by subtracting the average phase shift of the empty space from the whole field of view including areas covered by cells. By subtracting the background, we could acquire the island and cell phase shift per image. The phase shift was converted to dry mass using previously established methods11,47 in MATLAB (v.R2022a). Extrusions were quantified from 12 separate islands.
Ca2+ and K+ quantification
MDCKII cells were plated at a density of 28,000 cells per well in a 35 mm microscopy imaging dish (Ibidi, 81156) and incubated at 37 °C overnight or until 60% confluent. Once 60% confluent, cells were transfected according to the manufacturer’s protocol with Lipofectamine 3000 (Thermo Fisher Scientific, L3000001) with genetically encoded Ca2+ indicator GECO (Addgene, CMV-G_GECO1.0, 32447)48 or BLINK2 (Addgene, pDONR-BLINK2, 117075) for 18 h. Transfection medium was removed, and cells were rinsed twice with PBS and incubated in DMEM + FBS until cell-to-cell junctions were mature (72 h). To image, cells were stained with Hoechst (Invitrogen, 1:1,000) in PBS for 10 min at 37 °C, washed twice with PBS and then incubated in DMEM medium in an enclosed incubated stage at 37 °C with 5% CO2 (Oko labs). For capturing Ca2+ changes, time-lapse images were captured every 10 s using a spinning-disk microscope (Nikon, Ti2) for up to 10 h. Images were analysed using a threshold macro (Nikon Elements AR, 5.41.02) to quantify the Ca2+ fluorescence level changes of cells over time that extrude.
The genetically encoded K+ indicator is optogenetically stimulated by blue light to open K+ channels. BLINK2 was activated by selecting the cell as a region of interest (ROI) in Nikon elements and then using a GalvoXY 405 laser at 55% for 300 ms, as any higher caused immediate cell death.
Volume quantification
MDCKII cells were plated at a density of 28,000 cells per well in a 35 mm microscopy imaging dish (Ibidi, 81156) and incubated at 37 °C overnight or until 60% confluent. Once 60% confluent, cells were either transfected according to the manufacturer’s protocol with Lipofectamine 3000 (Thermo Fisher Scientific, L3000001) with cytoplasmic GFP plasmid (Addgene, pEGFP-N1) for 18 h or incubated when mature (72 h) with Calcein-AM dye (Thermo Fisher Scientific, C1430; 10 μM). Transfection medium was removed, and cells were rinsed twice with PBS and incubated in full DMEM until cell-to-cell junctions were mature (72 h). To image, cells were stained with Deep Red Cell Mask (Thermo Fisher Scientific, 1.5:1,000) for 30 min and Hoechst (Invitrogen, 1:1,000) in PBS for 10 min at 37 °C, washed twice with PBS and incubated in DMEM medium in an enclosed incubated stage at 37 °C with 5% CO2 (Oko labs) and 0.4 μm z slices were captured every 10 s using a spinning-disk confocal microscope (Nikon, Ti2) for up to 10 h.
To quantify the volume changes of cells expressing cytoplasmic GFP, images were analysed using a threshold macro (Nikon Elements AR, v.5.41.02) with cell mask membrane-stained boundaries to highlight extrusions. The volume data were normalized to the baseline volume before notable junctional changes or extrusion occurs in Excel (Microsoft) and graphed and analysed using GraphPad Prism v.9.4.1.
To quantify cell shrinkage based on solute content, Calcein-AM fluorescence emission was quantified, whereby decreased fluorescence occurs with cell shrinkage. Calcein fluorescence changes were captured during homeostatic shrinkage, hypertonic induced shrinkage, and in response to ion channel inhibitors and hypertonic treatment. Here, fluorescence data were normalized for each cell to its baseline before homeostatic and or hypertonic induced shrinkage in Excel (Microsoft) and graphed and analysed using GraphPad Prism v.9.4.1.
Serial osmolarity treatment
A total of 0.53 × 10⁵ MDCKII cells was seeded on glass round coverslips (22 × 55 mm; Academy,400-05-21) and grown to confluence (~100 h). Epithelial monolayers were incubated with isotonic DMEM for 10 min, before treating for 10 min with increasing concentrations of hyper or hypotonic medium to induce cell shrinking or swelling, respectively, then with isotonic DMEM for 120 min. Cells were either filmed (see below) or fixed and stained to quantify extrusions. Experiment cell densities were analysed with bright spots macro in NIS Elements General Analysis (Nikon Elements AR, v.5.41.02) using DNA staining to determine cell density per field and phalloidin and DNA to identify extrusions.
Live hypertonic shock
For live imaging following hypertonic shock, MDCKII cells were plated on an 8-well slide (Ibidi, IB-80801) at a seeding density of 10,000 cells per well and incubated for about 72 h until monolayers were confluent with mature cell–cell adhesions. Cells were stained with Hoechst (1:1,000) in PBS for 10 min at 37 °C, washed twice with PBS and incubated in isotonic DMEM medium (with or without inhibitors), placed in a microscope stage incubator (37 °C, 5% CO2, Okolabs) and imaged every 10 s for 2.5 h using a widefield microscope (Nikon, Ti2 specifications are provided below). For live cleaved caspase 3 staining, cells were incubated according to the manufacturer’s instructions (1:200, Incucyte caspase-3/7 dyes) before imaging. All of the experiments consisted of three phases: (1) baseline: 0–10 min, during which the cells are incubated in isotonic medium (with or without inhibitors (Supplementary Table 1) or siRNA knockdown (Extended Data Fig. 3)); (2) hypertonic challenge: 10–20 min, during which imaging is paused while isotonic medium is replaced with 20% hypertonic medium with or without inhibitors before imaging is rapidly resumed to capture shrinkage; (3) effects on extrusion: from 20 min to the end of imaging, during which imaging is paused while replacing 20% hypertonic medium with or without inhibitors is replaced with isotonic medium with or without inhibitors and time-lapse phase imaging is resumed to capture. Thus, contractility appears to suppress cell shrinkage over the next 2 h.
PCLSs were imaged to establish the baseline conditions before treatments. For hypertonic challenge, the slices were incubated in 40% hypertonic solution for 20 min, then transferred to isotonic phase imaging medium for live imaging. The drug treatment effect was imaged right after incubating PCLSs in isotonic medium treated with a combination of oligomycin A and oxamate. The experiments were then quantified for extrusion rates per 1,000 or 10,000 cells over time-lapse videos identified using phase microscopy or for the percentage of shrinkage using lightning assays described below.
siRNA knockdown
Four-siRNA smart pools (Horizon Discovery, L-006210-00-0010 (Kv1.1), L-006212-00-0010 (Kv1.2), L-026211-01-0010 (SWELL1), L-006504-00-0010 (ENaCα), L-006505-00-0010 (ENaCβ), L-006507-01-0010 (ENaCγ) or D-001810-01-20 (non-targeting control)) were prepared in DNase/RNase-free water to a 100 μM stock. Then, 28,000 MDCKII cells were seeded in a 6-well plate for quantitative PCR (qPCR) analysis (Thermo Fisher Scientific, 140675), at 10,000 cells per well of an 8-well slide (Ibidi, IB-80801) for live-cell imaging, or with 53,000 cells per 24-well dish with coverslips (Thermo Fisher Scientific, 142475) for extrusion quantification, and grown overnight until 60% confluent. Cells were then transfected using the RNAi Max kit (Thermo Fisher Scientific, 13778150) and 1 μM siRNA for 24 h before replacing with fresh DMEM for 48 h. Cell knockdowns plated for qPCR with reverse transcription (RT–qPCR) analyses were lysed for RNA extraction using the RNAeasy kit (Qiagen, 74104) according to the manufacturer’s instructions. RNA (1 μg) was purified with 1 μl of 10× DNase I reaction buffer, 1 μl of DNase I amplification and RNase-free water in a final volume of 10 μl. The samples were incubated for 10 min at 37 °C, then the reaction was deactivated with 1 μl of 0.5 M EDTA for 10 min at 75 °C. The samples were stored at −20 °C or directly processed by RT–qPCR using the Brilliant III Ultra-Fast SYBR Green QRT-PCR Master Mix (Agilent Technologies), using primers designed with SnapGene (v.6.1.1) and produced by Sigma-Aldrich (Extended Data Fig. 3b). Reactions were analysed using the ViiA 7 Real-Time PCR System (Thermo Fisher Scientific) using the following cycle conditions: 50 °C for 10 min, 95 °C for 3 min, followed by 40 cycles at 95 °C for 15 s and 60 °C for 30 s. Results were normalized to GAPDH expression and graphed and statistically analysed using GraphPad Prism v.9.4.1. Extrusion rates were quantified per 1,000 cells using time-lapse phase microscopy and the percentage of shrinkage was determined using the lightning assay as described below.
Lightning assay
To expedite analysis of cell shrinkage after modulation of different channels, we used the lightning assay. Regions of interest were cropped from phase-microscopy time-lapse videos, thresholding the phase-bright junctional intensity based on white-light detection before, during and briefly after extrusion. The threshold was set to capture the area changes around the cells in the frames before HES or OICE. The same threshold was applied to all frames of the video until completion of cell extrusion. This same method was used for both single cell and whole regions of crowding in an 85 μm2 (400 px by 400 px) area. Data were then normalized in Microsoft Excel (v.16.67) using an average of 10 frames before lightning and analysing the peak percentage change, and then graphed and statistically analysed using GraphPad Prism v.9.4.1.
Depolarization
A total of 128,000 MDCKII cells per 35-mm dish was grown around 72 h to maturity and then stained with DiBAC4(3) according to the ‘Tracking transmembrane voltage using DiBAC4(3) fluorescent dye (PDF)’ protocol (https://ase.tufts.edu/biology/labs/levin/resources/protocols.htm).
Monolayers were then treated with DMSO (vehicle), 4-AP or amiloride, and imaged (phase and GFP settings) every 10 s for a minimum of 2.5 h. PCLSs were time-lapse imaged after incubating with 1:500 DRAQ5 fluorescent probe solution (5 mM, Thermo Fisher Scientific, 62251), 1:500 ATP and 1:1,000 DiBAC4(3) in HBSS for 30 min at 37 °C according to the manufacturer’s instructions. DiBAC4(3) was refreshed at each medium/treatment change.
All of the images were analysed using Nikon Elements AR (v.5.41.02) using a ROI over any cell that was maintained or extruded. The ROI mean intensity of DiBAC4(3) in each cell over time was normalized in Excel using 10 baseline frames before the shrink and depolarization over time was graphed in GraphPad Prism v.9.4.1. Cell counts were then plotted and analysed in Graph Pad Prism v.9.4.1.
ATP measurements
ATP levels were followed in both MDCKII cells and PCLSs using ATP-Red or Queen37. In total, 10,000 MDCKII cells were seeded per well of an 8-well slide (Ibidi, IB-80801) and grown to maturity. ATP levels were analysed after transfection (as described above) of the genetically encoded ATP indicator Queen37 (Addgene pN1-QUE37C, 129318) and or stained with ATP-Red live dye. Transfected cells were counterstained with ATP-Red (10 μM) for 30 min at 37 °C and washed twice with PBS, and then incubated in DMEM medium in an enclosed incubated stage at 37 °C with 5% CO2 (Oko labs) and 0.4 μm z slices were captured every 2 min using a spinning-disk microscope (Nikon, Ti2) for up to 3 h. Images were analysed using a threshold macro (Nikon Elements AR, v.5.41.02) to quantify the fluorescent changes of cells expressing Queen37 and ATP to highlight changes before extrusions. The fluorescence data were normalized to the baseline levels before depletion and extrusion in Excel (Microsoft) and graphed and analysed using GraphPad Prism v.9.4.1.
Further time-lapse experiments with mature MDCKII cells grown to confluency were incubated with live with ATP-Red, DiBAC4(3) (as previously described), or CoroNa green AM (described below in the crowding subsection) with or without the ATP inhibitors oligomycin A or oxamate (Supplementary Table 1), or treated with Piezo1 inhibitor GsMTx4, or supplementing with glucose with addition of DMEM with high glucose.
Moreover, PCLSs were time-lapse imaged incubated with 1:500 DRAQ5 Fluorescent Probe Solution (5 mM, Thermo Fisher Scientific, 62251) and 1:500 ATP-Red in HBSS for 30 min at 37 °C according to the manufacturer’s instructions with or without the ATP inhibitors oligomycin A or oxamate (Supplementary Table 1). Imaging was performed in glass-bottom 24-well plates (Ibidi, 82427), with a glass coverslip placed on top to prevent drifting during 4 h imaging sessions at 5 min intervals.
Crowding
MDCKII cells were seeded at 128,000 cells per well in a uniaxial stretched (25%) 10 cm3 PDMS chamber (Strexcell, SC-0100) and grown ~72 h to confluence and junctional maturity. Once mature, monolayers were stained with the Na+ indicator CoroNa green AM (Thermo Fisher Scientific, C36676 at 10 μM), ATP-Red live-cell dye at 10 μM and cell mask according to the manufacturer’s instructions. The cells were then imaged at homeostatic density or after crowding by releasing monolayers from stretch with or without the ATP inhibitor oligomycin A. Here, fluorescence data were normalized to a previous measurement taken before crowding, or to an earlier timepoint before corresponding homeostatic timepoints that match time of crowding, for each cell. Na+ and ATP fluorescence changes and extrusion rates were quantified in Excel (Microsoft) and graphed and analysed using GraphPad Prism (v.9.4.1).
Microscopy equipment
QPI
Time-lapse QPI and brightfield images were collected on the Olympus IX83 inverted microscope (Olympus) using a ×40/0.75 NA objective. The samples were illuminated using red LED light (623 nm, Thorlabs, DC2200) for 120 ms exposure with a QWLSI wavefront sensing camera (Phasics SID4-4MP), driven by Micro Manager open-source microscopy software. The samples were incubated with a stage-top incubator (Okolabs) set at 37 °C temperature with 5% CO2 gas and 95% humidity.
Widefield imaging
Time-lapse phase and fluorescence images were captured on the Nikon Eclipse Ti2 system using a Plan Fluor ×20 Ph1 DLL NA = 0.50 objective with a Photometrics Iris 15 16-bit camera and a Cool LED pE-4000 lamp driven by NIS Elements (Nikon, v.5.30.02).
Spinning-disk microscopy
Images were captured on the Nikon Eclipse Ti2 system using Plan Fluor ×20 or ×40 0.75 air objectives or Plan Fluor ×60 or ×100 1.40 oil objectives with an iXon 888 Andor 16-bit camera, a Yokogawa CSU-W1 confocal spinning-disk unit and a Toptica photonics laser driven by NIS Elements (Nikon, v.5.21.03). For blue-light optogenetic stimulation, a Galvo-meter XY (Brunker) 405 laser was used with the Ti2 microscope. Cell staining with phalloidin and Hoechst were quantified for extrusions per 1,000 or 10,000 cells using Nikon Elements Software.
Statistics and reproducibility
For statistical analysis, all experiments were repeated independently on at least three separate days to capture variation in the biological replicates. The minimum sample size was determined according to the standards in the field and based on previously established calculations49. This includes graphed data and representative data such as pictures and micrographs. Data were analysed using GraphPad Prism v.9.4.1 statistical software to measure normality with the Shapiro–Wilk test and significance using unpaired and ratio paired t-tests (all t-tests were performed with two-tailed analysis), two-way ANOVA with Tukey’s or Šidák’s correction, or one-way ANOVA with Dunnett’s or Welch multiple-comparison correction, as described in the figure legends. To reduce bias, we imaged random fields within the middle or crowded areas of glass coverslips for quantification or the centre of an 8-well dish (Ibidi, 80806) for live-cell shrink experiments. We excluded low-density epithelia (fields with less than 2,000 cells) that are not crowded enough to elicit extrusion. Graphs were generated using GraphPad Prism v.9.4.1. Figure layouts and models were created in Adobe Illustrator (v.26.3.1). As much of the data analyses were done by the person running the experiments, it was not possible to blind all analysis. However, findings were confirmed with other author investigators who were blinded to the analysis. Further, most analyses and data collection depended on software capture of predetermined set parameters of fluorescence or white light from cell dyes and/or genetically encoded probes or phase microscopy. As the parameters were set on the basis of controls, the data collection was semi-automated and therefore not collected without bias.
Reporting summary
Further information on research design is available in the Nature Portfolio Reporting Summary linked to this article.