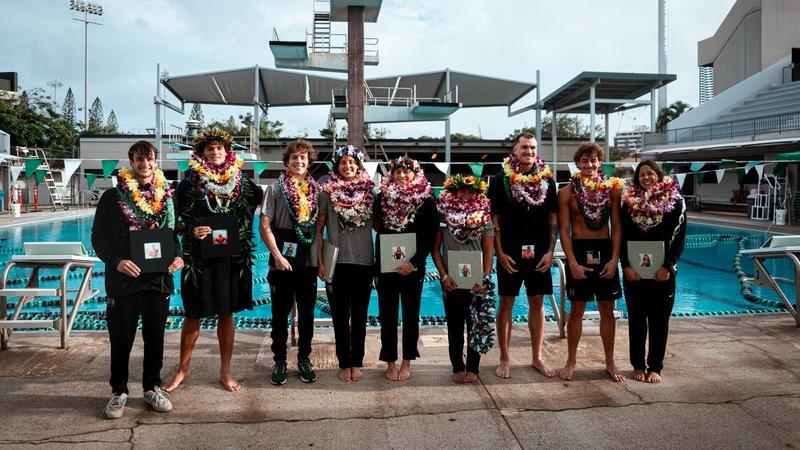
Las Vegas traded slot machines for spreadsheets at the PayrollOrg Leaders Conference from September 14–17, 2025. The annual event drew payroll professionals from across the country to explore multiple educational tracks, including the rising role of payroll analytics—not just as a compliance tool, but as a strategic asset.
With modules focused on turning raw data into actionable insights, the conference spotlighted how payroll teams can drive smarter business decisions. “Analytics is telling a story with data and making that data sing or talk,” reasoned Candace White, “Foundations of Payroll Analytics” program facilitator and director of Payroll Administration and Training for PayrollOrg.
What Are Payroll Analytics?
At its core, payroll analytics is the process of collecting, analyzing, and interpreting data related to an organization’s payroll operations. This goes far beyond simply processing payments. It’s about transforming raw data—such as salaries, hours worked, bonuses, and tax deductions—into meaningful insights that drive strategic business decisions. By leveraging tools and techniques from business analytics, payroll professionals can uncover trends, pinpoint inefficiencies, and forecast future costs.
This allows payroll to transition from a routine administrative function to a strategic one. By integrating payroll data with information from human resources (HR) and finance, professionals can gain a holistic view of the workforce, helping to improve everything from employee retention to financial planning.
The Business Analytics Process and Its Levels
Business analytics is a systematic process of using quantitative methods to analyze data and make informed business decisions. This process has different levels of maturity, from basic reporting to advanced optimization.
- Standard Reports: Simple, static reports that answer “what happened?”
- Ad Hoc Reports: Customizable reports that address specific questions, such as “how many?”
- Query Drilldown: Interactive analysis to pinpoint the exact location of a problem.
- Alerts: Proactive notifications when certain conditions or thresholds are met.
- Statistical Analysis: Investigating the root cause by answering “why is this happening?”
- Forecasting: Projecting future outcomes based on historical trends.
- Predictive Modeling: Using advanced statistics to predict future events with greater accuracy.
- Optimization: Determining the best course of action to achieve a specific goal.
Three Types of Business Analytics
In the real world, these levels of maturity are applied through three main types of analytics:
- Descriptive Analytics: The most fundamental type, it looks at historical data to understand past events. This is the “what happened?” phase. For example, a business can use descriptive analytics to confirm a spike in overtime costs is due to short staffing during peak hours.
- Predictive Analytics: This uses statistical models and historical data to forecast future outcomes. It answers the question, “what might happen?” For example, an organization could use predictive analytics to analyze past data on departing employees and predict which current employees are at a high risk of leaving, allowing HR to intervene proactively with targeted retention efforts.
- Prescriptive Analytics: The most advanced type, it uses optimization and simulation to recommend specific actions that will lead to the best possible outcome. This answers the question, “what should we do?” For example, a retail company could use prescriptive analytics to determine optimal staffing levels to minimize overtime costs while ensuring customer service needs are met.
The BADIR Framework and the RACI Matrix: Tools for Success
For a business to leverage analytics effectively, it needs a clear framework for defining roles and responsibilities. The conference highlighted two key tools for this: the BADIR framework and the RACI matrix.
The BADIR framework is a structured, five-step process that helps organizations use data to solve problems and make effective decisions. The acronym stands for:
- Business Question
- Analysis Plan
- Data Collection
- Insights
- Recommendations
Complementing this process is the RACI matrix, a powerful tool for clarifying roles and responsibilities during a project or process. RACI is an acronym for the four key roles: Responsible, Accountable, Consulted, and Informed. By applying the RACI matrix to an analytics project, an organization can ensure everyone knows their role, preventing confusion and ensuring accountability from the beginning of a project to its completion.
Payroll Analytics for Compliance
Utilizing payroll analytics is crucial for businesses to ensure compliance by providing a clear view of their data, helping them proactively identify and fix issues before they lead to costly penalties or legal action.
- Proactive Issue Detection: Analytics can automatically flag discrepancies that would be difficult to find manually, such as incorrect overtime calculations, misclassifications of employees, or unusual tax withholdings.
- Ensuring Fair and Accurate Pay: By analyzing pay data, a business can identify potential pay equity issues and ensure all employees are being paid fairly and in accordance with the law.
- Audit Readiness: Analytics provides a clear, defensible paper trail showing how pay and benefits were calculated, demonstrating due diligence and reducing the risk of penalties.
- Monitoring Leave and Benefits: Payroll analytics can track paid leave, sick time, and family leave usage to ensure compliance with a variety of paid leave laws.
Navigating the Barriers to Effective Analytics
Despite the clear benefits, implementing and using analytics is not without its challenges. The conference highlighted several key barriers, often rooted in data, culture, and skills. However, professionals can navigate these obstacles with a targeted approach.
- Data Silos and Quality: Fragmented data across different systems, such as HR, finance, and payroll, makes it difficult to get a complete, accurate picture. Organizations can overcome this by investing in a unified payroll system or by using APIs to enable disparate systems to “talk” to each other, creating a more cohesive data set.
- Lack of a Data-Driven Culture: Many organizations still rely on intuition over data. Building a data-driven culture requires buy-in from the top down. Leadership must champion the use of data in decision-making and reward those who do. It also involves starting small with pilot projects that demonstrate the value of analytics to build momentum and trust.
- Skill Gaps: Without proper training, professionals may not have the skills to interpret data correctly, leading to flawed analysis and potential pitfalls. To address this, companies can invest in upskilling their current employees through training programs, workshops, and certifications.
- Integration Challenges: When different platforms don’t communicate with each other, a comprehensive view of the workforce is nearly impossible to achieve, limiting the scope of analysis. Organizations must prioritize solutions with robust integration capabilities. When evaluating new software, a key question to ask is, “How easily does this system integrate with our existing HR, finance, and time-tracking platforms?”
These steps underscore the importance of investing not just in technology but also in the people and processes needed to build a truly data-fluent organization. By doing so, companies can harness the power of analytics to move beyond simple reporting and unlock a new level of strategic insight.
Take your tax and accounting research to the next level with Checkpoint Edge and CoCounsel. Get instant access to AI-assisted research, expert-approved answers, and cutting-edge tools like Advisory Maps and State Charts. Try it today and transform the way you work! Subscribe now and discover a smarter way to find answers.