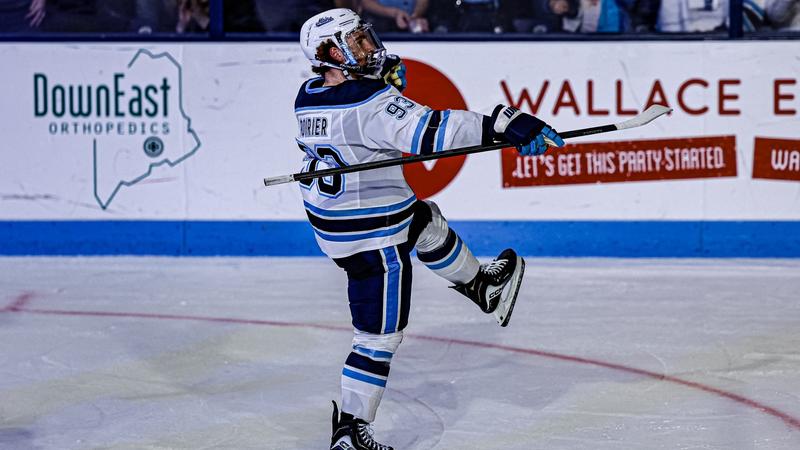
The Study’s main goal was to assess date syrup metabolome in the context to its nutritive, aroma, and secondary metabolites via a multiplex approach of GC-MS and UHPLC-MS techniques, and visualized using chemometrics, to classify among different syrup products (D1-D7), see Table S1.
Primary metabolites profiling of date syrup via GC-MS analysis (Post-Silylation)
Post-silylation GC-MS analysis was employed to assess differences in primary metabolites among date syrup products mediating their nutritive value and sensory attributes. Seven Egyptian and Saudi Arabian commercial date syrup products were examined, and their codes are explained in (Table S1). Three separate technical specimens were used to evaluate the technical variance for each date preparation (Fig. 1). A total of 36 peaks (Table 1) were identified, including sugars (mono- and disaccharides), sugar alcohols, fatty acids/esters, alcohols, organic acids, and nitrogenous compounds. Figure 2 shows the percentage of major metabolite classes in date syrup samples. As expected, sugars amounted for the major class and mirroring metabolite composition in date fruits19.
Representative GC-MS chromatogram of silylated metabolites in dates syrup samples.

A bar chart illustrating the percentage of major metabolite classes in date syrup samples.
Sugars
Sugars were detected as the most dominant primary metabolite class as expected considering that date fruit is a chief carbohydrate source30. Sugars were represented by 27 peaks of sugars and sugar alcohols amounting to 97.04%, ensuring a good preservative effect on the date syrup products and shelf life31and justifying their use as a natural sweetener in different recipes.
Mono-sugars predominated all syrup products detected at 90–94%, posing them as instant sources of energy32 except one sample obtained from Saudi Arabia (D2) and two samples from Egypt (D3 & D6) which showed lower levels at 56–66%. Next to mono-sugars, di-sugars were most abundant in D2, D3, and D6 at 30–40%, compared to others in which it reached ca. 2.52%. Such higher levels of mono-sugars in the products, coupled with lower levels of di-sugars compared to D2, D3 & D6, may suggest that they were subjected to more extensive hydrolysis using higher temperature or prolonged time during processing. Conversely, the higher di-sugars content in D2, D3, and D6 may indicate possible addition of sucrose to improve taste or shelf life.
The most abundant mono-sugars included fructose, talose, and glucose, and following our previous report on date fruits19. Fructose (peaks 15, 16) was detected as the main sugar at considerably higher levels of 43–48% in all products except D2, D3, and D6 imparting a notably sweet taste. Talose (peak 18) was the second major sugar detected at a range of (19.42–31.68%). While glucose detected in peaks 19 & 21 ranged from ca. 7% in D2, D3 and D6 samples to ca.11% in the remaining samples.
Allose (peak17), the non-caloric sweetener was found to be exceptionally high in D3, D6, and D7 compared with other date syrup products at 5.48–8.15%, respectively. Compared to mono-sugars, the most abundant di-sugar was found to be sucrose at the highest level in D2 (29.28%) compared to ca. 1% or less in the other products. The sugar profile poses D3 and 6 as the products with the best-balanced sweetness due to their higher maltose and allose coupled with lower fructose levels.
Such a high concentration of simple sugars poses date syrup as an instant energy source is similar to date fruit, albeit, is deprived of the high fiber blessing of the fruits33 that slows down sugar absorption34. The observed variation in sugar contents among the examined syrup could be explained based on dates’ type, cultivar, degree of maturation, processing conditions, andor addition of sweeteners during preparation. As soft date cultivars (e.g., Saidy and Barhi) are predominated with fructose and glucose with traces of sucrose, whereas dry cultivars (e.g., Deglet Beidha and Noor) contain higher sucrose levels, and others (e.g., Halawy, Khadrawy, Sayer, Zahidi) contain mixed sugars35. The ratio of fructose to sucrose differs widely among cvs. ranging from 3.3 to 6.5 and reaching as low as ca. 0.3 in some dry cultivars36. Considering the stage of maturity, at the early Rutab stage, sucrose constitutes ca. 60% of the dry weight of date, while fructose increases during other stages and reaches its maximum in Tamr stage due to the high invertase activity. Considering that date syrup is mainly prepared in the Tamr and Rutab stages, fructose was the main detected sugar as expected in most of the products. D2 exceptionally high sucrose level could be either due to the date cultivar, stage of maturity or adulteration, hence at least cvs and stage of maturity of the utilized date fruits should be stated on the product label. Whether these date syrups were subjected to pectinase treatment if prepared from high fiber cvs. type8 has yet to be determined.
In contrast to free sugars, sugar alcohols were detected at lower levels in all syrup products represented by mannitol (peak 36) and inositol (peak 35) ranging from 0.8 to 3.3%. Mannitol, the low glycemic index sweetener, was detected at 0.68-3%. While inositol was previously detected in dates19.
Dates have been traditionally used to treat diabetes mainly because of its high fructose level, in addition to other phytochemicals such as anthocyanins and flavones6. Nearly all examined products appear suitable for diabetic patients due to their high fructose and mannitol content compared to glucose and sucrose except D2, which has yet to be confirmed by measuring the increase in post-prandial sugar levels post-consumption in animals or ideally human trials.
Fatty acids/esters
Fatty acids/esters were detected at very low levels in date syrup with the highest content in D1 and D5 products obtained from Egypt at 0.2%. Both saturated fatty acids, e.g., palmitic acid (peak 5), stearic acid (peak 7), and monounsaturated fatty acids (MUFA) e.g., octadecadienoic acid (peak 6), as well as palmitic acid were annotated at trace levels of less than 0.1% each. Such low levels of fatty acids mirror that in fruits, especially in the tamr stage37and suggestive that most of these syrups were prepared from fruits at tamr ripening stage. Several saturated fatty acids, MUFA, and polyunsaturated fatty acids (PUFA) previously detected in the Egyptian dates fruit were absent or detected in trace levels in the syrup including palmitic, oleic, linoleic and linolenic acids19 likely attributed to the processing conditions which start by extraction with water, leaving behind most of non-polar metabolites8.
Organic acids/alcohols
Organic acids, represented by fumaric acid (peak 1) and citric acid (peak 2), were detected at trace levels (lower than 0.12%) in most date syrup, with D2 being the most enriched. Compared to date syrup, the percentage of organic acids in fruits is much higher, imparting a sour taste in fruits, especially the unripe fruits19and confirming that the syrup was prepared from fully mature fruits. On the other hand, alcohols were detected at higher levels in syrups (2.2–3.97%) represented by diethylene glycol (peak 3) and glycerol (peak 4).
Multivariate PCA, HCA and OPLS-DA analyses of GC-MS silylated dataset
Unsupervised multivariate data analysis PCA and HCA of date syrup products
The comprehensive evaluation of primary metabolite heterogeneity among commercial date syrup products was further conducted using chemometric tools. This was done considering the notable number of peaks that were found as variables in 7 selected products, each of which is represented by three technical replicates, for a total of 21 date syrup products.
The unsupervised HCA (Fig. 3A) depicted that D2, D3, and D6 were clustered together, while D1, D4, D5, and D7 were in another cluster. D2 individual clustering from all syrup products is attributed to its richness in sucrose (ca. 29%). D3 and D6 separate clustering can be linked to their richness in maltose, and gentiobiose as revealed from GC-MS analysis (Table 1), and suggestive for different sugar profiles among syrup preparations. PCA model prescribed by PC1 and PC2 accounting for 42% and 28% of the variance, respectively, (Fig. 3B) showed D2 as clearly segregated on the lower left side, whereas D3 and D6 were positioned in the upper left quadrant. Nonetheless, a clear overlap between the independent technical replicates was noted in the remaining products. Sugars (maltose, gentiobiose, sucrose, allose, talose, and fructose) accounted for specimens’ segregation as revealed from PCA loading plot. D2 was enriched in sucrose, versus the richness of D3 and D6 in di-sugars i.e., maltose and gentiobiose. D1, D4, D5 and D7 clustering was mainly associated with their richness in their mono-sugars (Fig. 3C). To improve separation, supervised OPLS-DA analysis was further used to reduce the variance between replicates for every sample.

GC-MS based HCA and PCA of primary metabolites from date syrup samples (n = 3). (A) HCA plot. (B) Score plot of PC1 vs. PC2 scores. (C) Loading plot for PC1 & PC2 contributing metabolites and their assignments. The metabolome clusters are located at the distinct positions in two-dimensional space described by two vectors of principal component 1 (PC1) = 42% and PC2 = 28%.
Supervised multivariate data analysis OPLS-DA
In an effort to distinguish between the products’ independent replicates and to further identify metabolite markers responsible for segregation of D2, D3, and D6, as determined using unsupervised HCA and PCA (Fig. 3), supervised OPLS-DA (Fig. S1A) was carried out. D2, D3, and D6 were modeled in one class against different products via supervised OPLS-DA. The high prediction power was indicated by the developed model’s good sample separation, R2 (98.6%), and Q2 (96.5%) (Fig.S1). The segregation of D2, D3, and D6 from all other products was evident in OPLS-DA score plot. Di-sugars (viz. maltose, gentiobiose, sucrose, and cellobiose) were the primary discriminators of D2, D3, and D6 as revealed from OPLS-DA loading S-plot (Fig. S1B), and in accordance with GC-MS results (Table 1), posing such samples as better sources for sustained energy32. In contrast, mono-sugars viz. fructose and talose were responsible for segregation of D1, D4, D5 and D7 (Fig. S1B) posing them as better instant energy sources32and suggestive for di-versus mono-sugars abundance in date syrups. With a p-value of less than 0.05, the permutation test was used to validate the developed OPLS-DA model and confirm that it is statistically significant (Fig. S2). ANOVA was performed on the most discriminatory metabolites (Table S2) revealing significant differences in their content in the studies samples with a confidence level of 95% i.e. Fructose (5TMS) level was significantly higher in D1 and D5 samples, however, talose (5TMS) level was significantly higher in D1, D4 and D5 samples. D3 and D6 samples showed the highest significant levels of gentiobiose (8TMS), Maltose (8TMS) isomer at P ≤ 0.05.
Aroma profiling of different date syrup products via SPME–GC–MS
Considering date syrup-rich aroma and to discern whether there is a unique aroma profile for certain syrup preparations versus others, and further how date syrup aroma compares to its date fruit, headspace–solid-phase micro-extraction (HS-SPME) was employed as a cold extraction technique for aroma collection38. Differences among commercial products were evident in terms of the quantity of volatile compounds rather than their composition. A representative chromatogram is shown in Fig. 4A. The major detected volatiles mainly belonged to three chemical classes, viz. furans, alcohols, and esters, along with five classes detected at trace levels viz. acids, hydrocarbons, aldehydes, pyranones, and pyrroles (Table S2, Fig. 4B). A total of 17 volatile compounds were detected, namely 5 alcohols (38.71%), 4 furans (42.15%), 2 acids (2%), 2 pyrroles (2.86%), in addition to an aldehyde, ester, hydrocarbon and pyranone (Table S2). The identified constituents represented ca. 87.68%of the total date syrup aroma. Furans amounted to 24.3–55.5% of syrup products’ aroma likely derived from sugar oxidation upon heating, followed by alcohols amounting to 16.6–67.7%. Furans were the most abundant class in all products except in D2 and D3 where alcohols predominated at 61.43 and 67.71%, respectively. Acids constituted 1.3–3.2% with the highest percentage in D2.

Representative GC/MS chromatogram of volatile metabolites in date syrup samples (A), bar chart illustrating the percentage of major volatile metabolite classes in date syrup samples (B).
Furans were dominated by furfural and 5-hydroxymethylfurfural (5-HMF) to likely impart almond-like odor39 mixed with mild-sweet caramel aroma40. Furfural was detected in all products ranging from 14.7 to 22.5% in D1, except in D3 only (ca. 7%). Such hypothesis was confirmed from 5-HMF detected at 24-30.4%, except in D2 and D3 (ca. 9.8 and 16.4%, respectively) suggestive of either no thermal heat application in the latter products or their treatment to remove furans. Chiefly, Furfural and HMF are formed during concentration, and storage via the Maillard reaction due to the effect of heat on reducing sugars, and to serve as quality indicators for both preparation and storage conditions. Several approaches have been developed to minimize or remove 5-HMF from foods, e.g., UV irradiation, vacuum treatment, yeast fermentation, non-thermal processing, microwave heating41and gamma irradiation42. Compared to date syrup, furans in fruits were detected at low levels (1–3%) confirming that their formation is during processing and storage43.
Alcohols were dominated by 3-hexen-1-ol (peak 4), isopropyl alcohol (peak 3), and 4-penten-2-ol (peak 5). The most abundant alcohol was 3-hexen-1-ol imparting green aroma in green tea44with the highest amount in D3 and D2 (48–58%), while D1 showed the lowest level at 11.85%. Moreover, isopropyl alcohol was detected only at higher levels in D2, D4, D5, and D3 (6–10%), which may impart a disagreeable aroma in these preparations7. D1, with its high 5-HMF and low isopropyl alcohol content, provides the best sensory attributes, having a sweet aroma opposite to D3. While the highest amount of 4-penten-2-ol, was detected in D6, D7, and D4 at 5–7%, versus 1–2% in remaining products. Although 3-hexen-1-ol and 4-penten-2-ol were not reported in date fruit aroma, their analog compounds viz. 2-hexenal, 3-hexenal, hexanal, 1-hexanol, 1,4-pentadien-3-ol, and isopentanol were detected7,43while isopropyl alcohol was previously reported as a component of date fruits aroma45. Such volatiles may also be derived either from lipid peroxidation or Maillard reactions of amino acids during syrup processing. Alcohols and furans exert antibacterial qualities that improve food safety and preservation46,47in addition to enhancing flavor. As previously reported, esters amount for major class in date fruits imparting fruity odor37. Likewise in syrup, an unknown ester was detected (peak 8) with the highest levels in D1, D6, and D7 (20–28. %).
The detected volatiles, especially alcohols, aldehydes, and esters, are likely to contribute the most to date syrup aroma profile. Compared with the rich aroma of date fruit revealed in our previous study43its composition greatly varied in the case of syrup. As observed, several compounds were not detected, especially terpene hydrocarbons, oxygenated monoterpenes, benzenoids, in addition to many esters, aldehydes, alcohols, and acids. While others appeared viz. furfurals, pyranones and pyrroles likely during thermal heating of date syrup. Compared to aroma of date palm fruit, syrup can vary based on more factors such as the type of date fruit, processing techniques, and storage conditions. Different processing methods utilized e.g., thermal, hydraulic pressure, microwave, ultrasound, and ohmic heating, greatly influence the produced syrup33and should be compared in the context of syrup metabolite profile to identify best methods in the preparation.
Multivariate data analyses of date syrup products’ aroma profile
To compare the classification power of nutrients in date syrup viz. sugars likely to serve as precursors for date syrup aroma, it was of interest to classify date syrup based on its aroma profile. HCA and PCA (Fig. 5) were employed to assess heterogeneity in the volatile distribution of date syrup products. The HCA dendrogram (Fig. 5A) revealed two separate clusters, with syrup products (D2, D3 & D4) clustered in group 1 versus (D1, D6 & D7) in group 2. The PCA score plot of the date syrup aroma profile dataset (Fig. 5B) accounted for 81% of the total variance. The segregation of D6 and D7 in one cluster on the upper left side and D1 and D5 in another cluster on the lower left side was demonstrated by the PCA model. The loading plot (Fig. 5C) revealed that alcohols (3-hexen-1-ol and isopropyl alcohol), furans (viz.5-hydroxymethyl furfural), and esters accounted for such segregation. Briefly, 5-hydroxymethyl furfural and unknown ester were enriched in D1, D5, D6, and D7. Whereas the highest levels of acetic acid, isopropyl alcohol, 3-hexen-1-ol accounted for D2, D3 & D4 clustering. Compared to the aroma dataset model, the primary metabolites offered a more reliable model for distinguishing between date syrup products. The distinct clustering determined by di-sugars richness emphasizes how crucial carbohydrate profiles are for distinguishing between different products. Future research should explore a combined approach that integrates chemical and sensory analysis to improve distinguishing between syrup products and understanding their distinctive qualities for better consumer appeal.

GC-MS based HCA and PCA of volatile metabolites from date syrup samples (n = 3). (A) HCA plot. (B) Score plot of PC1 vs. PC2 scores. (C) Loading plot for PC1 & PC2 contributing metabolites and their assignments. The metabolome clusters are located at distinct positions in two-dimensional space described by two vectors of principal component 1 (PC1) = 60.7% and PC2 = 20.6%.
UHPLC-MS metabolites profiling of date syrup
Compared to GC-MS efficiency in primary metabolites profiling, UHPLC-MS was adopted to profile more secondary metabolites to likely account for date syrup health benefits. A total of 77 chromatographic peaks were annotated using UHPLC-MS (Fig. 6) of which 33 peaks are reported for the first time in Phoenix dactylifera (Table 2). Metabolites belonged to various metabolite classes including carbohydrates (10), phenolic acids (15), flavonoids (4), lignans (6), fatty acids (17), and terpenoids (5), as listed in Table 2.

Representative total ion chromatogram of date syrup samples in negative (A) and positive (B) ionization mode.
Sugars
Sugars, mainly reducing sugars, are considered the main component of dates48and to account for 73% of date’s dry weight49. UHPLC coupled with MS is currently a powerful analytical tool for sugar analysis50. For the monosaccharide of hexose structure, molecular ion at m/z 179 [M − H]− showed further masses at m/z 161 and 143 due to the subsequent loss of two water moieties51. Peak 9 with a molecular ion peak at m/z 179.055 was assigned as hexose (glucose/ fructose) a major sugar in dates52. Trisaccharides (peaks 3 & 4) and disaccharides (peaks 5, 6, 7, 8 & 25) showed fragment ions at m/z 341 and 179, respectively due to neutral loss of hexose moiety51,53. Peak 8 yielded fragment ions at m/z 179 and 161 corresponding to [M–H–C6H12O6]− and [M–H–C6H12O6–H2O] − and annotated as sucrose which produced due to low invertase activity54. Peak 25 was annotated as acyl sucrose as previously reported55. As with most cultivars of date fruits56date syrup samples exhibited lower levels of di- and tri- sugars compared to mono-sugars.
Phenolic acids
Several studies have reported on date richness in phenolic acids belonging to cinnamates and benzoates49accounting for fruit taste and health benefits. Date fruits are rich in phenolics i.e., caffeic, ferulic, protocatechuic, catechin, gallic, p-coumaric, resorcinol, chlorogenic, and syringic acids, that vary depending on the plant’s origin, variety, extraction process, and measuring technique57. In the present work, a total of 15 phenolic conjugates were detected showing typical neutral losses of H2O [M − H−18]− and CO2 [M − H−44]− characteristic of phenolic acids or their derivatives. A base peak at m/z 179 [M − H−162]− due to the loss of hexose in peak 22 led to its assignment as caffeic acid-O-hexoside. Likewise, peaks 23 and 30 showed fragment ion at m/z 179 diagnostic for caffeic acid led to their identification as dicaffeoyl-O-shikimic acid and caffeoyl-O-shikimic acid, respectively19,55. Peak 29 was annotated as ferulic acid-O-hexoside based on product ion at m/z 193 (deprotonated ferulic acid) post cleavage of a hexose moiety. Additional ferulic acid conjugates were assigned as hydroxyferulic acid (peak 17) and ferulic acid-O-dihexoside (peak 26) showing aglycone moiety of ferulic acid at m/z 1955 and aiding in identification. Other cinnamates were detected in peaks 27, 36 and 41, showing base peak at m/z 119 characteristic for p-coumaric conjugates, and were annotated as p-coumaric acid-O-hexoside, dihydrocoumaric acid and p-coumaric acid, respectively58,59.
Aside from cinnamates, benzoates were also detected in date syrup samples (peaks 18, 19, 20, 24, 28, 31 and 33). MS/MS spectra of peak 18 showed a base peak at m/z 153 due to the loss of hexose, fragment ion at m/z 109 characteristic for protocatechuic acid and annotated as protocatechuic acid-O-hexoside60. Peak 20 was assigned as syringic acid-O-hexoside with MS2 fragments at m/z 197 [M–H–162]− and 153 post loss of CO2. Other identified benzoates included hydroxy benzoic acid (24) and benzoic acid (28)55. It is worth noting that cinnamate derivates were more prevalent than benzoates in date syrup samples under investigation.
Flavonoids and lignans
Flavonoids from different sub-classes including flavonols, flavones, and flavanones glycosides of quercetin, naringenin, myricetin, apigenin, kaempferol, and luteolin have been reported from date fruit19,55,61. Likewise, 4 flavonoids (peaks 32, 38, 44 and 46) belonging to flavones were observed in date syrup samples, with chrysoeriol derivatives as major forms. Chrysoeriol-O-rhamnosyl hexoside (peak 46) was characterized at m/z 607.16846 with fragment ions of chrysoeriol aglycone at m/z 299 and 284 aiding in its identification19. Other chrysoeriol glycosides included chrysoeriol-O-hexoside and chrysoeriol-O-hexosyl sulfate in peaks 38 and 44, respectively with prominent fragment ions at m/z 299. Another flavonoid di-glycoside was assigned as luteolin-O-rhamnosyl hexoside (peak 32) at m/z 593.15479 and yielded fragment ion at m/z 285 (aglycon ion) post sugar moieties cleavage55and suggestive that flavones represent major flavonoid subclass in date syrup.
With regards to lignans, peak 45 at m/z 417.15375 (C22H25O8−) and peak 43 at m/z 579.2099 (C28H35O13−) were annotated as syringaresinol and syringaresinol-O-hexoside, respectively, based on their molecular formula and tandem MS data62. Moreover, peak 42 was annotated as lyoniresinol-O-hexoside with fragments at m/z 419 and 389 due to lose of hexose and -OCH2 moieties, respectively63. Peak 49 at m/z 346.141 (C20H25O6−) was annotated as secoisolariciresinol64 showing fragment ion m/z 346 after the loss of methyl radical. In date syrup samples, lignans were found to be more prevalent than flavonoids based on peak area.
Fatty acids
In the second half of the UHPLC/MS chromatogram, several fatty acids were observed showing late elution considering their nonpolar nature with hydroxy fatty acids mostly predominated. For instance, peaks 52, 63 and 65 were annotated as hydroxy linolenic acid, hydroxy stearic acid and hydroxy palmitic acid, respectively. Moreover, peaks 53 and 55 at m/z 313.23953 and 329.23428 were annotated as dihydroxy oleic acid and trihydroxy oleic acid, respectively. Similarly, peaks 55, 57, 59 and 62 were identified as dihydroxy octadecenoic, dihydroxy octadecanoic, hydroxy-oxo-octadecadienoic and hydroxy-oxo-octadecatetranoic acids respectively. Even though sphingolipids were previously detected in various date parts and products19,55 none were detected in the investigated date syrup samples.
Steroids
Estrone acetate was identified in peak (74) showing fragment ion at m/z 183 due to the successive losses of CH3CO and C5H10O which was previously reported in date palm pollen55. It has also been reported that estrone is present in palm pollens which can be suggestive for the possible admixture during collection65.
Multivariate PCA, HCA and OPLS-DA analyses of UHPLC–MS dataset
PCA and HCA multivariate analysis of UHPLC–MS data
To assess metabolites heterogeneity among data syrups, unsupervised PCA) and hierarchical and HCA were performed. PCA was prescribed by two orthogonal components, accounting for 56% of the total variance, with distinct segregation of samples D2, D3 and D6 at the right side of PC1, while almost all other samples were positioned on the left side of the plot (negative PC1 values) (Fig. 7A). The model explains 56% of the total variance (R2 = 0.56), with positive prediction goodness parameter (Q2 = 0.41) suggesting the validity of the model66 (Fig. S3).

LC/MS-based unsupervised multivariate data analyses of whole sample dataset under investigation. (A) PCA score plot of PC1 versus PC2 scores. (B) PCA loading plot for PC1 and PC2 contributing metabolites and their assignments. (A) HCA plot.
The loading plot (Fig. 7B) revealed that sugars contributed the most in samples discrimination. Disaccharides (peaks 5, 6, 7 and 8) and trisaccharides (peaks 3 and 4) were found enriched in samples D2, D3 and D6. Such a clustering pattern was also revealed in HCA which showed two distinct major groups of 3 and 5 samples (Fig. 7C). Examination of the dendrogram showed that samples D2, D3 and D6 were the most distant ones, and were clustered in two subgroups as D2 (cluster 1a) is clearly segregated from D3 and D6 (cluster 1b), and in agreement with PCA results.
Further, PCA and HCA (Fig. S4C) models were employed to classify date syrup samples with regards to secondary metabolites after excluding sugar peaks. PCA failed to discriminate among samples, with total variance coverage of 27% (Fig. S4A). This value revealed that variance between samples is low and needs more dimensions to cover all aspects67. Investigation of the loading plot (Fig. S4B) revealed that furans i.e. di-furanyldimethylundecatrien-ol (peak 54) and di-furanyltrimethylundecatrien-ol (peaks 56), which could result from sugar oxidation during syrup manufacturing process, accounted for the segregation of samples along PC1.
OPLS-DA multivariate supervised analysis of UHPLC–MS data
OPLS-DA supervised modeling was implemented to confirm results derived from PCA and HCA results regarding date syrup differences in metabolome (Fig. 8).

LC/MS-based OPLS analysis of metabolites analyzed in whole date syrup samples. (A) OPLS-DA score plot (n = 3). The respective loading S-plots (B) show the covariance p[1] against the correlation p(cor)[1] of the variables of the discriminating component of the OPLS-DA model.
The model showed predictability Q2 = 98.5%, total variance coverage R2 = 99.2% and p– value of less than 0.05. The corresponding S-plot revealed that di- and tri-sugars were enriched in samples D2, D3 and D6, while monosaccharides (i.e. hexose) were enriched in the other samples, and in agreement with PCA loading plot results. Notably, phenolics, flavonoids and fatty acids detected in all samples did not contribute for segregation in PCA or OPLS results. Results from PCA, HCA, and OPLS-DA fall in agreement with another report showing that sugars were the predominant metabolite class in the date syrup samples using UHPLC-MS 48. The primary metabolites derived models of both GC-MS and UHPLC–MS demonstrated superior performance in classifying date syrup products compared to the aroma profile classification and the secondary metabolites UHPLC–MS models. Although our data suggest that factors beyond geographic origin contribute to the observed chemical variation, the limited number of samples, especially being of the same batches imposes constraints on the interpretation. With regards to date syrup acquisition of different origins, with only two samples available from Saudi Arabia, it was not possible to establish a statistically valid conclusion on how geographic origin influences the chemical profile of the date syrups.
Total phenolics and flavonoids assays of date syrup samples
Date fruit is rich in phenolic compounds with differences depending on variety type and extraction methods68. The enrichment in phenolics in date syrup samples as revealed via UHPLC/MS analysis (Table 2) prompted assays for determination of total phenolics and flavonoids for standardization purposes, especially since UHPLC/MS models failed to discriminate samples based on phenolics. Considering that D7 did not demonstrate any distinguishing features as a variant in GC-MS or UHPLC–MS data models, proximate assay was performed for D1-D6. Results (Table S3) revealed that D1 exhibited the highest phenolic content (258.083 ± 4.93 mg GAE/g) versus the lowest in D2 (94.944 ± 2.33 mg GAE/g). Total flavonoids showed the same pattern in D1 and D2 respectively at 239.888 ± 6.81 and 53.920 ± 3.41 mg QE⁄g, respectively. This is aligned with findings regarding date fruit that showed high total phenolics and flavonoids considering cultivar type and ripening stage. Importantly, D1 showed higher phenolic and flavonoid content than some date varieties49. Such results pose date syrup as a potential source of phenolics, in agreement with previous reports69and warranting for assessment of its antioxidant effects.
In vitro antioxidant activity of date syrups via DPPH radical scavenging assay
Date fruit exhibits good antioxidant activity attributed to its antioxidants i.e. phenolic acids and flavonoids57,70 and likewise expected in date syrup samples in this study. The DPPH assay was used as a rapid and sensitive method for the evaluation of free radical scavenging ability of date syrup samples. The results are expressed as IC50 values (Fig. S5). All samples exhibited dose-dependent radical scavenging effects, with D1 exhibiting the strongest antioxidant activity (IC50 = 88.20 ± 5.82 µg/mL) followed by D5 (IC50 = 110.64 ± 8.50 µg/mL) when compared to gallic acid (IC50 = 21.55 ± 3.06 µg/ mL). The higher antioxidant potential of D1 and D2 syrups are attributed to their relatively high total phenolic and flavonoid content (Table S3). Clearly, all samples exhibited antioxidant activity that was less than that of gallic acid. Pearson correlation showed a significant negative correlation between total phenolic content and DPPH radical scavenging activity (r = − 0.9822, p < 0.05), as well as between total flavonoid content and DPPH activity (r = − 0.9123, p < 0.05), indicating that flavonoids and phenolics play a significant role in contributing to the antioxidant properties of the analyzed syrups. Further research is recommended to explore the mechanisms of such relationship and its implications for food quality and health benefits.