Sampling frame and participants
Data from the pre-post-intervention study “Proactive automatized lifestyle intervention for cancer prevention: Pilot-test (PAL-Pilot)” were used [22]. The study was approved by the data protection officer and ethics committee of the University Medicine Greifswald (BB 024/17; BB 024/17a).
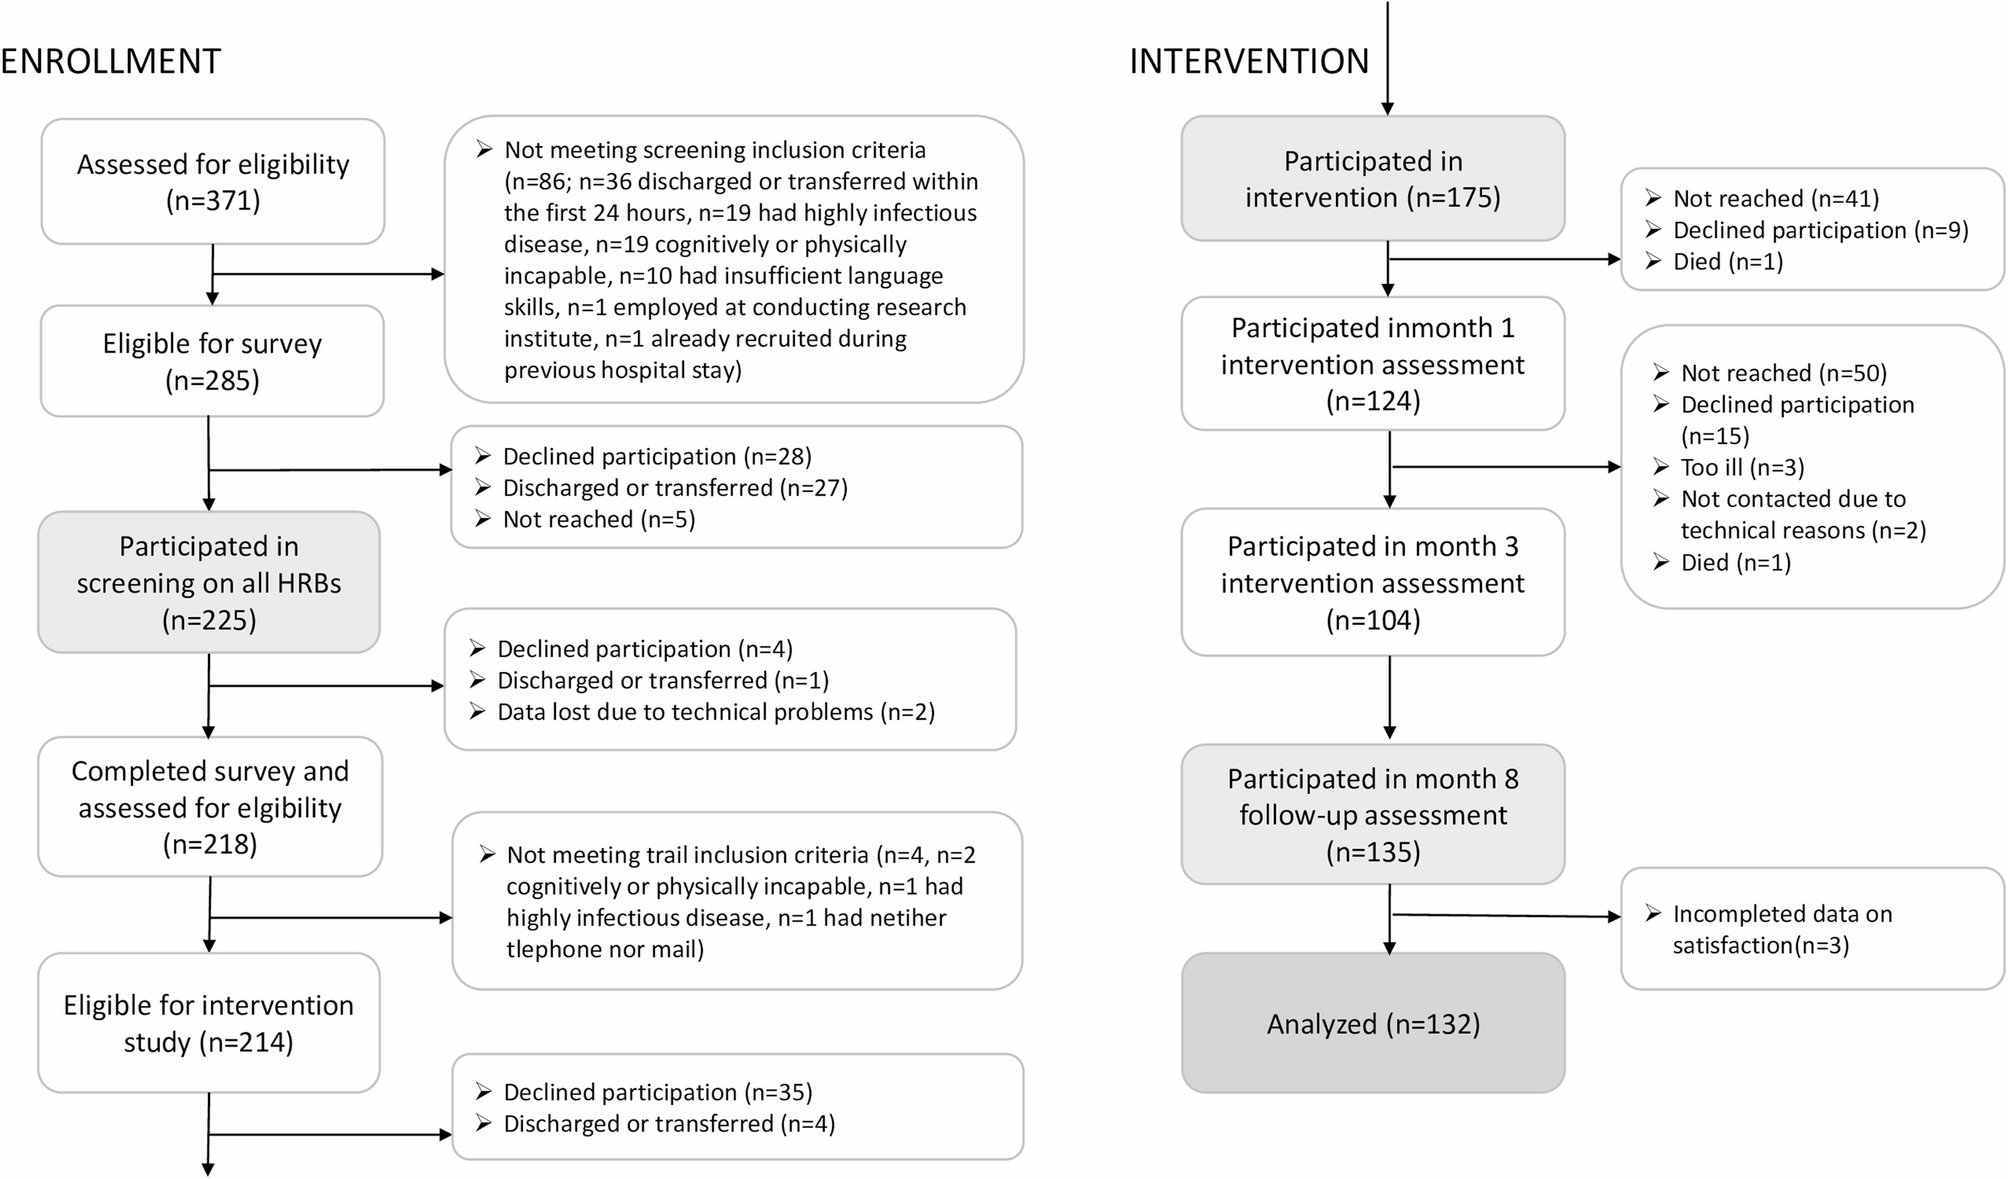
Proactive recruitment took place between May and July 2022 at the University Medicine Hospital Greifswald in Germany on nine wards: general and thorax surgery, trauma surgery, otorhinolaryngology, gastroenterology, endocrinology, nephrology, cardiology, angiology, pneumology. On Tuesdays through Fridays, all patients aged 18–64 years of all sexes and admitted the day before were eligible for inclusion, were approached by a research assistant and were asked to fill in a screening on health behaviors using tablet computers. Patients were excluded if they met any of the following criteria: cognitive or physical incapacity, presence of a highly infectious disease, discharged or transferred outside the study area within the first 24 h of admission, insufficient language skills or employment at the conducting research institute. As described in Fig. 1 and reported in more detail elsewhere [10], 225 of all 285 eligible patients participated in the screening. Of those 214 who completed the screening and eligible for intervention, 175 (81.8%) participated in the intervention study and provided written informed consent.
Patient flow for intervention and follow-up paticipation
Intervention
The Proactive Automatized Lifestyle intervention (PAL) was delivered in the form of computer-generated letters after baseline, after month 1 and after month 3; and targeted tobacco smoking, at-risk alcohol use, diet and insufficient physical activity as described in more detail elsewhere [22]. Proactivity refers to high efforts used to reach all patients by individually approaching them and proactively contacting each participant at each time-point. Proactivity results in high reach, also of those people who are not yet ready to change and/or ready to actively search for such an intervention [1, 21]. High reach is promising in terms of public health impact [23], but also highly relevant for how interventions need to be designed [1]. Automatization refers to highly individualized feedback generated by an expert system software which contained a pool of more than 3000 text modules as well as supporting graphics. Based on assessment data and predefined allocation rules, the software selected appropriate text modules and graphics to individually tailor each feedback letter to the participants’ current stage of change. The theoretical basis, the transtheoretical model of intentional behavior change [24], was originally developed to explain and support behavior change, also among the vast majority of people not yet ready to change. It postulates that persons proceed through different stages of change, and that persons in different stages require different, i.e. stage-tailored, interventions.
First all participants received individualized information on which of the four HRBs were present and not present (See Additional File 1). The intervention then provided more detailed and motivation-enhancing feedback for those HRBs present. To avoid overwhelming patients with three or four HRBs, two HRBs at maximum were selected based on participants’ perception of which HRB change would have the greatest positive impact on their life and on evidence-based considerations as described elsewhere [25]. Furthermore, the intervention included public health recommendations as well as normative and ipsative feedback. Normative feedback reflected on the participant’s current data in comparison to comparable other persons with regards to gender or motivational stage. Ipsative feedback reflected on the participant’s own motivational and behavioral changes from the previous to the current timepoint.
For the two post-baseline interventions, all 175 participants were contacted by phone to conduct computer-assisted telephone interviews to collect assessment data, on which the feedback was based. Of these, 24.0% (n = 42), 21.7% (n = 38) and 54.3% (n = 95) received 1, 2 and 3 feedbacks by ordinary mail, respectively, with a mean intervention dose of 2.3 (SD = 0.8) [10]. As a consequence of the Covid-19 pandemic and technical issues, the originally scheduled month 3 feedbacks were delayed to month 4.
Follow-ups
PAL participants were contacted at month 8 by email to fill in self-administered online questionnaires, originally scheduled for month 6. To enhance follow-up participation, prepaid incentives were sent out (i.e. previously self-selected 10 Euro-vouchers), up to three reminders were sent out by email, and in case of missing response, study staff contacted participants to conduct computer-assisted telephone interviews. If these contact options failed, a paper-pencil questionnaire was sent out by ordinary mail. Of all 175 intervention participants, 135 (77.1%) participated in the follow-up; n = 85 provided their data through participation in computer-assisted telephone interviews, n = 34 through online participation and n = 16 by paper-pencil.
Measurements
Self-report was used (Additional file 2). To check whether the feedback letters had been read, participants were asked “How profoundly did you read the letters?” (not at all/partially/completely). Participants who answered “not at all”, were further asked “Did you keep the letters?” (yes/no). Participants who answered “partially”, were asked “Are there any letters that you have not read at all?” (yes/no). Participants who answered “completely”, were asked “Are there any letters that you have read several times?” (yes/no).
Satisfaction with intervention was measured asking the participants to grade the intervention from 1 (very good) to 6 (deficient) and by using the structure of the multi-dimensional treatment satisfaction measure [14] and items as assessed in Krause et al. [13]. The multidimensional measure incorporated 5-point Likert rating scales (0, strongly disagree to 4, strongly agree) and was computed as the mean of the respective items. Satisfaction with process was assessed using five subscales: suitability (3 items, e.g. feedback was comprehensible, Cronbach’s α = 0.81), utility (4 items, e.g. feedback was helpful, α = 0.87), attitude toward intervention (2 items, e.g. participation was worthwhile, α = 0.76), recommendation to other persons (1 item) and format and dose (3 items, e.g. the amount per feedback was appropriate, α = 0.85). Satisfaction with outcome was assessed using six items. One item assessed the overall attribution of outcomes to intervention (“The intervention encouraged me to make changes”). Four items assessed perceived benefits for each HRB (“Because of the study participation I intend to smoke less [or no] tobacco/drink less [or no] alcohol/pay more attention to healthy diet/be more physically active”, yes/no). One item assessed discomfort (“Have you experienced any discomfort or unpleasant side effects linked to the feedback?”, yes/no). If so, a free text field was provided to report any unpleasant experiences. Total satisfaction with intervention was measured by a total mean score (range: 0–4) computed of all five process subscales and the one item on attribution of outcomes to the intervention (α = 0.90).
Suggestions for improvements were assessed among participants who disagreed with format and dose (scores 0–2). Corresponding items were provided: “What amount per feedback/frequency of feedback/intervals between feedbacks would you consider appropriate?” with response options fewer/more and smaller/larger, respectively.
Patient characteristics were assessed at baseline. Socio-demographics included school education categorized into low (< 10 years of school), medium (10–11 years) and high level (> 11 years), age and sex (male/female). Behavioral HRBs were assessed individually and summed up (0–4). As described in more detail elsewhere [9], any current daily or occasional tobacco smoking was considered as HRB. At-risk alcohol use was determined using the Alcohol Use Disorder Identification Test-Consumption [26] and cut-off values of ≥ 4 for women and ≥ 5 for men [27], corresponding to the national guidelines [28]. Unhealthy diet was determined using the question “How many servings of vegetable and fruit do you eat on average per day?”. Less than 5 servings were considered as unhealthy diet [29]. Physical inactivity was assessed using an adapted version of the European Health Interview Survey-Physical Activity Questionnaire [30]. In accordance to recommendations of the World Health Organization [31], less than 150 min per week of moderate and/or less than 75 min per week of vigorous physical activity were considered as insufficient physical activity.
Any non-communicable disease was considered when cancer, a cardiovascular disease, a chronic respiratory disease or diabetes mellitus were reported. The four non-communicable diseases were assessed by one question each: “Have you ever been diagnosed by a doctor with [cancer/cardiovascular disease/chronic respiratory disease/diabetes mellitus]?”. Examples of diseases were provided for cardiovascular disease (hypertension, myocardial infarction, coronary heart disease, stenocardia, myocardial insufficiency, heart failure) and chronic respiratory disease (chronic bronchitis, chronic obstructive pulmonary disease, pulmonary emphysema). Of all six responses, those three indicating a diagnosis during the current hospital stay, within the past 12 months or more than 12 months ago were considered as the respective disease being present.
Intervention characteristics including information on intervention module (i.e. smoking, alcohol, diet, inactivity) and intervention dose (i.e. 1–3) delivered to participants were derived from the participant management documentation.
Statistical analysis
To determine patients’ satisfaction with the intervention, the number of cases (N) and proportions (%) among eligible patients per item, the means and standard deviations (SD) of the subscales, and the total satisfaction score were provided. To investigate associations between patient characteristics and satisfaction, a multivariable linear regression was calculated with assorted and potentially relevant socio-demographic variables (i.e. age, sex, level of school education), number of HRBs (i.e. 1–4) and presence of any non-communicable disease (i.e. yes/no) as predictors, and controlled for relevant intervention characteristics (i.e. feedback modules received, and intervention dose).
To investigate whether the 135 follow-up participants differed from intervention participants who did not provide follow-up data concerning age, sex, level of school education, number of HRBs, and presence of any non-communicable disease and to adjust potential confounding, a multivariate logistic regression was conducted.
All cases with missing values were excluded listwise. Due to missing values in three intervention participants, the data of 132 follow-up participants was analyzed. Statistical significance was tested with p < 0.05 and the Stata program 17.0 was used for all data analyses [32].