Preparation and characterization of Ag2S super NPs
Microwaves, a kind of nonionizing electromagnetic energy, exhibits a spectral frequency range of 300–300,000MHz [41]. Microwave irradiation is capable of accelerating chemical reactions that are derived from its high energy [42]. In this work, we employed a power-tunable microwave oven to provide the required microwave energy. We fabricated Ag2S super NPs by irradiating a chemically synthesized Ag/Ag2S heterodimers (hereafter referred to as Ag2S NPs) dispersed in CHCl3 with microwave. It is worth noticing that side products, Ag NPs (FigureS1), are generated through our chemical synthesis method (Experimental Section). This phenomenon is attributed to the high redox potential of Ag+ at the synthesis temperature [43]. These Ag NPs in CHCl3 would be transformed into AgCl under the irradiation of microwave. Figure 2 illustrated the morphology and elemental analysis of Ag2S NPs before and after irradiation of microwave. Figure 2a depicts the image of transmission electron microscope (TEM) of Ag2S NPs before irradiation. All the NPs exhibit an elliptical morphology with an average size of approximately 10 nm. One could notice that two distinct contrasts exist within individual NPs, suggesting the formation of two different phases within a single NP. To determine the exact composition of the Ag2S NPs, a high-resolution scanning electron microscope (HRSTEM, Fig. 2b) and elemental analysis (Fig. 2c-e) were performed. The HRTEM image of a single Ag2S NP reveals an analogous yolk-shell crystalline structure, characterized by an electron-dense core and an electron-transparent shell (Fig. 2b). The lattice fringe spacings are d (111) = 2.34 Å for the core part and d (−103) = 2.38 Å for the outer shell. These values correspond well to those of cubic Ag (JCPDS No. 04-0783) and monoclinic Ag2S (JCPDS No. 14–0072) respectively, in turn, directing that the inner core is composed of Ag while the outer shell consists of Ag2S. The light and dark contrasts in the HRTEM image arise from the lower density of Ag2S (7.2 g/cm3) compared to Ag (10.50 g/cm3). The elemental mapping (Fig. 2c-e) demonstrated that core is rich in Ag while S is predominantly distributed in the outer shell part of the synthesized Ag2S NPs. This conclusion is further supported by energy-dispersive X-ray spectroscopy (EDX) analysis (Fig. 2f), presenting a Ag: S ratio of 64:36 for a Ag2S NP. Moreover, X-ray diffraction (XRD) pattern in Fig. 2g confirms both cubic-phase Ag and monoclinic-phase Ag2S, supporting the aforementioned elemental and structural analysis. Collectively, these results indicate that the existence of a Ag core within the as-synthesized Ag2S NPs.
After the irradiation of microwave at 210 W for 2 min, the average diameter of the NPs increased from 10 nm to 12 nm (Fig. 2h). The HRTEM image in Fig. 2i reveals two types of lattice fringe: a dense core with a lattice spacing of d (200) = 2.04 Å directing to cubic Ag and a lighter shell with a lattice distance of d (122) = 2.09 Å corresponding to monoclinic Ag2S. Notably, an amorphous layer approximately 1 nm thick surrounds the NPs, as observed in HRSTEM image. Elemental mapping in Fig. 2(j-l) reveals that the irradiated nanoparticles consist of Ag and S, similar to the Ag2S NPs, with Cl additionally distributed throughout the microwave-irradiated Ag2S NPs (Fig. 2m). This is attributed to the formation of a AgCl layer. The presence of AgCl is further evidenced by the EDX analysis (Fig. 2n) and XRD pattern (Fig. 2o). The microwave-irradiated Ag2S NPs exhibit a Ag: S:Cl ratio of 63:31:6. These findings demonstrate that the Ag2S NPs are composed of cubic Ag and monoclinic Ag2S. Upon microwave irradiation, their composition and structure changed. The distinct formation of a new amorphous AgCl thin outer layer as observed in Fig. 2i and o.
The morphology and elemental analysis of Ag2S NPs before and after irradiation of microwave. (a) TEM image of Ag2S NPs through chemical synthesis process, (b) high-resolution STEM image of a single Ag2S NP presenting lattice fringes d111 and d−103 direct to cubic Ag and monoclinic Ag2S, respectively, elemental mapping of the distribution of Ag (c), S (d) and Ag + S (e) of a Ag2S NP, (f) EDX spectrum of Ag2S NPs before microwave irradiation and corresponding XRD pattern (g), (h) HADDF-STEM image of Ag2S NPs after microwave irradiation at 210 W for 2 min, (i) high-resolution STEM image of a microwave-irradiation Ag2S NP with lattice fringes d200 and d122 stem to cubic Ag and monoclinic Ag2S, respectively, the amorphous shell around the NP was marked with blue line, elemental mapping of the distribution of Ag (j), S (k), Cl (l) and Ag + S + Cl (m) of a microwave-irradiation Ag2S NPs, corresponding EDX spectrum (n) and XRD pattern (o)
Optical properties of Ag2S super NPs and enhancement mechanism
After the irradiation of microwave, the structural changes, illustrated in Fig. 2, significantly enhance their optical properties. Microwave irradiation reduces the absorbance of the samples at the range of 400–800 nm to 30% as shown in Fig. 3a, and this reduction is closely correlated with the irradiation time under 210 W (Figure S2). The absorption spectrum of Ag2S NPs before treatment exhibits a characteristic shoulder around 400 nm which can be attributed to the plasmonic band of Ag2S NPs at a smaller scale [44]. This feature disappears after the microwave irradiation. As depicted in Fig. 3b, the optical images of Ag2S NPs before and after microwave irradiation (210 W, 2 min) dispersed in CHCl3 at 1.5 mg/mL reveal that there is no distinct color change. The brightness of Ag2S NPs, however, is remarkably promoted by microwave irradiation as evidenced by the NIR-II fluorescence image (Fig. 3c). In contrast, it is challenging to detect the NIR-II fluorescence signal to chemically synthesized Ag2S NPs unless the imaging of the irradiated sample is intentionally overexposed. Figure 3d presents the spectra of Ag2S NPs irradiated at 210 W for different durations (1, 2, 4, 6, 8, and 10 min). One could notice that the emission intensity of the irradiated Ag2S NPs increases compared to untreated ones, reaching its maximum enhancement when treated with microwave for 2 min, followed by a gradual decrement with prolonged irradiation time. The spectral shape remains consistent before and after irradiation, suggesting that the chemical composition is unchanged under microwave irradiation. Nevertheless, the peak position presents a red shift (from 1220 nm to 1255 nm, Figure S3). This tiny red shift phenomenon is probably owing to the dissociation of CHCl3 forming reactive chloride, leading to high chloride coverage on the surface of Ag2S NPs [45, 46]. Moreover, the enhancement in emission intensity is corroborated by the fluorescence quantum yield (QY, Fig. 3e) and fluorescence lifetime (Fig. 3f) results obtained from varying durations of microwave irradiation. The QY starts to increase upon exposure to 1-min microwave irradiation and reaches its maximum when exposed to 2-min irradiation. Subsequently, the QY decreases with further increases in irradiation time, a trend that closely aligns with the changes in fluorescence emission. Figure S4 includes representative excitation and emission spectra that have been utilized for QY calculations. Specifically, the QY of the synthesized Ag2S NPs increases from 0.38 to 9.8% after 2-min microwave irradiation at 210 W, representing approximately a 25-fold enhancement. This significant promotion facilitates the microwave-induced transformation of Ag2S NPs into Ag2S super NPs. Correspondingly, the fluorescence lifetime extends from 0.37 µs up to 2.31 µs, as shown in Fig. 3f. The associated decay curves are presented in Fig. 3g. Notably, this lifetime enhancement remains consistent regardless of variations in the concentration of Ag2S super NPs, in turn, eliminating the potential self-absorption effect on the lifetime measurements. (Fig. 3h-i).
To explore the brightness enhancement mechanism and optimal experimental conditions of microwave-irradiation-induced Ag2S super NPs, a series of critical experiments were carried out. Since fluorescence intensity is highly dependent on sample concentration, all the samples were standardized to 1.5 mg/mL after microwave irradiation. Figure 4a presents the time-evolution fluorescence intensity of Ag2S NPs irradiated under various microwave power up to 10 min, corresponding fluorescence spectra are provided in Figure S5. One could notice that the NIR-II emission intensity increases with irradiation time when the microwave power ranges between 70 and 210 W and irradiation time is less than 4 min. Beyond this threshold, the fluorescence intensity remains nearly stable even if the irradiation time is prolonged. Notably, at the irradiation power of 210 W, a 14-fold intensity enhancement was achieved within 2 min, followed by a gradual decrease over prolonged irradiation times. This would be attributed to the degradation of the Ag2S NPs and thermal quench effect under prolonged exposure to 210 W microwave irradiation [28]. When the microwave power exceeds 210 W, the fluorescence intensity would be enhanced quite limited for 1-min irradiation. Subsequently, the intensity decreases with prolonged irradiation until it reaches a stable value. This decrement, on the one hand, mainly owing to the thermal quench effect under high-power microwave, on the other hand, would be due to the uncomplete reaction caused by the rapid evaporation of the solvent (CHCl3) under high-power microwave irradiation after 1 min. Considering these conditions, the color of the samples dispersed in CHCl3 would not have a significant difference. The representative optical photos of the untreated and treated (at the power of 70, 210, 350, 560 and 700 W) samples redispersed in CHCl3 to achieve the same concentration of 1.5 mg/mL are presented in Figure S6. These results, in turn, confirm that the optimal condition for enhancing fluorescence intensity is 210 W irradiation for 2 min.
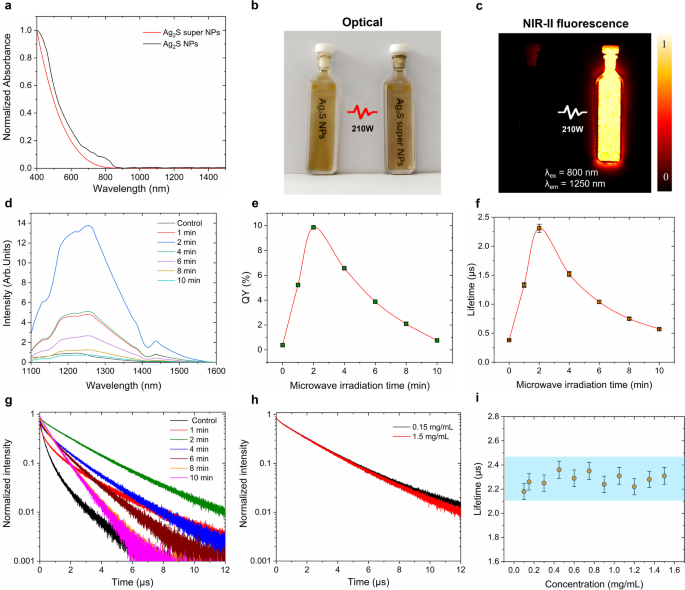
The fluorescence property characterization of Ag2S NPs before and after microwave irradiation. (a) Absorption spectra of Ag2S NPs before (black) and after (red) irradiation of microwave under 210 W for 2 min, (b)optical images of Ag2S NPs before (left) and after (right) irradiation of microwave under 210 W for 2 min, (c) corresponding NIR-II fluorescence images in (b), (d) NIR-II fluorescence spectra of Ag2S NPs with the microwave irradiation at 210 W for different times, corresponding QY values (e) and fluorescence lifetime values (f) in (d), (g) corresponding fluorescence lifetime decay curves of Ag2S NPs after microwave irradiation at 210 W for different time periods, (h) fluorescence lifetime curves of Ag2S NPs at different concentration after microwave irradiation at 210 W for 2 min, (i) lifetime values of Ag2S NPs after microwave irradiation at 210 W for 2 min as a function of concentration. All the measurements were obtained in a dispersion of CHCl3. The error bars in (i) represent three paralleled measurements
For the purpose of investigating whether the solvent properties would affect the transformation, we selected several commonly used organic solvents, including cyclohexane, dimethylsulfoxide (DMSO) and acetonitrile, for further research. Figure 4b demonstrates that the microwave-induced transformation of Ag2S NPs occurs exclusively when the NPs are dispersed in CHCl3. When the NPs dispersed in cyclohexane, dimethylsulfoxide (DMSO) or acetonitrile, the microwave irradiation results in a decrease in their NIR-II fluorescence, suggesting the primary cause is the interplay between microwave-induced thermal loading and the intrinsic thermal quenching of the NIR-II emission of Ag2S NPs (corresponding fluorescence spectra were included in Figure S7). Moreover, the presence of cubic silver core within Ag2S NPs is crucial for the NPs-to-super NPs transformation. As shown in Fig. 4c, microwave irradiation would not enhance the fluorescence intensity of the Ag NP-free Ag2S NPs (corresponding fluorescence spectra were included in Figure S7). Therefore, for the microwave-induced NPs-to-super NPs transformation, both the presence of CHCl3 and the existence of Ag NPs are essential.
At this stage, summarizing all the above experimental findings, a possible schematic explanation for the NPs-to-super NPs transformation is presented in Fig. 4d. Upon microwave irradiation, the high energy absorption by Ag NPs [47] triggers their degradation, leading to a rapid increase in the concentration of highly reactive Ag+ ions in the solution. It is worth noticing that the Ag core would not be affected by microwave irradiation due to its encapsulation by non-microwave-absorbing Ag2S. Subsequently, these Ag+ ions are capable of reacting with solvent CHCl3 to form AgCl, which would be deposited onto the surface of Ag2S NPs under the assistant of microwave irradiation. As a result, after microwave irradiation, low-bandgap Ag2S (0.9 eV) is protectively coated by the high-bandgap (5.13 eV) inorganic shell AgCl. The AgCl shell, on the one hand, protects the Ag2S NPs through the reduction of non-radiative transition induced by the solvent CHCl3 quenching effect. On the other hand, it enables preventing the non-radiative deexcitation pathways caused by potential defects on the surface or inner structure. Moreover, the significant reduction of non-radiative transition further diminishes the portion of light-to-heat conversion efficiency of Ag2S super NPs (Fig. 4e-h), which is further supported by the light-to-heat conversion comparison experiment with low-bright commercial Ag2S NPs (Figure S8).
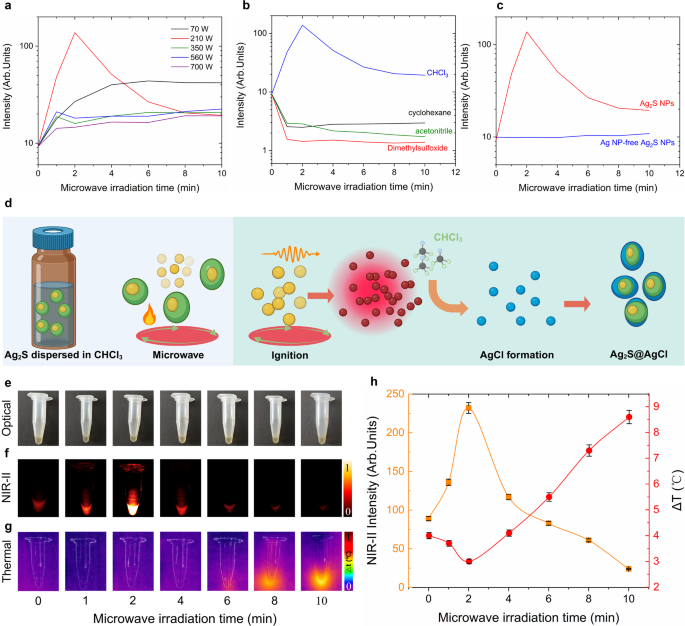
Enhancement mechanism exploration of the Ag2S NPs after irradiation with microwave. (a) NIR-II emitting fluorescence intensity of Ag2S NPs irradiated with microwave at different power (70, 210, 350, 560 and 700 W) for different time (0, 1, 2, 4, 6, 8, 10 min), (b) NIR-II fluorescence intensity of Ag2S NPs dispersed in different solvent irradiated with 210 W microwave for 2 min, (c) NIR-II fluorescence intensity of Ag2S NPs with and without Ag core irradiated with 210 W microwave for 2 min, (d) schematic representation of the enhancement mechanism of Ag2S super NPs, (e) Optical images of Ag2S NPs dispersed in CHCl3 before and after irradiation with microwave at 210 W for different time (1, 2, 4, 6, 8, 10 min), corresponding NIR-II images (f) and thermal images (g), (h) quantification of NIR-II emitting intensity in (f) and temperature increment in (g) as a function of microwave irradiation time. Error bars in (h) are given by the thermal resolution of the thermal camera and by the intensity fluctuations of the infrared camera used for the obtaining of NIR-II fluorescence images
In vivo NIR-II imaging performance of Ag2S super NPs
For the subsequent in vivo performance evaluation, achieving an ideally hydrophilic surface modification of Ag2S super NPs is the priority. Herein, we employed a ligand exchange method (Experimental Section in Supporting Information) to modify HS-PEG-COOH onto the surface of Ag2S super NPs, enabling them to transfer into the phosphate buffer saline (PBS) for further investigation. The hydrodynamic size distribution of PEG-Ag2S super NPs dispersed in different media (water, PBS, serum, DMEM with serum and DMEM) was characterized by dynamic light scattering (DLS, Figure S9). The DLS results demonstrate that the average hydrodynamic size of PEG-Ag2S super NPs in different media is around 200 nm and exhibits stability over a 5-hour continuous monitoring period. One could notice that the DLS results in Figure S9 exhibit a fluctuation around 100 nm in serum and DMEM, which can be attributed to the distinct aggregation behaviors induced by the varying biomolecular and ionic environments present in these media. Through quantitative analysis using inductively coupled plasma mass spectrometry (ICP-MS), we investigated the Ag⁺ release kinetics of PEG-Ag2S super NPs under simulated physiological conditions at pH 7.4 and weakly acidic conditions at pH 5.5 (Figure S10). The experimental results revealed no significant Ag⁺ release under either pH condition, suggesting that the PEG-Ag2S super NPs possesses excellent stability in ion release behavior. These findings, in turn, demonstrate that PEG-Ag2S super NPs exhibit favorable biostability and hold promise for in vivo applications. Furthermore, the cytotoxicity of the PEG-Ag2S super NPs was accessed across different cell lines (MCF-10 A, 293-T, HepG-2 and MCF-7), as shown in Fig. 5a-b. Different cells were incubated with PEG-Ag2S super NPs at concentrations of 10, 25, 50, 100, and 200 µg/mL for 24 h (Fig. 5a) and 48 h (Fig. 5b) respectively. The MTT assay results revealed that the PEG-Ag2S super NPs exhibit no significant cell toxicity at high concentrations up to 200 µg/mL within 48 h, making the PEG-Ag2S super NPs a good candidate for in vivo applications. Moreover, the in vivo biocompatibility of PEG-Ag2S super NPs was systematically evaluated. Specifically, we monitored the time-evolution in body weight, food intake and body temperature of the three 4-week Kunming mice for 15 days after intraperitoneal injection of PEG-Ag2S super NPs dispersed in PBS. The total injection dose for each mouse is 150 µg (300 µL, 0.5 mg/mL, ~ 6 mg/kg), and three additional mice were injected with 300 µL PBS as a control group. As illustrated in Fig. 5c-e, despite a relatively high injection dose, no significant differences were observed between the two groups. Notably, the average body weight of the experimental group increased steadily during the observation period as the control group, in turn, further indicating the injection of PEG-Ag2S super NPs does not interfere with normal metabolic processes. Additionally, for long-term biocompatibility assessment, we performed a 28-day hematological toxicity analysis (Fig. 5f-l and Figure S11) and histological evaluations (Figure S12). The results revealed the time-evolution trend of ALT, AST, ALP, creatinine (CREA), lactate dehydrogenase (LDH), total bilirubin (TBIL) and UREA in mice injected with PEG-Ag2S super NPs (100 µL, 0.15 mg/mL) within 28 days. The concentration of all biomarkers remained within normal physiological ranges throughout the study period. No necrotic or hemorrhagic lesions were detected in any of the analyzed tissues. Collectively, these findings strongly indicate that PEG-Ag2S super NPs are highly biocompatible and non-toxic, making them a promising candidate for in vivo applications.
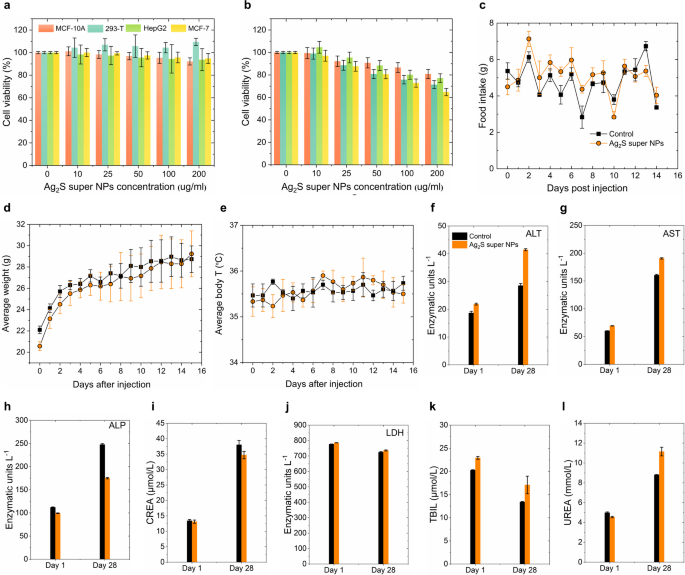
Ex vivo and In vivo cytotoxicity performance of PEG-Ag2S super NPs. Cell viability of MCF-10 A, 293-T, HepG2 and MCF-7 cell after 24 h (a) and 48 h (b) incubation with different concentrations of PEG-Ag2S super NPs in the cell medium as determined by MTT assays. The error bars represent three parallelled measurements. Time evolution of food intake (c), body weight (d) and body temperature (e) of three Kunming mice after intraperitoneal injection of 300 µL of a dispersion of Ag2S super NPs in PBS (0.5 mg/mL, total dose of 150 µg). The results obtained from three control mice injected with 300 µL PBS are included for a comparison. Serum concentration of hepatic enzymes (f, g, and h), creatinine (i), lactate dehydrogenase (j), total bilirubin (k) and urea (l) for mice intravenously injected with Ag2S super NPs and control mice as obtained 1 and 28 days after injection (n = 5 for each group), the error bars correspond to the standard error of the mean
Though the PEG-Ag2S super NPs with good biocompatibility demonstrated successful hydrophilic modification via our approach, concerns regarding potential fluorescence quenching due to this hydrophilic transformation still persist. The fluorescence lifetime of PEG-Ag2S super NPs dispersed in PBS exhibits a value near to 2.1 µs (Figure S13a), indicating that the neither the PEG coating nor dispersion in PBS induces fluorescence quenching in the modified PEG-Ag2S super NPs. This phenomenon, where the decay time remains stable in both CHCl3 and PBS, again reveals the protective capability of the formatted AgCl shell against the photon relaxation process induced by the vibration of H2O molecules [48]. Consequently, the optimized Ag2S super NPs exhibit similar QY values in both solvents. For the sake of the comparison, Figure S13a includes the fluorescence decay curve of commercial PEG-Ag2S NPs dispersed in PBS (obtained from Sinano Corp. China) as well. These commercial NPs exhibit a lifetime value of 55 ns, which is approximately 36 times shorter than that of the PEG-Ag2S super NPs dispersed in PBS. Moreover, the NIR-II images of PEG-Ag2S super NPs and PEG-Ag2S NPs dispersed in different media (PBS, FBS and DMEM) at a concentration of 0.15 mg/mL were included in Figure S13 as well, which reveal the outstanding NIR-II imaging capability of Ag2S super NPs after PEG modification. Consequently, the enlarged lifetime and QY values ensure the capability of the PEG-Ag2S super NPs for subsequent high-quality, low-dose in vivo NIR-II imaging.
For the sake of the straightforward evaluation of the in vivo performance of the Ag2S super NPs, we selected commonly used NIR imaging fluorescent probes, i.e. commercial Ag2S NPs, neodymium-doped rare-earth fluoride NPs (NaGdF4: Nd) and single-walled nanotubes (SWNTs), for a comparison. Four groups of 6-week nude mice (n = 3 for each group) were selected for the comparison study and subjected to a subcutaneous injection with 100 µL of different PBS solutions containing Ag2S super NPs, commercial Ag2S NPs, NaGdF4: Nd and SWNTs at a concentration of 1.5 mg/mL, corresponding to a total NPs injection dose of 5 mg/kg per mouse. As illustrated in Fig. 6a, the in vivo NIR-II fluorescence images were captured for each group under 808 nm-laser irradiation with power density ranging from 1 mW/cm2 to 30 mW/cm2. One could notice that Ag2S super NPs exhibit outstanding brightness compared to all other selected NIR probes under identical experimental conditions. Based on our previous investigation, the brightness affected by possible manufacture variation related to the subcutaneous injection is negligible during the NIR-II imaging observation [39], in turn, the visual NIR emitting performance difference across all the fluorescence probes would be solely attributed to variations in brightness. Thus, the superior brightness of Ag2S super NPs is capable of obtaining the NIR signal even at an extremely low laser irradiation power density of 1 mW/cm2, where no fluorescence signal is detected from any other selected NIR probes. The signal-to-noise ratio (SNR) values of different NIR probes are quantified in Fig. 6b, exhibiting the power density dependence property, which is further illustrated in NIR-II images obtained under different power densities after 30 min of intravenous injection (Fig. 6e-f). Moreover, Fig. 6a reminds us that the synthesized Ag2S super NPs has reduced the minimum excitation power density over 30 times. This approach not only enables in vivo imaging using cost-effective excitation sources but also ensures minimal thermal loading during image acquisition, contributed by Ag2S super NPs or the high-power excitation laser (Figure S14).
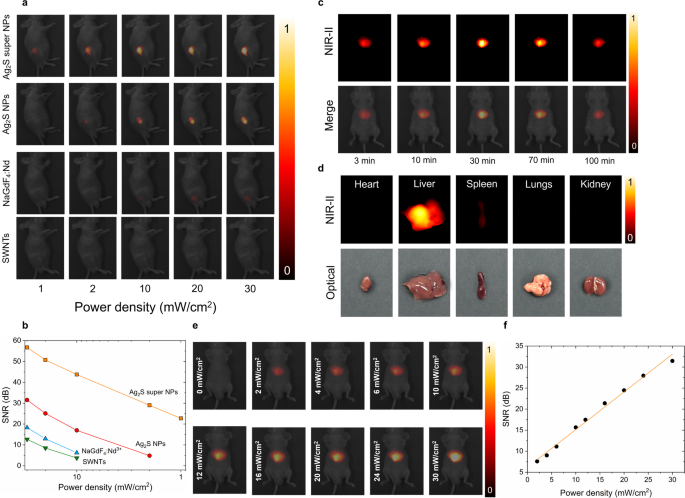
In Vivo imaging performance of PEG-Ag2S super NPs. (a) NIR-II fluorescence images obtained under the 808 nm laser illumination at different power densities from four groups of mice (n = 3 for each group) subcutaneously injected with 100 µL solutions containing Ag2S super NPs, commercial Ag2S NPs, NaGdF4: Nd NPs and SWNTs at a concentration of 1.5 mg/mL, (b) signal-to-noise ratio (SNR) as a function of power density quantified from the analysis of images included in (a), (c) time-evolution NIR-II fluorescence images of the mouse intravenously injected with Ag2S super NPs dispersed in PBS (0.15 mg/mL, 100 µL), (d) NIR-II fluorescence images of ex vivo organs of heart, liver, spleen, lungs and kidney after 100-min intravenously injected with PEG- Ag2S super NPs (100 µL, 0.15 mg/mL) and corresponding optical photos, (e) NIR-II fluorescence images with CD1 mouse intravenously injected with 100 µL PEG-Ag2S super NPs dispersed in PBS at a concentration of 0.15 mg/mL, acquiring under 808 nm laser irradiation at different power density after 30-min injection when the NPs accumulated to liver, and corresponding signal-to-noise-ratio (SNB, f)
With such an outstanding subcutaneous imaging performance of Ag2S super NPs, we subsequently performed an experiment to monitor the in vivo biodistribution of our Ag2S super NPs via intravenous injection (100 µL, 0.15 mg/mL). The total injection dose (15 µg, ~ 0.5 mg/kg) is more than one order of magnitude smaller than the administered dose (6.6 mg/kg) reported for NIR-II biodistribution measurement with Ag2S NPs [49]. The NIR-II images in Fig. 6c were obtained under 808 nm laser at a power density of 30 mW/cm2, which is much lower than the safety threshold at 808 nm (329 mW/cm2) established by the International Commission on Non-ionizing Radiation Protection (ANSI Z136.1-2000) [50]. One could notice that within the first 3 min after injection, parts of the PEG-Ag2S super NPs began to accumulate in the liver with detectable fluorescence signals covering a small area. After that, the majority of PEG-Ag2S super NPs were captured by the liver after 30 min due to the filtration by the reticuloendothelial system, which is corroborated by the ex vivo organs NIR-II images acquired at 100 min after injection (Fig. 6d) and its corresponding quantification results (Figure S15). It should be pointed out that the fluorescence intensity of the liver decreased about 10% at 100 min compared to the one recorded at 30 min, which could be attributed to the partial elimination of Ag2S super NPs by Kupffer cells and liver sinusoidal endothelial cells [51].
In vivo targeted inflammatory imaging with Ag2S super NPs
Based on the outstanding in vivo imaging performance of Ag2S super NPs, it is capable of utilizing PEG-Ag2S super NPs for high-quality and low-dose inflammation imaging. For the sake of that, we established models of myocarditis and gastritis with 4-week-old female mice. Previous research has reported that macrophages positive for the inflammatory chemokine CXC ligand 9 (CXCL9) constitute the most dominant cell type during the acute phase of inflammation [52, 53]. For precise targeting inflammation imaging, a sequence-specific peptide ligand capable of selectively binding to CXCL9 was conjugated onto PEG-Ag2S super NPs and commercial PEG-Ag2S NPs via dehydration synthesis (Experimental section in Supporting Information), in turn, endowing targeting ability to Ag2S NPs for inflamed tissues. Through zeta potential analysis (Figure S16) and high-performance liquid chromatography (HPLC) characterization (Figure S17), we assessed the conjugation efficiency of CXCL9-targeted peptides with PEG-Ag2S super NPs. The results demonstrated a significant shift in zeta potential, from − 34.6 ± 0.2 mV for PEG-Ag2S super NPs to −5.7 ± 0.3 mV for T-Ag2S super NPs (after peptide functionalization), indicating successful conjugation of the CXCL9-targeting peptide. Additionally, the HPLC analysis revealed a retention time of 12 min for the conjugate, which was 8 min shorter than the 20 min retention time of the free peptide, further confirming the formation of the CXCL9 peptide-conjugated structure.
Then, the expression of CXCL9 was further verified in vitro using lipopolysaccharide (LPS)-induced macrophages. As shown in Fig. 7a, immunofluorescence images revealed that LPS-treated RAW 264.7 cells, a typical representative of mouse macrophages, exhibited strong red fluorescent signals after incubation with anti-CXCL9 antibodies. To facilitate visualization, the nuclei and cytoskeleton of LPS-treated RAW 264.7 cells were stained blue and green, respectively. In contrast, no detectable red fluorescence was observed in LPS-untreated macrophages. The significant difference in CXCL9 expression between inflammatory macrophages and normal macrophages was further confirmed by the corresponding statistical analysis in Fig. 7e. Additionally, western blot analysis corroborated these findings (Fig. 7b and f). Having assessed the levels of CXCL9 in LPS-induced macrophages in vitro, we next evaluated the ability of T-Ag2S super NPs to target CXCL9 in LPS-stimulated RAW 264.7 cells. Figure 7d presents a schematic diagram of cell uptake. As the confocal laser scanning microscopy (CLSM) instrument we used in this work cannot detect NIR-II fluorescence signals, Cy5-PEG-NH2-labeled T-Ag2S super NPs (Cy5-T-Ag2S super NPs, CTNPs) and PEG-Ag2S super NPs (Cy5-PEG-Ag2S super NPs, CNPs) were employed for the following cellular uptake studies. The CNPs and CTNPs were then co-incubated with LPS-induced macrophages to investigate the cellular internalization behavior of the NPs. CLSM images of the CTNPs group revealed prominent red fluorescence. In the CNPs group, however, only minimal intracellular red fluorescence was observed (Fig. 7c). Moreover, when LPS-induced macrophages were pretreated with a CXCL9 antibody, the intensity of intracellular red fluorescence was markedly diminished (Fig. 7g). These findings highlight the critical role of CXCL9 targeting in facilitating the effective binding of nanoprobes to inflammatory cells. Consequently, this suggests that T-Ag2S super NPs are more readily phagocytosed by macrophages compared to PEG-Ag2S super NPs, likely due to enhanced CXCL9-mediated interactions. These results provide a solid experimental foundation for the application of inflammation-targeted T-Ag2S super NPs in in vivo inflammatory imaging.
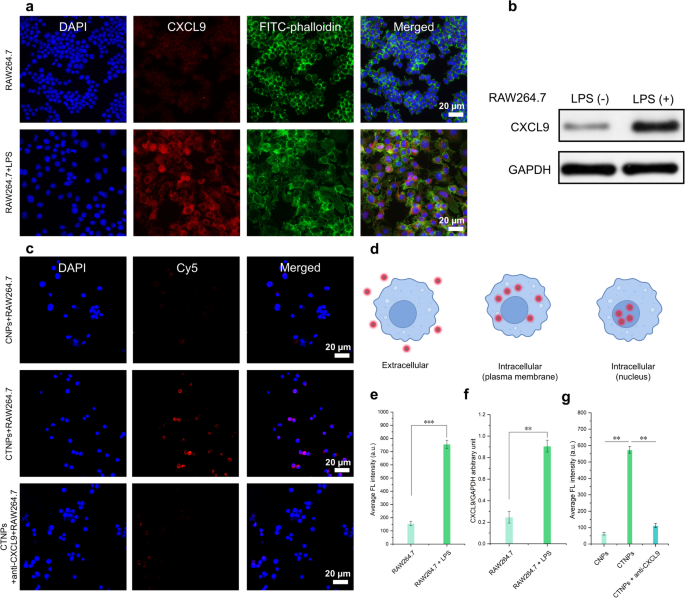
In vitro levels of CXCL9 in LPS-induced macrophages and evaluation of in vitro targeted binding of Ag2S super NPs. (a) Immunofluorescence image of CXCL9 in RAW264.7 cells induced by LPS (100 ng/mL). Blue fluorescence: DAPI; green fluorescence: FITC-phalloidin; red fluorescence: CXCL9. (b) Western blot analysis of CXCL9 expression in RAW264.7 cells. (c) CLSM images of LPS-induced mouse (RAW264.7) macrophages endocytosis of CNPs, CTNPs, and CTNPs + anti-CXCL9. Blue fluorescence: DAPI; red fluorescence: Cy5-PEG-NH2-labeled PEG-Ag2S super NPs or T-Ag2S super NPs. CNPs: Cy5-PEG-Ag2S super NPs, and CTNPs: Cy5-T-Ag2S super NPs. (d) Schematic diagram of cell uptake (e) Statistics of CXCL9 expression based on the average fluorescence intensity of (a). (f) Relative value of CXCL9/GAPDH stripe gray (n = 3). (g) Average fluorescence intensity of each group in (c). Data are represented as mean ± SD (n = 3), ** p < 0.01, ***p < 0.001
To induce gastritis, lipopolysaccharide (LPS) solvent at a concentration of 20 mg/mL (total dose of 50 mg/kg per mouse) was intraperitoneally injected to the mice and then subjected to a continuous monitor physiological status for 5 h until the gastritis model was successfully established. Histopathological and hematological analyses confirmed the successful establishment of the mouse gastritis model (Figure S18). H&E staining of gastric tissues (Figure S18a–b) revealed that, compared with the control group, mice in the gastritis group exhibited marked mucosal structural damage and inflammatory cell infiltration. Furthermore, serum levels of inflammatory markers, including tumor necrosis factor-α (TNF-α), interleukin-6 (IL-6), prostaglandin E₂ (PGE₂), C-reactive protein (CRP), and malondialdehyde (MDA) were significantly elevated (Figure S18c–g), further supporting the successful induction of gastritis in the mouse model. To further present the targeting and outstanding imaging capability of the Ag2S super NPs after targeted peptide modification (T-Ag2S super NPs), mice were randomly divided into four groups: (1) gastritis + T-Ag2S super NPs; (2) gastritis + T-commercial Ag2S NPs (T-c-Ag2S NPs); (3) gastritis + PEG-Ag2S super NPs; (4) healthy + T-Ag2S super NPs. The mice in different groups were intravenously injected with corresponding NPs dispersed in PBS (100 µL, 0.15 mg/mL) and performed continuous NIR-II images acquisition for 90 min (schematic illustration in Fig. 8a). The NIR-II images included in Fig. 8b were obtained 35 min after intravenous injection, the complete images during monitoring for each group were presented in Figure S20-S23 (from 30 s to 90 min). As shown in Fig. 8b, the imaging results reveal a preferential accumulation of targeting-modified Ag2S NPs at the gastritis-affected tissues in the stomach. It is worth noticing that the time-evolution fluorescence intensity of the group injected with T-Ag2S super NPs (Fig. 8c) is significantly brighter than at the gastritis inflammation site compared to that of the group injected with T-c-Ag2S NPs (Fig. 8d). The comparison of NIR-II images of the above two groups and corresponding pixel profile in Figure S24 indicates that the Ag2S super NPs improved the fluorescence signal by 92% compared to commercial Ag2S NPs. On the contrary, when using non-targeted PEG-Ag2S super NPs or in the absence of gastritis inflammation, NIR-II images illustrated that the injected NPs were preferentially accumulated to live due to the retention of nanoparticles in the liver (Fig. 8b). The phenomenon is corroborated by the corresponding time-evolution NIR-emitting fluorescence intensity (Fig. 8e-f) and ex vivo NIR-II images and their quantification histograms (Figure S25-S26). The NIR-II fluorescence images indicate the successful in vivo targeting capability of the T-Ag2S super NPs and T-c-Ag2S NPs to gastritis. More importantly, the results further highlight the superior in vivo imaging performance of the Ag2S super NPs characterized by higher brightness under low-dose injection conditions compared to commercial Ag2S NPs.
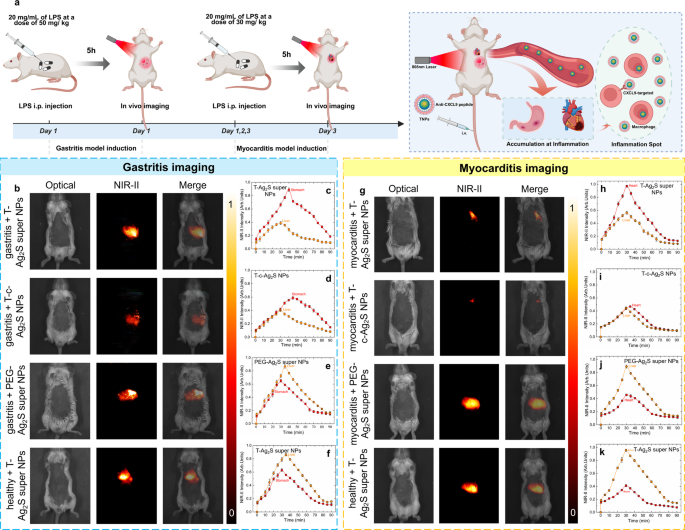
(a) Schematic representation of in vivo targeting inflammatory imaging with Ag2S super NPs, (b) in vivo NIR-II gastritis imaging results with different groups (from up to down): gastritis + T-Ag2S super NPs, gastritis + T-c-Ag2S NPs, gastritis + PEG-Ag2S super NPs, healthy + T-Ag2S super NPs, and their corresponding time-evolution NIR-II fluorescence intensity of stomach and liver (c-f), (g) in vivo NIR-II myocarditis imaging results with different groups (from up to down): myocarditis + T-Ag2S super NPs, myocarditis + T-c-Ag2S NPs, myocarditis + PEG-Ag2S super NPs, healthy + T-Ag2S super NPs, and their corresponding time-evolution NIR-II fluorescence intensity of heart and liver (h-k)
Based on the above gastritis inflammation imaging results, we subsequently conducted in vivo myocarditis imaging. To induce myocarditis, LPS solvent at a concentration of 20 mg/mL (total dose of 30 mg/kg per mouse) was intraperitoneally injected to the mouse and then subjected to a continuous monitor physiological status for 3 days until the myocarditis model was successfully established. The histological and quantitative analyses of inflammatory markers (Figure S19) confirmed the successful establishment of the myocarditis model. Histological images (Figure S19a–b) revealed that the myocardial tissue in the myocarditis group exhibited marked structural disruption along with extensive inflammatory cell infiltration, in clear contrast to the well-preserved structural integrity observed in the control group. Moreover, the measurements of inflammatory markers (Figure S19c–g) showed that the levels of tumor necrosis factor α (TNF-α), cardiac troponin T (cTnT), cardiac troponin I (cTnI), interleukin-6 (IL-6), and creatine kinase isoenzyme (CK-MB) were significantly elevated in the myocarditis group. These increases not only reflect heightened local inflammatory activity but also indicate the occurrence of myocardial cell injury, thereby confirming the successful induction of the myocarditis model in mice. For the sake of bright and targeting imaging, the 4-week female mice were randomly divided into four groups: (1) myocarditis + T-Ag2S super NPs; (2) myocarditis + T-commercial Ag2S NPs (T-c-Ag2S NPs); (3) myocarditis + PEG-Ag2S super NPs; (4) healthy + T-Ag2S super NPs. The mice in each group were intravenously injected with corresponding NPs dispersed in PBS (100 µL, 0.15 mg/mL) and continuous NIR-II imaging was performed every 5 min for a total duration of 90 min. The NIR-II fluorescence images included in Fig. 8g for myocarditis imaging were obtained 30 min after intravenous injection, and the NIR-II images throughout the experimental process in each group were presented in Figure S27-S30. As expected, the NPs modified with targeting peptide, namely T-Ag2S super NPs and T-c-Ag2S NPs, exhibited preferential accumulation in the inflamed heart tissues. On the one hand, it is evident that the brightness of T-Ag2S super NPs improved over 90% than that of T-c-Ag2S NPs as observed through the time-evolution fluorescence intensity in the heart (Fig. 8h-i), which is further supported by the pixel profile included in Figure S31. On the other hand, the NPs without modification of targeting peptide would prefer to predominantly accumulate to the liver (Fig. 8j-k). NIR-II images of ex vivo organs and the quantification results included in Figure S32-S33 reveal that the NPs modified with targeting peptide accumulate to the liver, heart and lungs, while for the healthy + T-Ag2S super NPs or myocarditis + PEG-Ag2S super NPs groups, the fluorescence signal is only observed in liver and spleen. The observation of T-Ag2S super NPs and T-c-Ag2S NPs in the lungs may be attributed to the dysfunction of the alveolar-capillary barrier, which could potentially lead to pulmonary congestion. This, in turn, may impair gas exchange and result in respiratory distress, as previously reported [54, 55]. All the results presented above further revealed the outstanding capability of as-synthesized PEG-Ag2S super NPs for low dose, high-brightness, and high-quality in vivo inflammation imaging.